HAL Id: inserm-00283169
https://www.hal.inserm.fr/inserm-00283169
Submitted on 3 Jun 2008
HAL is a multi-disciplinary open access archive for the deposit and dissemination of sci-entific research documents, whether they are pub-lished or not. The documents may come from teaching and research institutions in France or abroad, or from public or private research centers.
L’archive ouverte pluridisciplinaire HAL, est destinée au dépôt et à la diffusion de documents scientifiques de niveau recherche, publiés ou non, émanant des établissements d’enseignement et de recherche français ou étrangers, des laboratoires publics ou privés.
Training-induced improvement in lipid oxidation in type
2 diabetes mellitus is related to alterations in muscle
mitochondrial activity. Effect of endurance training in
type 2 diabetes.
Sylvain Bordenave, Lore Metz, Sébastien Flavier, Karen Lambert, Edouard
Ghanassia, Anne-Marie Dupuy, Françoise Michel, Anne-Marie Puech-Cathala,
Eric Raynaud, Jean-Frédéric Brun, et al.
To cite this version:
Sylvain Bordenave, Lore Metz, Sébastien Flavier, Karen Lambert, Edouard Ghanassia, et al.. Training-induced improvement in lipid oxidation in type 2 diabetes mellitus is related to alterations in muscle mitochondrial activity. Effect of endurance training in type 2 diabetes.. Diabetes and Metabolism, Elsevier Masson, 2008, 34 (2), pp.162-168. �10.1016/j.diabet.2007.11.006�. �inserm-00283169�
Training-induced improvement in lipid oxidation in type 2 diabetes mellitus
is related to alterations in muscle mitochondrial activity
Effect of endurance training in type 2 diabetes
1 S.Bordenave abc ; 2 L. Metz abc ;3 S. Flavier abc ; 4 K. Lambert abc ; 5 E. Ghanassia abc ; 6
A-M. Dupuy d; 7 F. Michel d ; 8 A-M. Puech-Cathala e; 9 E. Raynaud abc 10 JF. Brun abc and 11
J.Mercier abc
a: INSERM, ERI 25, F-34000 Montpellier, France.
b: Université Montpellier1, UFR Médecine, EA 4202, F-34000 Montpellier, France c: CHU Montpellier, Hôpital Lapeyronie, Service de Physiologie Clinique (CERAMM), F-34295 Montpellier cedex 5, France
d:CHU Montpellier, Hôpital Lapeyronie, Laboratoire de biochimie A des lipides et du stress oxydant, F-34295 Montpellier cedex 5, France
e: CHU Montpellier, Hôpital Lapeyronie, Service de médecine nucléaire, F-34295 Montpellier cedex 5, France
Sylvain Bordenave
INSERM ERI 25, Muscles et Pathologies Bâtiment Crastes dePaulet
Hôpital A de Villeneuve 34295 Montpellier cedex 5 France
Phone : +33 4 67 41 52 30, Fax : +33 4 67 41 52 31 Email : sylvain_bordenave@hotmail.com
Word count: 198 (abstract), 2779 (main text), 1 table, 3 figures
HAL author manuscript inserm-00283169, version 1
HAL author manuscript
Abstract
Aim: We investigated in type 2 diabetic patients (T2D) if an individualized training effect on whole body lipid oxidation is associated with changes in muscle oxidative capacities.
Methods: Eleven T2D participated in this study. Whole body lipid oxidation during exercise was assessed by graded exercise indirect calorimetry. Blood samples for measuring blood glucose and free fatty acids during exercise and muscle oxidative capacities measured from a skeletal muscle biopsy (i.e., mitochondrial respiration and citrate synthase activity) were investigated in T2D before and after a 10-week individualized training targeted at LIPOXmax, which corresponds to the power at which the highest rate of lipids is oxidized (lipid oxidation at LIPOXmax).
Results: Training induced both a shift to a higher power intensity of LIPOXmax (+9.1 ± 4.2 Watts, P<0.05) and an improvement of lipid oxidation at LIPOXmax (+51.27 ± 17.93 mg.min-1, P<0.05). The improvement in lipid oxidation was correlated with training-induced improvement of mitochondrial respiration (r=0.78, P<0.01) and citrate synthase activity (r=0.63, P<0.05).
Conclusion: This study shows that a quite moderate training protocol targeted at the LIPOXmax in T2D mellitus improves the ability to oxidize lipids during exercise, and that this improvement is associated with an enhancement of muscle oxidative capacities.
Key words: exercise, insulin-resistance, mitochondria, skeletal muscle, biopsy
L’amélioration de l’oxydation des lipides induite par l’entraînement est liée aux modifications de l’activité mitochondriale musculaire chez des patients diabétiques de
type 2 Résumé
Objectif: Le but de ce travail était d’étudier chez des sujets diabétiques de type 2 (TD2) si les effets d’un entraînement individualisé sur l’oxydation des lipides étaient liés à l’amélioration des capacités oxydatives musculaires.
Méthodes: Onze T2D ont participé à l’étude. L’oxydation des lipides à l’effort était évaluée à l’aide d’une calorimétrie indirecte d’effort. Des prélèvements sanguins pour les dosages de glycémie et d’acides gras libres au cours de l’exercice ainsi qu’une biopsie musculaire afin d’étudier les capacités oxydatives musculaires (respiration mitochondriale et activité citrate synthase) étaient réalisés chez les DT2 avant et après dix semaines d’entraînement individualisé ciblé au LIPOXmax, qui correspond à la puissance à laquelle l’oxydation des lipides est maximale (oxydation des lipides au LIPOXmax).
Résultats: En réponse à l’entraînement, nous avons observé un déplacement du LIPOXmax vers des puissances supérieures (+9.1 ± 4.2 Watts, P<0.05) et une augmentation de l’oxydation des lipides au LIPOXmax (+51.27 ± 17.93 mg.min-1, P<0.05). Cette amélioration de l’oxydation des lipides était corrélée à l’amélioration de la respiration mitochondriale (r=0.78, P<0.01) et à l’amélioration de l’activité citrate synthase (r=0.63, P<0.05) obtenues en réponse à l’entraînement.
Conclusion: Cette étude montre chez des TD2 qu’un entraînement modéré à faible intensité ciblé au LIPOXmax améliore l’oxydation des lipides au cours de l’exercice, et que cette amélioration est associée à l’amélioration des capacités oxydatives musculaires.
Mots clé: exercice, insulino-résistance, mitochondrie, muscle squelettique, biopsie
Introduction
The prevalence of type 2 diabetes mellitus continues to increase and a sedentary lifestyle and obesity are recognized as key risk factors. Type 2 diabetic patients are characterized by an impaired substrate utilization [1, 2]. Using a specific protocol of exercise calorimetry [3-5] we have recently reported [6] that the defect in lipid oxidation during exercise in these patients can be described in terms of balance of substrates used for oxidation during exercise as a lower maximal peak of lipid oxidation (LIPOXmax), shifted toward lower exercise intensity levels.
In addition, in type 2 diabetes mellitus, skeletal muscle mitochondrial function seems to be disturbed, with, in particular, a reduced activity of the electron transport chain [7-9]. However, this mitochondrial dysfunction remains controversial [10]. Nevertheless, it is well established that mitochondria are rather adaptable organelles directly involved in substrate oxidation and skeletal muscle can manifest considerable plasticity of mitochondrial activity in response to training in insulin resistant states, as in obese humans [11] or in type 2 diabetic patients, as recently shown [12]. Interestingly, the defect in lipid oxidation found in obese and insulin resistant patients is also very sensitive to training, and rapidly corrected by endurance training targeted at the LIPOXmax [4, 13]. It was logic to extend this approach to type 2 diabetes mellitus.
However, the mechanism of this training-induced improvement in lipid oxidation remains poorly understood, since to our knowledge, there is no report on the effect of training investigating changes in whole body lipid oxidation and skeletal muscle oxidative capacities in type 2 diabetic patients.
Thus, the aim of our study was to investigate in type 2 diabetic patients the effects of a 10-week individualized training program carried out at the level of the LIPOXmax (power intensity at which lipid oxidation is maximal) on whole body lipid oxidation and skeletal muscle oxidative capacity.
Methods
Eleven overweight type 2 diabetic male patients (T2D) were enrolled for this study, whom characteristics are for age (years): 55.4 ± 2.2, height (cm): 177 ± 1.3, weight (kg): 90.9 ± 3.1, body mass index (BMI, kg.m-2): 29.0 ± 1.0, fasting blood glucose (mmol.l-1): 8.8 ± 1.0, fasting blood insulin (µU.ml-1): 10.24 ± 2.18 and HbA1c (%): 7.4 ± 0.4. All patients were sedentary, with a score less than 9 (5.70 ± 1.02) obtained with a questionnaire commonly used for subjects with chronic disease [14], and were not engaged in training programs. They were treated only with oral anti-diabetic drugs and none received insulin and had clinical signs of long term diabetic complications. All medications were withheld 24h before the experiment. Informed consent was obtained from all subjects after explanation about the nature of the study and the risks related to their participation to the experiments. The study was approved by our local Ethics Committee (# 03/10/GESE).
Experimental design
Each subject came three times to the laboratory at 8 AM after an overnight fast. The first time was for the enrollment visit, which included clinical examination, a physical activity questionnaire, anthropometric measurements and the signature of the informed consent. Two days later, the subjects came back to the laboratory to perform an exercise test (see below). After another two days, a skeletal muscle biopsy of the vastus lateralis was performed. Afterwards, 2 or 3 days later, T2D started the training program. At the end of the training program, they had a second exercise test and a second skeletal muscle biopsy.
Exercise test
The exercise test was performed at 8 AM after an overnight fast, on an electromagnetically braked cycle ergometer (550 ERG, Bosch, Germany) connected to a breath by breath device (Zan 600, Zan, Germany) to measure gas exchanges (VO2 and VCO2). The test consisted of
five six-minute sub-maximal steady-state workloads corresponding to 20, 30, 40, 50 and 60 % of the maximal theoretical workload (Wmax th). This latter was calculated according to Wasserman’s equations [15]: [(0.79 x H - 60.7) x (50.72 – 0.372 x A)- 350]/10.3 if the patient was obese, and if the subject was not obese: [W x (50.72 – 0.372 x A) -350 ]/ 10.3, with H: height in cm, A: age in year, and W: weight in kg.
Blood samples were drawn at rest and during the last minute of each steady-state workload from a 32-mm catheter placed into a superficial forearm vein, for measurement of blood glucose and free fatty acids.
Indirect calorimetric measurements were performed to determine whole body lipid oxidation. VO2 and VCO2 were determined as the mean of the measurements taken during the
fifth and sixth min of each 6-min steady state workload, according to Perez-Martin and al. [3] Lipid oxidation was calculated on the basis of the gas exchange measurements according to the non-protein respiratory quotient (R) technique [16] since protein breakdown contributes little to energy metabolism during exercise [17]. The values of lipid oxidation was obtained according the following equation [16]:
Lipid oxidation (mg.min –1) = 1.6946 VO2 -1.7012 VCO2
(VO2 and VCO2 are expressed in millilitres per minute).
As previously described by us [3, 13, 18], we calculated a parameter representative of the whole body lipid oxidation during exercise, which is the maximal lipid oxidation point (LIPOXmax) [3, 13, 18], expressed in Watts (W), which corresponds to the exercise intensity at which the highest rate of lipid oxidation is measured (lipid oxidation at LIPOXmax, expressed in mg.min-1). The difference between before and after training was expressed as ∆lipid oxidation at LIPOXmax.
Skeletal muscle biopsies
Vastus lateralis muscle biopsies were taken according to the percutaneous Bergström
technique after local anesthesia (xylocaine). The muscle samples (200-300mg) were divided in two portions. One part was immediately frozen in liquid nitrogen and stored at –80°C for enzymatic determinations (i.e., citrate synthase: CS activity). The other portion was used for the in situ mitochondrial respiration studies and was immediately placed in an ice-cold relaxing solution containing (mM): EGTA-calcium buffer: 10 (free Ca2+ concentration 100
nmol·l-1), Imidazole: 20, KH2PO4: 3, MgCl2: 1, Taurine: 20, DTT: 0.5, MgATP: 5 and, PCr:
15.
Mitochondrial respiration
Respiratory parameters of the total mitochondrial population were analyzed in situ on fresh skeletal muscle fibres as previously described [19]. Bundles of muscle fibres were manually isolated and saponin-skinned (50 µg/ml saponin for 30 min at 4 °C). In order to remove saponin and free ATP, the fibers were then washed with continuous stirring in relaxing solution for 10 min (4°C) followed by 2 x 5min washes in respiration solution at 4°C
(same composition as the relaxing solution, except that MgATP and phosphocreatine were replaced by 3 mM phosphate and 2 mM fatty acid-free bovine serum albumin). After washing, the fibers were stored on ice till used. Respiration rates were determined at 27 °C with a Clark electrode (Strathkelvin Instruments, Scotland) in an oxygraphic cell with continuous stirring in respiration solution. Respiration rates were recorded in the presence of pyruvate (10 mM)/malate (2 mM). For each sample, basal oxygen consumption without ADP was first recorded, and then the ADP-stimulated maximal respiration rate (Vmax) was
determined in the presence of a saturating concentration of ADP (2 mM). At the end of each measurement, cytochrome c was added to investigate the outer mitochondrial membrane integrity [20]. After the following respiratory measurements, the fibre bundles were dried overnight, and weighed the next day. Respirationrates were expressed in micromoles of O2
per minute per gramof dry weight.The difference of Vmax between before and after training was expressed as ∆ Vmax.
Citrate synthase (CS) activity analyses
Frozen muscle biopsies were homogenized in 40 volumes of a solution (pH 8.2) containing (mM): Tris HCl: 50, EDTA: 1 and MgSO4: 5 in a glass homogenizer. The crude
homogenates were then centrifuged for 10 min at 500g and supernatants assayed for and CS activities. CS activity was measured with oxaloacetate 0.38mM and acetyl-CoA at 1.235mM. Enzyme activity was monitored by recording the changes in absorbance at 412nm over 2.5 minutes at 30°C.Results were expressed in micromoles per minute per gram of dry weight. The difference of CS activity between before and after training was expressed as ∆ CS.
Blood analysis
Glycated hemoglobin (HbA1c) was measured at rest. Blood glucose and free fatty acids (FFA) were measured at rest and at each step of the exercise test.
Fasting insulin was assessed by radioimmunoassay (kit Bi Insuline IRMA, Schering CIS bio international, France) and plasma glucose concentrations with an automate (AU2700, Olympus, France). HbA1c was determined by high performance liquid chromatography (HPLC, Ménarini, France). FFA quantification was done using the Wako NEFA C test kit (Wako Chemical GmbH, Dyasis France, France).
Individualized exercise training
The exercise training program consisted of cycling on a cycloergometer for 45 min two times per week during 10 weeks. The heart rate, corresponding to LIPOXmax, was continuously monitored during the training sessions (Polar Cardiometer, France). All training sessions took place at the laboratory under the supervision of a professional instructor.
Data analysis
All statistical analyses were performed using a commercial software package (StatView for Windows, version 5.0). Data are presented as means (±SEM). Effects of training were tested with a paired t-test. Significance of differences among steps of exercise in changes in blood glucose and FFA with the exercise intensity were determined by using an ANOVA for repeated-measures. Post-hoc comparisons were made using Bonferroni-Dunn’s test for significant differences. Correlations were determined by Spearman analysis. P<0.05 was considered significant.
Results
Ten weeks of exercise training targeted to the LIPOXmax did not alter significantly BMI (28.9 ± 1 kg.m-2), fasting blood glucose (8.7 ± 0.5 mmol.l-1), fasting blood insulin (9.13 ± 1.59 µU.ml-1) and HbA1c (7.1 ± 0.3 %). During the exercise test, blood glucose did not change significantly while FFA decreased significantly at each step of exercise compared to rest before and after training (Table 1). However, 10-weeks of exercise training did not significantly alter the values of blood glucose and FFA at rest and during exercise (Table 1). This exercise training has however marked effects on whole body lipid oxidation and muscle oxidative capacities. Indeed, after training, the LIPOXmax was shifted to a higher power intensity (+9.14 ± 4.18 W; P<0.05; Fig 1A) and the lipid oxidation at LIPOXmax was significantly increased compared to pre-training values (+51.3 ± 17.9 mg.min-1; P<0.05; Fig 1B). Moreover, Vmax (Fig 1C) and citrate synthase activity (Fig 1D) were also increased by training. Finally, changes in whole body lipid oxidation were associated with changes in parameters of muscle oxidative capacity. Indeed, correlations were found on one hand between ∆lipid oxidation at LIPOXmax and ∆Vmax (r=0.78, P<0.01, Fig 2) and on the other hand between ∆lipid oxidation at LIPOXmax and ∆ CS (r=0.63, P<0.05, Fig 3).
Discussion
This study shows, in T2D, that a quite moderate training over 10 weeks targeted at the level of LIPOXmax improves the ability to oxidize lipids during exercise, and that this improvement is correlated with an enhancement in both mitochondrial respiration and citrate synthase activity.
Based on our previous studies using calorimetry during steady-state workloads [21] we have developed an exercise test [3] that consists of five 6-min submaximal steps, in which we calculate lipid oxidation from gas exchanges during the 5th and 6th min of each step [22]. This protocol has been used as a basis for targeting endurance training in adolescent and adult obese patients [4, 13], with the aim to specifically improve lipid oxidation at exercise. It was logic to extend this approach to type 2 diabetes mellitus, in whom the ability to oxidize lipids at exercise has also often been reported to be impaired [1, 2, 6]. Indeed, low intensity endurance training targeted at the level of the LIPOXmax in subjects in whom lipid oxidation is impaired [4, 13] has been shown to markedly improve this abnormality, as further observed in the current study.
In T2D, the issue of exercise intensity that should be used for training remains controversial. Over 27 studies reviewed in the recent meta-analysis by Snowling and Hopkins [23], intensities ranging from 40% to 85% of VO2max have been applied. On the whole, all
protocols appear to be beneficial, but the meta-analysis is unable to demonstrate an influence of exercise intensity on the effectiveness of training. A likely explanation of this apparently paradoxical lack of intensity effect may be that the effect of exercise intensity on lipid oxidation at exercise is not linear, but displays a bell-shaped curve reaching a peak at the LIPOXmax, followed by a decrease at higher intensities. Since the LIPOXmax occurs at very low intensity in T2D (38% of VO2max th [6], 37 % of VO2max th in this study), it is likely that
most training protocols targeted above 50 % of VO2max have quite different effects. Exercise
sessions set at such levels, where carbohydrate are the almost only substrate used for oxidation, may mostly enhance the ability to oxidize carbohydrate rather than lipids, as already demonstrated by our group during a longitudinal study of training in cyclists [24]. Presumably, procedures that increase lipid oxidation and procedures that increase carbohydrate oxidation result in different metabolic effects in the muscle cell. Therefore, training closely targeted on lipids, and training targeted on carbohydrate, may be different and complementary procedures.
In this study we thus aimed at studying a protocol targeted on lipid oxidation, since this parameter is impaired in type 2 diabetes mellitus and has been shown to be markedly improved in non-diabetic obese adult subjects and obese children [4, 13] by a similar training protocol. The current study shows a similar improvement in lipid oxidation in a sample of T2D, consistent with a recent study using endurance training at 60-70% of maximal heart rate [12], i.e. a markedly higher intensity corresponding to approximately 50%VO2max. What this
study shows for the first time is that, in T2D, the improvement of whole body lipid oxidation induced by training and particularly the lipid oxidation rate at LIPOXmax during exercise is closely associated with an enhancement of muscle oxidative capacity. In this study, muscle oxidative capacity was investigated by two complementary approaches. The first was the measurement of mitochondrial respiration on permeabilized skeletal muscle fibers, that allows to determine whole mitochondrial activity in situ. This method is now widely validated [10, 25, 26]. However, in our study, we used pyruvate/malate as substrate rather than glutamate/malate because pyruvate is a physiological substrate which allows to investigate the whole mitochondrial activity (Krebs cycle and all complexes of the respiratory chain). The second was the measurement of CS activity which is a well-recognized marker of mitochondrial density in skeletal muscle [27]. Both techniques evidence an improvement of muscle oxidative capacity, proportional to the increase in the ability to oxidize lipids.
Training-induced improvements in skeletal muscle mitochondrial function have already been studied in healthy subjects [28] and in insulin resistant patients, including type 2 diabetes mellitus [12] and obesity, where training induced an increase in size and content of mitochondria [9] and enhanced mitochondrial fatty acid oxidation [11]. However, to our knowledge, our study is the first that demonstrates a relationship between the improvement of whole body lipid oxidation and the enhancement of mitochondrial respiration in T2D by training who have a possible disturbed skeletal muscle mitochondrial function [7-9]. The current finding of a close relationship between mitochondrial adaptation to training and lipid oxidation during exercise in T2D is consistent with the recent report in nondiabetic subjects of a relationship between lipid oxidation and mitochondrial respiration in nondiabetic subjects [29]. However, Nordby and al. [30] reported a lack of relationship between muscle oxidative capacity and whole body peak lipid oxidation in trained and untrained nondiabetic subjects. Presumably, Nordby's paper, which investigates healthy young controls, was unable to detect this relationship because of a lack of markedly low values of these parameters, that remained between a rather narrow normal range and did not exhibit enough variability for obtaining a significant correlation. By contrast, in our study, there was an important range of variation of
this parameter, which may explain why we clearly evidence a relationship that does not appear in Nordby's paper (but appears in Sahlin's one).
Finally, in our study, we found an improvement of lipid oxidation by training without any change on the level of FFA during exercise. This suggests that the main effect of our short and moderate exercise intensity training protocol targeted at the LIPOXmax is probably to improve the use of intramuscular lipids which have been reported increased in T2D [2]. Because we failed to observe significant changes in body composition and parameters of glycaemic control after training, we consider that our training protocol can be proposed as the first step of a rehabilitation program to improve muscle metabolism in T2D but needs to be continued over a longer period of time to reach beneficial effects on body composition and glycaemic control.
In conclusion, this study shows that a quite moderate intensity training protocol targeted at the LIPOXmax improves the ability to oxidize lipids during exercise in T2D, and that this improvement is associated with an improvement in muscle oxidative capacity.
ACKNOWLEDGMENTS
The present study was supported by a Research Grant from Laboratoire MERCK-Médication familiale (Paris, France).
References:
1. Blaak EE, van Aggel-Leijssen DP, Wagenmakers AJ, Saris WH, van Baak MA. Impaired oxidation of plasma-derived fatty acids in type 2 diabetic subjects during moderate-intensity exercise. Diabetes. 2000;49:2102-7.
2. Kelley DE, Simoneau JA. Impaired free fatty acid utilization by skeletal muscle in non-insulin-dependent diabetes mellitus. J Clin Invest. 1994;94:2349-56.
3. Perez-Martin A, Dumortier M, Raynaud E, Brun JF, Fedou C, Bringer J, et al. Balance of substrate oxidation during submaximal exercise in lean and obese people. Diabetes Metab. 2001;27:466-74.
4. Dumortier M, Brandou F, Perez-Martin A, Fedou C, Mercier J, Brun JF. Low intensity endurance exercise targeted for lipid oxidation improves body composition and insulin sensitivity in patients with the metabolic syndrome. Diabetes Metab. 2003;29:509-18.
5. Brandou F, Savy-Pacaux AM, Marie J, Brun JF, Mercier J. Comparison of the type of substrate oxidation during exercise between pre and post pubertal markedly obese boys. Int J Sports Med. 2006;27:407-14.
6. Ghanassia E, Brun JF, Fedou C, Raynaud E, Mercier J. Substrate oxidation during exercise: type 2 diabetes is associated with a decrease in lipid oxidation and an earlier shift towards carbohydrate utilization. Diabetes Metab. 2006;32:604-10.
7. Kelley DE, He J, Menshikova EV, Ritov VB. Dysfunction of mitochondria in human skeletal muscle in type 2 diabetes. Diabetes. 2002;51:2944-50.
8. Mogensen M, Sahlin K, Fernstrom M, Glintborg D, Vind BF, Beck-Nielsen H, et al. Mitochondrial respiration is decreased in skeletal muscle of patients with type 2 diabetes. Diabetes. 2007;56:1592-9.
9. Toledo FG, Watkins S, Kelley DE. Changes induced by physical activity and weight loss in the morphology of intermyofibrillar mitochondria in obese men and women. The Journal of clinical endocrinology and metabolism. 2006;91:3224-7.
10. Boushel R, Gnaiger E, Schjerling P, Skovbro M, Kraunsoe R, Dela F. Patients with type 2 diabetes have normal mitochondrial function in skeletal muscle. Diabetologia. 2007;50:790-6.
11. Bruce CR, Thrush AB, Mertz VA, Bezaire V, Chabowski A, Heigenhauser GJ, et al. Endurance training in obese humans improves glucose tolerance and mitochondrial fatty acid oxidation and alters muscle lipid content. Am J Physiol Endocrinol Metab. 2006;291:E99-E107.
12. Toledo FG, Menshikova EV, Ritov VB, Azuma K, Radikova Z, DeLany J, et al. Effects of physical activity and weight loss on skeletal muscle mitochondria and relationship with glucose control in type 2 diabetes. Diabetes. 2007;56:2142-7.
13. Brandou F, Dumortier M, Garandeau P, Mercier J, Brun JF. Effects of a two-month rehabilitation program on substrate utilization during exercise in obese adolescents. Diabetes Metab. 2003;29:20-7.
14. Voorrips LE, Ravelli AC, Dongelmans PC, Deurenberg P, Van Staveren WA. A physical activity questionnaire for the elderly. Med Sci Sports Exerc. 1991;23:974-9.
15. Wasserman K, J. H, Whipp B. Principles of exercise testing and interpretation. 1986. 16. Peronnet F, Massicotte D. Table of nonprotein respiratory quotient: an update. Can J Sport Sci. 1991;16:23-9.
17. Lemon P. Beyond the Zone: Protein Needs of Active Individuals. . J Am Coll Nutr. 2000;19:513S - 21.
18. Dumortier M, Thoni G, Brun JF, Mercier J. Substrate oxidation during exercise: impact of time interval from the last meal in obese women. Int J Obes (Lond). 2005;29:966-74.
19. Thomas C, Sirvent P, Perrey S, Raynaud E, Mercier J. Relationships between maximal muscle oxidative capacity and blood lactate removal after supramaximal exercise and fatigue indexes in humans. J Appl Physiol. 2004;97:2132-8.
20. Saks VA, Veksler VI, Kuznetsov AV, Kay L, Sikk P, Tiivel T, et al. Permeabilized cell and skinned fiber techniques in studies of mitochondrial function in vivo. Mol Cell Biochem. 1998;184:81-100.
21. Manetta J, Brun JF, Perez-Martin A, Callis A, Prefaut C, Mercier J. Fuel oxidation during exercise in middle-aged men: role of training and glucose disposal. Med Sci Sports Exerc. 2002;34:423-9.
22. Metz L, Sirvent P, Py G, Brun JF, Fedou C, Raynaud E, et al. Relationship between blood lactate concentration and substrate utilization during exercise in type 2 diabetic postmenopausal women. Metabolism. 2005;54:1102-7.
23. Snowling NJ, Hopkins WG. Effects of different modes of exercise training on glucose control and risk factors for complications in type 2 diabetic patients: a meta-analysis. Diabetes Care. 2006;29:2518-27.
24. Manetta J, Brun JF, Maimoun L, Galy O, Coste O, Maso F, et al. Carbohydrate dependence during hard-intensity exercise in trained cyclists in the competitive season: importance of training status. Int J Sports Med. 2002;23:516-23.
25. N'Guessan B, Zoll J, Ribera F, Ponsot E, Lampert E, Ventura-Clapier R, et al. Evaluation of quantitative and qualitative aspects of mitochondrial function in human skeletal and cardiac muscles. Mol Cell Biochem. 2004;256-257:267-80.
26. Ponsot E, Zoll J, N'Guessan B, Ribera F, Lampert E, Richard R, et al. Mitochondrial tissue specificity of substrates utilization in rat cardiac and skeletal muscles. J Cell Physiol. 2005;203:479-86.
27. Hoppeler H. Exercise-induced ultrastructural changes in skeletal muscle. Int J Sports Med. 1986;7:187-204.
28. Walsh B, Tonkonogi M, Sahlin K. Effect of endurance training on oxidative and antioxidative function in human permeabilized muscle fibres. Pflugers Arch. 2001;442:420-5. 29. Sahlin K, Mogensen M, Bagger M, Fernstrom M, Pedersen PK. The potential for mitochondrial fat oxidation in human skeletal muscle influences whole body fat oxidation during low-intensity exercise. Am J Physiol Endocrinol Metab. 2007;292:E223-30.
30. Nordby P, Saltin B, Helge JW. Whole-body fat oxidation determined by graded exercise and indirect calorimetry: a role for muscle oxidative capacity? Scand J Med Sci Sports. 2006;16:209-14.
Legends of tables and figures:
Table 1: Values of blood glucose and FFA at each step of exercise testing before and after training
Before: pre-training values # P<0.01vs values at rest After: post-training values
Figure 1: Characteristics of lipid oxidation during exercise and muscle oxidative capacity before and after training
§ P<0.05 vs pre-training values
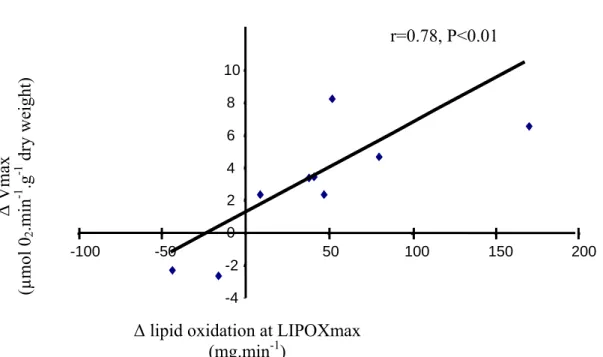
Figure 2: Relation between ∆ lipid oxidation at LIPOXmax and ∆ Vmax
n=9 because two impaired responses were obtained for the cytochrome c test of outer mitochondrial membrane integrity in two different patients, one before and one after training, and thus were not included in the analysis.
Figure3: Relation between ∆ lipid oxidation at LIPOXmax and ∆ CS Pre-training Post-training
Table 1 Rest 20% W m ax th 30% W m ax th 40% Wmax t h 50% Wmax t h 60% Wmax t h Glucose be fo re (m m ol.l -1 ) a fter 8.81± 0.9 6 8.73± 0.4 5 8.54± 0.8 7 8.13± 0.6 5 8.35± 0.8 9 8.01± 0.5 7 7.22± 0.8 9 7.93± 0.6 0 7.71± 0.8 7 8.16± 0.5 8 7.89± 1.0 3 8.12± 0.5 2 FFA before (m m ol.l -1 ) after 0.62± 0.1 0.61± 0.1 0.46± 0.0 7# 0.48± 0.0 8# 0.43± 0.0 6# 0.44± 0.0 7# 0.40± 0.0 5# 0.43± 0.0 8 # 0.34± 0.0 5 # 0.42± 0.0 9 # 0.36± 0.0 4 # 0.41± 0.0 9 #
Figure 1 LIPOXmax 0 10 20 30 40 50 60 70 80 Watts
A
B
Lipid oxidation at LIPOXmax 0 50 100 150 200 250 300 350 mg.min -1 Citrate synthase 0 2 4 6 8 10 12 14 16 18 20 µmol.min -1 .g -1 dry weig htC
Vmax 0 1 2 3 4 5 6 7 8 9 10 µmol O 2 .min -1 .g -1 dry weig htD
§ § § §Figure 2: r=0.78, P<0.01 -4 -2 0 2 4 6 8 10 -100 -50 50 100 150 200 ∆ Vmax (µmol 0 2 .m in -1 .g -1 dry weight)
∆ lipid oxidation at LIPOXmax (mg.min-1)
Figure3: ∆ CS (µmol.min -1 .g -1 dry weight)
∆ lipid oxidation at LIPOXmax (mg.min-1) -10 -5 5 10 15 -100 -50 0 50 100 150 200 r=0.63, P<0.05