HAL Id: hal-01993772
https://hal.umontpellier.fr/hal-01993772
Submitted on 18 Jun 2020HAL is a multi-disciplinary open access archive for the deposit and dissemination of sci-entific research documents, whether they are pub-lished or not. The documents may come from teaching and research institutions in France or abroad, or from public or private research centers.
L’archive ouverte pluridisciplinaire HAL, est destinée au dépôt et à la diffusion de documents scientifiques de niveau recherche, publiés ou non, émanant des établissements d’enseignement et de recherche français ou étrangers, des laboratoires publics ou privés.
Atlantic Ocean
Fany Sardenne, N’Guessan Constance Diaha, Monin Justin Amande, Iker
Zudaire, Lydie I.E. Couturier, Luisa Metral, Fabienne Le Grand, Nathalie
Bodin
To cite this version:
Fany Sardenne, N’Guessan Constance Diaha, Monin Justin Amande, Iker Zudaire, Lydie I.E. Cou-turier, et al.. Seasonal habitat and length influence on the trophic niche of co-occurring tropical tunas in the eastern Atlantic Ocean. Canadian Journal of Fisheries and Aquatic Sciences, NRC Research Press, 2019, 76 (1), pp.69-80. �10.1139/cjfas-2017-0368�. �hal-01993772�
http://dx.doi.org/10.1139/cjfas-2017-0368 http://archimer.ifremer.fr/doc/00436/54796/
http://archimer.ifremer.fr
Seasonal habitat and length influence on the trophic niche
of co-occurring tropical tunas in the eastern Atlantic Ocean
Sardenne Fany 1, 2, *, Diaha N’guessan Constance 3, Amandé Monin Justin 3, Zudaire Iker 4, 5, Couturier Lydie I. E. 2, Metral Luisa 6, Le Grand Fabienne 2, Bodin Nathalie 1, 7
1
Research Institute for Sustainable Development (IRD), UMR MARBEC IRD/CNRS/Ifremer/UM, Centre de Recherche Halieutique, Sète, France
2
University of Western Brittany (UBO), UMR LEMAR CNRS/UBO/IRD/Ifremer, Brest, France
3
Centre de Recherches Océanologiques , Abidjan, Côte d'Ivoire
4
Institut de recherche pour le developpement France-Sud, 98751, UMR MARBEC, Sète, France
5
IKERBASQUE, Basque Foundation for Science, Bilbao, Spain
6
IFREMER, UMR MARBEC IRD/CNRS/Ifremer/UM, Centre de Recherche Halieutique, Sète, France
7
Seychelles Fishing Authority, 280177, Victoria, Mahe, Seychelles
* Corresponding author : Fany Sardenne, email address : fany.sardenne@hotmail.fr
Abstract :
In the Gulf of Guinea, bigeye Thunnus obesus (BET) and yellowfin tuna Thunnus albacares (YFT) are important for commercial fisheries and play a prominent ecological role as top predators. Using fatty acid profiles and carbon and nitrogen stable isotopes we examined their niche partitioning in this understudied region. Niche overlap was high (>70%), similar to percentages in other ocean basins. BET occupied a higher trophic position than YFT and fed on deeper prey (high δ15N values and high proportions of mono-unsaturated fatty acids). The trophic position of YFT decreased slightly in the last 15 years (δ15N values decrease ~0.5 ‰) suggesting a change in epipelagic communities, as observed in the eastern Pacific Ocean. Ontogenic changes were limited to BET. For both species, the dietary proportion of the diatoms marker (20:5n-3) increased in the seasonal upwelling area, highlighting the seasonal habitat influence on tunas diet. The relatively lipid-rich muscle (~6 % dry weight) of Atlantic tropical tunas suggested a richer diet in this region than for Indian Ocean tropical tunas and/or differences in energy allocation strategies.
1. INTRODUCTION 32
Bigeye Thunnus obesus (BET) and yellowfin tuna Thunnus albacares (YFT) are oceanic 33
predators co-occurring in tropical waters worldwide. In the eastern Atlantic Ocean, around 34
200 000 tons of BET and YFT are caught each year, leading to an overexploitation of these 35
species (ICCAT 2015). Tunas occupy high trophic positions in pelagic habitats and their 36
biomass reduction induced by fishing raises concerns about the health of both tuna 37
populations and pelagic ecosystems, especially in a global change context (Chust et al. 2014, 38
Duffy et al. 2017, Hobday et al. 2017). This is a topical issue within the Gulf of Guinea, a 39
productive ecosystem that supports complex food webs, which has been subject to increased 40
pressure from commercial fisheries, human population growth and pollution from domestic 41
and industrial sources in the adjacent countries (Aryeetey 2002, Ukwe et al. 2006). 42
Information on the trophic ecology of tuna in the Gulf of Guinea is limited, especially those 43
relating to ecological tracers (Olson et al. 2016). Ecological tracers are biochemically stable 44
compounds within organisms, including stable isotopes (SI) of carbon and nitrogen and fatty 45
acids (FA). They provide time-integrated information on food assimilated in consumers’ 46
tissues (Ramos and González-Solís 2012) over a period of several weeks to years in fish 47
(Iverson et al. 2004, Madigan et al. 2012). Predictable increase from prey to predator in the 48
nitrogen isotope ratio (15N/14N expressed as δ15N values) allows the determination of trophic 49
position (Vander Zanden et al. 1997). Changes in the carbon isotope ratio (13C/12C expressed 50
as δ13C values) are linked to modifications of the forage habitat (i.e., coastal vs. open ocean) 51
(France 1995). FA are lipid constituents necessary for physiological functions, some of which 52
cannot be readily synthesized by all consumers and are transferred conservatively in food 53
webs. Some ‘essential’ FA, such as docosahexaenoic acid (22:6n-3), eicosapentaenoic acid 54
(20:5n-3) and arachidonic acid (20:4n-6) are best preserved during trophic transfer (Tocher 55
2003). The profile of the FA transferred from prey to predator may inform on the forage taxa 56
(Dalsgaard et al. 2003, Budge et al. 2012). For example, in the pelagic environment, 22:6n-3 57
is generally a marker for dinoflagellates, 20:5n-3 is a marker for diatoms (Dalsgaard et al. 58
2003) and 18:1n-9 is a marker for deep-copepods (Teuber et al. 2014). In the highest trophic 59
levels, transferred FA are better preserved in storage lipids than in structural lipids (Robin et 60
al. 2003, Budge et al. 2012). The quantification of these ecological tracers also allows the 61
estimation of feeding niche extent (niche space) and provides insights into resource 62
partitioning (niche overlap) between co-occurring species (Jackson et al. 2011, Layman et al. 63
2012) including tunas (Teffer et al. 2015, Sardenne et al. 2016). 64
Given their bioenergetics (i.e. regional heterotherms, fast swim), tunas have adapted a 65
generalist foraging strategy in oligotrophic waters worldwide, consuming small fishes, 66
crustaceans, and cephalopods (Olson et al. 2016). In the eastern Atlantic Ocean, more than 67
160 prey taxa have been identified in their stomach content (Dragovich 1970, Dragovich and 68
Potthoff 1972) indicating that diet variability is linked to environmental conditions (e.g. sea 69
surface temperature and mixed-layer depth) (Weng et al. 2009, Parrish et al. 2015, Duffy et al. 70
2017). In the Atlantic Ocean, tropical tunas take advantage of prey aggregations, such as the 71
mesopelagics lightfish Vinciguerria nimbaria (Ménard and Marchal 2003) and the cigarfish 72
Cubiceps pauciradiatus (Ménard et al. 2000, Bard et al. 2002). The different tuna species
73
share a common habitat and often form schools, but BET feeds more on vertically migrating 74
Ommastrephidae squids than YFT (Cherel et al. 2007, Young et al. 2010b, Logan and 75
Lutcavage 2013). Resource partitioning between BET and YFT is however not quantified for 76
tuna populations from the eastern Atlantic. Olson et al. (2016) provided the first bulk isotopic 77
values for tropical tunas in this area, suggesting a slightly higher trophic level of BET 78
compared to other species (i.e., δ15N of 12.7±0.9 ‰ for BET and of 12.2±1.0 ‰ for YFT, 79
between 2000 and 2004). They suggested that these values were affected by a size sampling 80
bias or unaccounted for habitat effects. 81
To build upon this research, we aimed to (i) determine whether seasonal upwelling, length 82
and sex (male vs. female) have an effect on BET and YFT diet using SI and FA; and (ii) 83
quantify feeding niches and partitioning of tunas (i.e. niches extent and overlap). 84
2. MATERIAL & METHODS 85
2.1. Tunas and tissue sampling
86
BET and YFT were caught by purse-seiners operating in the Gulf of Guinea, eastern 87
equatorial Atlantic Ocean, between July 2013 and September 2014. Samples were collected at 88
the landing site (fishing port for BET and “Pêche et froid” cannery for YFT) in Abidjan Port, 89
Ivory Coast (Fig. 1). Fishing dates (Julian days) and coordinates of fishing locations were 90
recovered from vessel logbooks, corresponding to the catch location or catch estimates. Catch 91
estimates are mean data computed from logbooks when anglers have grouped fish from 92
several fishing activities in the brine freezing wells of purse-seiners (maximum uncertainty of 93
33 days and 7.4° square). Catch dates covered July-September and January-February, i.e. 94
seasonal upwelling and non-upwelling periods, respectively. Fork length (FL measured with 95
calliper to the nearest 0.1 cm), sex and macroscopic identification of gonad maturity (visual 96
examination according to Diaha et al. 2016) were determined for each fish. Forty-five BET 97
(22 females, 23 males) and 50 YFT (19 females, 31 males) were selected. Length ranges were 98
111.3±25.8 cm FL for BET and 124.6±22.6 cm FL for YFT and included only developing fish 99
(male and female of gonad macroscopic stage 1–2) as tunas diet may change during the 100
spawning process (Zudaire et al. 2015). Around 2g of front dorsal white muscle tissue and 101
liver were sampled on each fish and stored frozen prior to analyses (-20°C during four months 102
after sampling then -80°C for two years). 103
2.2. Ecological tracers analysis
104
SI analyses were performed on white muscle, the less variable tissue and the most extensively 105
used in fish ecology (Pinnegar and Polunin 1999), while FA profiles were examined from 106
liver tissue, the richest tissue in storage lipids in tropical tunas (Sardenne et al. 2017). In 107
addition, we recorded the muscle lipid content as a proxy of fish body condition (Tocher 108
2003), thereafter included in the term ‘ecological tracers’. 109
2.2.1. Stable isotope analysis and lipid content determination 110
Carbon and nitrogen SI and lipid content were analyzed on 92 freeze-dried muscle samples of 111
tunas (45 BET and 47 YFT, three YFT samples have been lost during lab analysis). Samples 112
were ground up to a fine homogeneous powder with a ball mill MM200 (Retsch). They were 113
then treated with dichloromethane using a Dionex Accelerated Solvent Extractor (ASE 200), 114
as described by Bodin et al. (2009) to remove naturally 13C-depleted lipids that affect δ13C 115
values (Sardenne et al. 2015). Lipid extracts were dried to a constant weight and weighed to 116
the nearest 0.1 mg to determine total lipid content (TLC, in % of dry weight (dw) sample). 117
Lipid-free powders were analyzed for SI using an Elemental Analyser (Flash EA 1112; 118
Thermo Scientific) coupled to an Isotope Ratio Mass Spectrometer (Delta V Advantage with 119
a Conflo IV interface; Thermo Scientific) at the LIENSs Stable Isotope facility (La Rochelle, 120
France). Results were reported in the δ unit notation and expressed as parts per thousand (‰) 121
relative to international standards (atmospheric N2 for nitrogen and Vienna-Pee Dee
122
Belemnite for carbon). Calibration was completed using reference materials (IAEA-N2, -NO-3,
123
-600 for nitrogen; USGS-24, IAEA-CHE, -600 for carbon). Analytical precision based on 124
replicate measurements of internal laboratory standard (acetanilide, Thermo Scientific) was 125
<0.15 ‰ for both δ15N and δ13C. The effectiveness of the chemical extraction of the lipid-free 126
samples was checked by examining the C:N ratio from the percent element weight (C:N < 127
3.5; Post et al. 2007). 128
2.2.2. Fatty acid analysis 129
FA were determined on total lipid extracts of fresh liver samples (45 BET and 50 YFT). 130
Around 165±35 mg of tissue were extracted using a mixture of dichloromethane and methanol 131
(2:1, v/v) with a potter homogenizer (glass/teflon). A known amount of 23:0 fatty acid was 132
added as an internal standard, and extracts were then trans-esterified with sulphuric acid 133
(3.8 % in methanol) at 100°C for 10 min. After addition of 800 µL of hexane and three 134
washes with hexane-saturated distilled water, the fatty acid methyl esters (FAME) were 135
separated and quantified on a Varian CP8400 gas chromatography equipped with a Zebron 136
ZB-WAX column (30 m in length, 0.25 mm internal diameter, 0.25 µm film thickness; 137
Phenomenex) and a flame ionisation detector at the LEMAR Lipidocean facility (Brest, 138
France). Samples were injected in splitless mode at 280°C and carried by hydrogen gas. The 139
oven temperature was raised from 60°C to 150 °C at 50°C/min, to 170 °C at 3.5 °C/min, to 140
185 °C at 1.5 °C/min, to 225 °C at 2.4 °C/min and then to 250°C at 5.5°C/min.. FAMEs were 141
identified by comparing sample retention times to those of a commercial standard mixture 142
(37-components FAME Mix; Sigma) and lab-made standards using Galaxie 1.9.3.2 software 143
(Varian). Individual FA results were expressed as percentage of the total identified FA. 144
Finally, only FA accounting for >1% in at least two samples (n=20) were kept for statistical 145
analyses (Table 1). 146
2.3. Data analysis
147
We used linear regressions or multivariate analyses to examine the relative importance of 148
spatiotemporal (fishing longitude and date) and biological variables (species, length, and sex) 149
on ecological tracers (δ15N and δ13C, TLC and FA profile). There was no collinearity among 150
the five factors (variance inflation factors ranking 1.1 to 4.3). We added to our models the 151
interaction of species*length interaction to detect inter-specific differences in diet shift. For 152
isotopic data and TLC, covariate selection was based on the Akaïke Information Criterion 153
(AIC). ANOVA on multiple regressions and post-hoc t-tests (with t the test value) were then 154
applied on scaled data, and normality of the residuals checked on Q plots (based on the Q-155
Q plot, one TLC outlier of 53.5% was removed from the dataset). For the multivariate FA 156
data, we tested for the equality of variances (using the function Betadisper, an analogous to 157
Levene’s test available in the R package vegan). We then used Permutational multivariate 158
analysis of variance (PERMANOVA; non-parametric) based on the Bray-Curtis distance 159
matrix of the untransformed % FA to test the effect of candidate variables. Untransformed % 160
FA were used to avoid giving artificial weight to FA present in small quantities (Kelly and 161
Scheibling 2012). Differences in individual FA were assessed using Wilcoxon’s tests (with W 162
the test value) for categorical variables (i.e., species and sex) and linear regressions for 163
continuous ones (i.e., longitude, date, and length). 164
Then, we compared tunas’ feeding niches using the R package SIBER (Stable Isotope 165
Bayesian Ellipses in R) (Jackson et al. 2011) on biplots of δ13C and δ15N values and of 166
individual coordinates from dimension 1 and 2 of the principal components analysis (PCA) 167
for the untransformed % FA. For each species, we computed standard ellipses encompassing 168
95% of the data and calculated the Bayesian standard ellipse areas (SEAB) and their credible
169
intervals (50%, 75% and 95%). The SEAB is used as a proxy of the extent of the feeding
170
niche, parallel to the isotopic niche of Layman et al. (2012) and the credible intervals 171
represent the uncertainty surrounding the metric. The SEAB quantifies the feeding niche
172
occupied by each species (i.e., intra-specific) while the overlap between SEAB quantify the
173
feeding niche share by the two species (i.e., inter-specific). We computed a Bayesian estimate 174
for the overlap between the two SEAB and an overlap coefficient (OC, express in %) to
175
quantify the proportion of feeding niche overlap. OC is the ratio between the Bayesian 176
estimates for the overlap and the minimal SEAB filled by a species (similar to the Jaccard
177
similarity coefficient). OC of 0% corresponds to no overlap and of 100 % to a full SEAB
178
overlap. All statistical analyses were performed with R 3.0.2 software. 179
3. RESULTS 180
3.1. Inter- and intra-specific variability of ecological tracers
181
Muscle δ15N values were more variable than δ13C values for both species (BET δ15N: 182
min–max=11.6–14.2 ‰, Coefficient of variation CV=5.0 %; δ13C: -17.6–-16.5 ‰; CV=1.1 % 183
and YFT δ15N: 10.1–13.2 ‰, CV= 7.8 %; δ13C: -17.8–-16.4 ‰; CV=1.7 %). The total lipid 184
content in muscle showed large variations in BET (1.6–36.2% dw, CV=123 %) and YFT 185
(0.5–18.2 % dw, CV=82.6 %). In liver tissue, the three most abundant FA in both BET and 186
YFT were the saturated FA (SFA) 16:0 (BET: 17.4–31.7 %; YFT: 18.0–32.4 %), the poly-187
unsaturated FA (PUFA) 22:6n-3 (BET: 15.9–29.8 %; YFT: 12.9–32.0 %) and the mono-188
unsaturated FA (MUFA) 18:1n-9 (BET: 6.9–25.4 %; YFT: 4.4–24.2 %). Majors FA in the 189
two species also included PUFA 20:5n-3 (BET: 3.3–8.8 %; YFT: 3.4–10.4%) and 20:4n-6 190
(BET: 2.3–8.3 %; YFT: 2.0–6.7 %); MUFA 18:1n-7 (BET: 0.8–4.1 %; YFT: 1.2–4.0%) and 191
16:1n-7 (BET: 1.2–4.1 %; YFT: 1.1–3.8%); SFA 18:0 (BET: 6.1–11.7 %; YFT: 7.9–13.9%) 192
and 17:0 (BET: 1.5–3.0 %; YFT: 1.0–2.0%). Overall, elevated proportions of PUFA n-3 193
(>30 %) compared to PUFA n-6 (<10 %) were found for both species (Table 1). 194
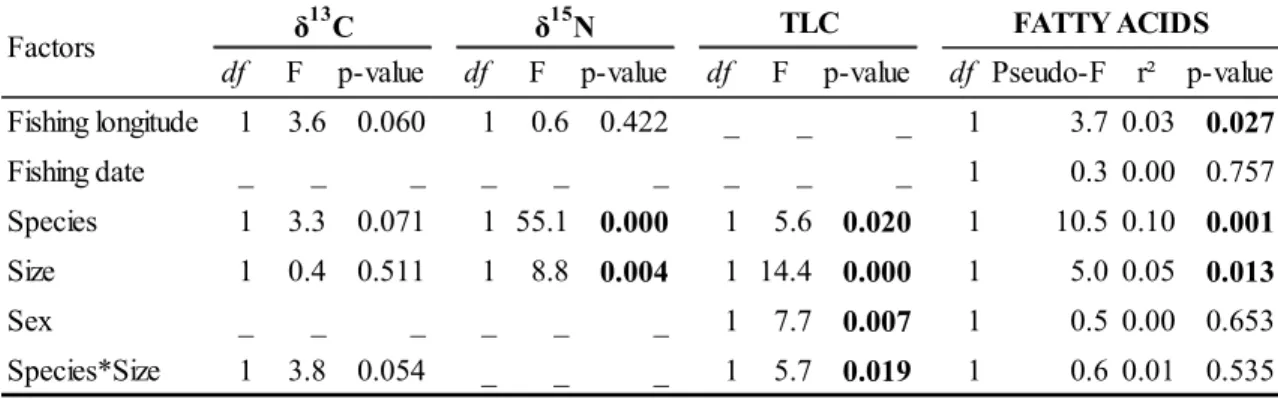
‘Species’ and to a lesser extent ‘length’ had the largest influence on the ecological 195
tracers, especially on δ15N values, TLC and FA profiles (highest F and Pseudo-F; Table 2). 196
The spatiotemporal variables ‘longitude’ affected only FA while ‘fishing date’ has no 197
influence on ecological tracers. First, inter-specific differences were noted with higher δ15N 198
values in BET than YFT (mean±SD = 12.8±0.7 ‰ vs. 11.7±0.9 ‰; t = -7.8, p < 0.001) while 199
a larger intra-specific variability was found in YFT’s values (CV = 5 % for BET vs. 8 % for 200
YFT). TLC was also higher for BET (t = 2.0, p < 0.05) despite a larger intra-specific 201
variability (CV = 133 % for BET vs. 83 % for YFT). Overall, FA profiles and levels of 202
several individual FA were generally different between species (Pseudo-F = 10.5, p < 0.001 203
and Table 1). Main differences concerned 18:1n-9 (ca. 14±5 % for BET vs. 11±6 % for YFT), 204
18:0 (ca. 9±1 % for BET vs. 11±2 % for YFT) and 20:4n-6 (ca. 5±2 % for BET vs. 4±1 % for 205
YFT). In contrast, no inter-specific differences were observed for the two other essential FA, 206
i.e. 22:6n-3 (W = 873, p = 0.06) and 20:5n-3 (W = 1090, p = 0.80). Regarding the main FA 207
classes, SFA were in higher proportions in YFT than BET (ca. 39±3 % vs. 36±5 %; W = 662, 208
p < 0.001), MUFA were higher in BET than YFT (ca. 23±6 % vs. 18±7 %; W = 1625, p < 209
0.001) and no difference was observed for PUFA (40±6 %; W = 882, p = 0.07) (Table 1). 210
Second, BET length explained 33% and 19% of the variance in δ15N values and TLC, 211
respectively. The δ15N values linearly increased with length in BET from 12.7±0.4 ‰ under 212
80 cm to 13.5±0.3 ‰ above 130 cm but no significant increase was observed for YFT (Fig. 213
2a). TLC and its intra-specific variability also increased with length in BET, from 2.5±0.8 % 214
dw (CV = 30 %) for individuals under 80 cm to 13.1±12.6 % dw (CV = 96 %) above 130 cm, 215
while it remained constant in YFT (around 4.5±3.7 % dw; Fig. 2c). Length influenced FA 216
profiles (PERMANOVA, Pseudo-F = 5, p < 0.05) for both species, but results were different 217
for each individual FA and generally unclear because of large variability within species. For 218
example, the proportion of essential n-3 PUFA 20:5n-3 increased with length in BET, from 219
5.0±1.5 % of total FA under 80 cm to 7.7±1.2 % above 130 cm but remained constant in YFT 220
(6.2±1.6 %; CV = 26 %) (Fig. 3a). In contrast, the proportion of essential n-6 PUFA 20:4n-6 221
tended to decrease with length in both species, from 4.9±1.5 % under 80 cm to 3.9±1.1 % 222
above 130 cm (mean±SD for the two species) but the relationship was poor (r² = 0.12) 223
(Fig. 3b). For some other important FA trophic markers, such as 22:6n-3 and 18:1n-9, no 224
relationship with ‘length’ was detected (Fig. 3c and 3d). 225
Finally, longitude influenced the FA profiles (Table 2). The addition of ‘longitude’ as an 226
illustrative variable on PCA indicated an increasing proportion of 20:5n-3, 20:4n-3 and 18:2n-227
6 and a decreasing proportion of 20:4n-6 in tunas’ liver with the longitude value. Between 228
17.6°W and 4°E, the proportion of 20:5n-3 increased similarly in both species from 5.2±0.8% 229
to 6.7±1.6% (mean±SD for the two species; Fig. 4a) and the 20:4n-3 proportion increased 230
from 0.3±0.1% to 0.2±0.6% (Fig 4b). Within this longitude range, the increase of the 18:2n-6 231
proportion was more restricted (mean ranging from 0.8 to 1%; p < 0.05, r²=0.06). A large 232
decrease in the 20:4n-6 proportion was observed in BET only, (mean ranging from 6.7% to 233
3.8% ; p < 0.001, r²=0.28; Fig. 4b). Carbon isotopic values were unaffected by the five tested 234
factors (Table 2). Fish ‘sex’ affected only TLC, females being leaner than males (4.6±5.5% 235
vs. 7.1±8.0%; t=2.7, p < 0.01). ‘Fishing date’ had no effect on any of the ecological tracers
236
analyzed. 237
3.2. Comparison of tropical tuna feeding niches
238
First, feeding niches of BET and YFT mostly overlapped according to both isotopic and FA 239
data. Despite the slightly higher δ15N values of BET, the isotopic feeding niches of the two 240
species overlapped of OC = 76.8±13.7 % (Fig. 5a). This result was in accordance with FA 241
feeding niches of the species, that also had an important overlap (OC = 70.2±8.2 %; Fig. 5b). 242
FA feeding niches were only discriminated on the PCA-Dimension 2 which explained 21.3% 243
of the total variability in FA profiles, and was mainly driven by 20:5n-3 and by minors FA 244
such 24:1n-9, 17:0 18:2n-6 and 22:4n-6 and to a lesser extent by 20:1n-9 and 18:1n-9 (Fig. 245
5b). Second, the extent of tuna feeding niches (proxy of the intra-specific variability) varied 246
across tracers. The isotopic niche extent was smaller for BET than for YFT (t=-192, p < 0.001 247
with all posterior estimates smaller for BET than for YFT; Fig. 5a) while the FA niche extent 248
was larger for BET than for YFT (t=74, p < 0.001 with 89 % of the posterior estimates larger 249
for BET than for YFT; Fig. 5b). Finally, the variability in FA profiles was mainly explained 250
by individual variability among all fish rather than the difference between species (31.1 % of 251
the explained variability was observed on PCA-Dimension 1 while the two species were 252
discriminated on the PCA-Dimension 2; Fig. 5b). 253
4. DISCUSSION 254
Using SI and FA ecological tracers, we quantified for the first time the feeding niches of BET 255
and YFT and their overlap in the eastern Atlantic Ocean. Overall, there was a large overlap in 256
the feeding niches of tropical tunas, despite BET occupying a slightly higher trophic position 257
(higher δ15N values). The fish length appeared to be the most influencing factor for ecological 258
tracers in BET. Spatiotemporal variables had no influence on SI values, while higher 259
proportions of diatoms’ FA marker (20:5n-3) were observed in the liver tissue of tunas caught 260
beyond 5°E during the seasonal upwelling. Essential FA such as 20:5n-3 could therefore be 261
interesting tracers for the monitoring of tuna’s trophic ecology over large spatial scales. Large 262
datasets of SI and FA should allow future studies to consider the effect of other biological and 263
environmental factors (e.g. tuna maturity, sea surface temperature, oxygen conditions) and 264
their interactions that we could not integrate here. 265
4.1. Trophic position of yellowfin decreases in the Atlantic Ocean
266
Spatial changes in baseline nitrogen composition preclude any direct comparison of tuna 267
isotopic values among oceans (Lorrain et al. 2015). In the Indian and Pacific Oceans, the 268
baseline δ15N values change with latitude, probably related to denitrification process in 269
reduced oxygen conditions (Ménard et al. 2007, Lorrain et al. 2015) or diazotrophy in highly 270
oligotrophic areas (Houssard et al. 2017). In the tropical Atlantic Ocean, denitrification occurs 271
in the Caribbean Sea (Gruber and Sarmiento 1997) and upwelling occurs on the African coast, 272
suggesting possible baseline differences between the eastern and western Atlantic Ocean. 273
However, in the Gulf of Guinea, we assumed that the isotopic baseline is similar for these two 274
co-occurring tunas as fishing date and longitude had no effect on tuna isotopic values in our 275
study. BET and YFT are closely related (same genus; Dickson 1996), and because selected 276
individuals were at similar maturity stage and of similar length, we presume that differences 277
in δ15N values did not resulted from physiological specificities. We concluded that higher 278
δ15N values for BET indicate its slightly higher trophic position than YFT (difference of ca. 279
1.1 ‰), with less than one trophic level between the two species (i.e. difference < 3.4 ‰; Post 280
2002). Olson et al. (2016) obtained a smaller difference between the two species in the same 281
region (i.e. 0.5 ‰) due to higher δ15N values for YFT in the past (12.2±1.0 ‰ in 2000-2004 282
vs. 11.7±0.9 ‰ here in 2013-2014). Regardless of possible fish length differences between
283
studies (no length effect detected for YFT here), it appears that the trophic level of YFT has 284
been decreasing over the last ten years. This suggests that either (i) YFT has a high trophic 285
plasticity related to a flexible and opportunistic diet all year round, and thus it is affected by 286
the random sampling; or (ii) as in the eastern Pacific Ocean, a decadal diet shift occurs in 287
YFT with changes in mid-trophic level communities, from large epipelagic fish (0-200 m) to 288
smaller mesopelagic species (200-1000 m), especially crustaceans (Olson et al. 2014). BET 289
feeds at greater depth on mesopelagic species and its trophic level has remained similar across 290
the two studies (δ15N values of 12.7±0.9 ‰ in 2000-2004 vs. 12.8±0.6 ‰ here) suggesting a 291
decline in the trophic level of YFT prey over the last 15 years in the epipelagic ecosystem of 292
the Gulf of Guinea. Changes in the epipelagic communities can have a broader implication on 293
food web balance and stability and should be monitored in the Atlantic Ocean. For example, it 294
may increase predation on mesopelagic communities and favor competition among large 295
predators already suspected to be less resilient to climate change than previously assumed 296
(Lefort et al. 2015, Del Raye and Weng 2015). It might also affect tuna diving behaviour as 297
BET seems to dive according to the food availability in the upper layers (Arrizabalaga et al. 298
2008) and to the thermocline depth (Houssard et al. 2017) . 299
Unfortunately, δ13C values could not be compared with bulk values of Olson et al. (2016) 300
because lipid correction models require bulk C:N ratios (Logan et al. 2008) but changes in 301
carbon sources (forage habitats and phytoplankton taxa) during the last decades should be 302
explored. In the eastern Atlantic Ocean, a reduction of phytoplankton biomass might indeed 303
propagate into the food web through a bottom-up control by the end of the 21st century (Chust 304
et al. 2014). Here, we detected changes in the phytoplankton taxa with an increase of 20:5n-3 305
proportions in tunas collected after the upwelling period started (~ August) between 0° and 306
10°E. This change is consistent with the 20:5n-3-rich diatoms development favored by cool 307
upwelling waters (20–25 °C) in the eastern Gulf of Guinea (Wiafe et al. 2016). FA might thus 308
be an efficient tool to monitor forage taxa of tuna across seasons and years. 309
4.2. Large overlap in the tropical tuna feeding niches
310
Both SI and FA detected large overlaps (>70 %) in tuna feeding niches. Trophic position 311
derived from δ15N values was the main source of difference in tuna feeding niche (see section 312
4.1). The highest trophic position of BET coincides with the δ15N values from the Indian 313
Ocean: ca. 1 ‰ higher in BET than in YFT (Sardenne et al. 2016). Stomach content analyses 314
confirm this trend and shows that BET feeds more on high trophic level prey, such as squids, 315
than YFT (Cherel et al. 2007, Logan and Lutcavage 2013). 316
In contrast, δ13C values were similar between species, probably because phytoplankton is the 317
major source of primary production in the pelagic systems (absence of coastal macroalgae or 318
plants with different isotopic carbon values). Large overlap (ca. 70%) in FA profiles indicated 319
that BET and YFT feed on similar prey species but in different proportions. The higher 320
MUFA proportion for BET compared to YFT (ca. 23±6 % vs. 18±7 %), especially in 18:1n-9, 321
suggest a higher proportion of mesopelagic prey in the diet. In the tropical eastern Atlantic 322
Ocean, MUFA- and 18:1n-9-rich copepods such as Megacalanus princeps are found between 323
400 and 1000 m deep (Teuber et al. 2014) and in the stomachs of small fish ingested by 324
tropical tunas (Dragovich 1970). As a consequence, MUFA are also in great proportion in 325
small fish feeding on mesopelagic copepods such as the myctophids (Saito and Murata 1998) 326
and the cigarfish Cubiceps pauciradiatus (Young et al. 2010a), which are typical tuna prey 327
(Bard et al. 2002, Zudaire et al. 2015). In the Indian Ocean, MUFA are also present in great 328
proportion in tropical tunas >100 cm (Sardenne et al. 2016) which have deep dive capacities 329
and commonly swim down to 900 m depth (Schaefer et al. 2011). The tuna FA profiles 330
confirmed that BET generally feed at greater depth than YFT in the Gulf of Guinea, which is 331
consistent with vertical movement patterns recorded worldwide (Schaefer et al. 2009, Weng 332
et al. 2009). 333
The feeding niche overlaps observed here are larger than those observed in large tunas from 334
the Indian Ocean (no overlap for SI feeding niche and 53 % for FA feeding niche in the 335
Indian Ocean using bootstrapped convex hulls; Sardenne et al. 2016) although difference in 336
metrics may explain these dissimilarities (convex hulls vs. SIBER). Convex hulls would 337
provide lower overlaps here (see Fig. 3) but SIBER was preferred to reduce metrics bias 338
related to sample size (Jackson et al. 2011). 339
4.3. Ontogenic changes are limited
340
Diet change during ontogeny was relatively limited in the present study for tuna ranging 64– 341
174 cm FL. Only the trophic level of BET (through δ15N values) increased linearly with 342
length, but this was not associated with noticeable changes in prey taxa according to FA 343
profiles. No ontogenic change was observed for YFT. Our sampling lacked, however, a robust 344
representation across length classes to detect such early changes. Stomach content analyzes of 345
YFT from the western Atlantic Ocean showed an increase in the proportion of small fish prey 346
in individuals between 70 and 90 cm FL (Vaske et al. 2003). In the Pacific and Indian Oceans, 347
diet changes with length were detected through a fast increase of δ15N values for tunas 348
between 25–55 cm FL (Graham et al. 2006, Sardenne et al. 2016). In the Indian Ocean, δ15N 349
values slowly increased with length in both BET and YFT after 60 cm (ca. 1 ‰ between 60– 350
130 cm) (Ménard et al. 2007, Sardenne et al. 2016) as observed here for BET (Fig. 2a). Due 351
to their opportunist behavior, tunas continue to feed on small prey when larger/adults (Vaske 352
et al. 2003, Ménard et al. 2006), which have lower δ15N values than larger prey (Logan and 353
Lutcavage 2013, Ménard et al. 2014), resulting in intermediate δ15N values for large tunas and 354
limited changes in trophic level across length classes. Most FA proportions did not change 355
with tuna length, contrary to the observations from the Indian Ocean for 18:1n-9 and 22:6n-3 356
(Sardenne et al. 2016). Future work should focus on small and large-sized tuna (20-60 cm and 357
> 180 cm) to investigate ontogenic changes of foraging strategies in these species. 358
4.4. Body condition of tropical tuna
359
Lipids are the primary energy storage form in fish. The lipid content in an individual 360
generally indicates the energy available for vital functions and is therefore a good proxy of 361
fish global condition (Tocher 2003). Tropical tunas face limited seasonal changes in 362
comparison with their temperate counterparts and consequently store fewer lipids in muscle 363
(e.g. TLC~20 % dw in muscle tissue of bluefin tuna T. thynnus; Mourente et al. 2001). Yet, 364
muscle lipid content can provide valuable indication to compare general condition of tropical 365
tuna among regions. Here, the total lipid content of white muscle remained constant among 366
seasons (no influence of fishing date). Total lipid content in the Gulf of Guinea is similar to 367
TLC in the western central Pacific (TLC ~ 6.8±4.8 % dw, n=43; Lydie Couturier, unpubl. 368
data) and higher than in the western Indian Ocean (TLC ~ 2.3±1.1 % dw for both species, 369
n=111; Sardenne et al. 2016) although data from the three basins were collected across 370
different seasons. This suggests two non-exclusive assumptions: (i) BET and YFT food 371
sources are richer in the Atlantic and Pacific Oceans (in quality and/or quantity) which favors 372
energy storage in muscle, or (ii) tunas have different energy allocation strategies among world 373
regions. Tuna condition may indeed depend on prey quality, and seasonal upwelling favor the 374
biomass production from phytoplankton to small fishes which might benefit tunas 375
(Champalbert et al. 2008). Extended studies on the energy allocation strategies of tunas and 376
on lipid content in their prey in relation to the environmental condition (e.g. upwelling 377
intensity) are required to elucidate this point and assess its ecological implications (e.g. 378
vulnerability of populations). Reproduction should be further considered as it seasonally 379
affects lipid content (Mourente et al. 2001, Zudaire et al. 2014) and any decrease in energy 380
allocation to the reproductive process might influence tuna demography. 381
4.5. Future directions 382
Information about the trophic ecology of skipjack tuna Katsuwonus pelamis (over 50% of 383
total catch in the Eastern Atlantic Ocean; ICCAT 2015) sharing schools with small BET and 384
YFT, would improve our understanding of competition among co-occurring species and 385
ontogenic stages. In addition, skipjack tuna and small BET and YFT occur mostly in 386
epipelagic waters and can therefore be an interesting mid-trophic level ‘sampler’ in this 387
stratum (e.g. Cherel et al. 2007). The epipelagic stratum should be more extensively 388
monitored and the use of ecological tracers can be a powerful tool in this context. 389
ACKNOWLEDGMENTS 390
We thank the CRO-IRD-IEO team in charge of tropical tunas purse-seine fisheries monitoring 391
in Abidjan (Ivory Coast) for their help with tunas sampling: B.D.S. Barrigah, Y.D. Irié, D.A. 392
Gbeazere, D. Kouadio, P. Dewals and E. Chassot. We also thank the cannery “Pêche et Froid” 393
and the European purse-seiners for providing fish. We are also very grateful to Noémie Guyot 394
(IRD Representation, Abidjan, Ivory Coast) who kindly helped with the transport of samples 395
between Ivory Coast and France. We thank an anonymous reviewer and the associate editor 396
for comments and detailed suggestions that greatly improved the manuscript. This work is a 397
contribution of the research projects ANR EMOTION and MANTUNA. It was co‐funded by 398
the French Research Institute for Sustainable Development (IRD), the Centre de Recherches 399
Océanologiques (CRO) and the European Data Collection Framework (DCF, Reg 199/2008 400
and 665/2008). FS was funded by the French organization France Fillière Pêche (FFP). LC 401
was supported by the LabexMER (ANR-10-LABX-19) and co-funded by a grant from the 402
French government ("Investissements d'Avenir" program), by a grant from the Regional 403
Council of Brittany (SAD program), and by the EU FP7 Marie Curie actions (PCOFUND-404
GA-2013-609102), through the PRESTIGE program. 405
REFERENCES 406
Arrizabalaga, H., Pereira, J.G., Royer, F., Galuardi, B., Goni, N., Artetxe, I., Arregi, I., and Lutcavage, 407
M. 2008. Bigeye tuna (Thunnus obesus) vertical movements in the Azores Islands determined 408
with pop‐up satellite archival tags. Fish. Oceanogr. 17(2): 74–83. 409
Aryeetey, E.B.-D. 2002. 23 Socio-economic aspects of artisanal marine fisheries management in West 410
Africa. Large Mar. Ecosyst. 11: 323–344. doi:10.1016/S1570-0461(02)80045-3. 411
Bard, F.-X., Kouamé, B., and Hervé, A. 2002. Schools of large yellowfin (Thunnus albacares) 412
concentrated by foraging on a monospecific layer of Cubiceps pauciradiatus, observed in the 413
eastern tropical Atlantic. Col Vol Sci Ap ICCAT 54: 33–41. 414
Budge, S.M., Penney, S.N., and Lall, S.P. 2012. Estimating diets of Atlantic salmon (Salmo salar) 415
using fatty acid signature analyses; validation with controlled feeding studies. Can. J. Fish. 416
Aquat. Sci. 69(6): 1033–1046. doi:10.1139/f2012-039. 417
Champalbert, G.A., Kouamé, B., Pagano, M., and Marchal, E. 2008. Feeding behavior of adult 418
Vinciguerria nimbaria (Phosichthyidae), in the tropical Atlantic (0°–4°N, 15°W). Mar. Biol. 419
156(1): 79. doi:10.1007/s00227-008-1067-z.
420
Cherel, Y., Sabatie, R., Potier, M., Marsac, F., and Ménard, F. 2007. New information from fish diets 421
on the importance of glassy flying squid (Hyaloteuthis pelagica)(Teuthoidea: 422
Ommastrephidae) in the epipelagic cephalopod community of the tropical Atlantic Ocean. 423
Fish. Bull. 105(1): 147–152. 424
Chust, G., Allen, J.I., Bopp, L., Schrum, C., Holt, J., Tsiaras, K., Zavatarelli, M., Chifflet, M., 425
Cannaby, H., Dadou, I., Daewel, U., Wakelin, S.L., Machu, E., Pushpadas, D., Butenschon, 426
M., Artioli, Y., Petihakis, G., Smith, C., Garçon, V., Goubanova, K., Le Vu, B., Fach, B.A., 427
Salihoglu, B., Clementi, E., and Irigoien, X. 2014. Biomass changes and trophic amplification 428
of plankton in a warmer ocean. Glob. Change Biol. 20(7): 2124–2139. doi:10.1111/gcb.12562. 429
Dalsgaard, J., John, M.S., Kattner, G., Müller-Navarra, D., and Hagen, W. 2003. Fatty acid trophic 430
markers in the pelagic marine environment. Adv. Mar. Biol. 46: 225–340. 431
Del Raye, G., and Weng, K.C. 2015. An aerobic scope-based habitat suitability index for predicting 432
the effects of multi-dimensional climate change stressors on marine teleosts. Deep Sea Res. 433
Part II Top. Stud. Oceanogr. 113: 280–290. doi:10.1016/j.dsr2.2015.01.014. 434
Diaha, N.C., Zudaire, I., Chassot, E., Barrigah, B.D., Irié, Y.D., Gbeazere, D.A., Kouadio, D., 435
Pecoraro, C., Romeo, M.U., and Murua, H. 2016. Annual monitoring of reproductive traits of 436
female yellowfin tuna (Thunnus albacares) in the eastern Atlantic Ocean. Collect Vol Sci Pap 437
ICCAT 72: 534–548. 438
Dickson, K.A. 1996. Locomotor muscle of high-performance fishes: what do comparisons of tunas 439
with ectothermic sister taxa reveal? Comp. Biochem. Physiol. A Physiol. 113(1): 39–49. 440
doi:10.1016/0300-9629(95)02056-X. 441
Dragovich, A. 1970. The food of skipjack and yellowfin tunas in the Atlantic Ocean. Fish. Bull. 68(3): 442
445–460. 443
Dragovich, A., and Potthoff, T. 1972. Comparative study of food of skipjack and yellowfin tunas off 444
the coast of West Africa. Fish. Bull. 70(4): 1087–1110. 445
Duffy, L.M., Kuhnert, P., Pethybridge, H.R., Young, J.W., Olson, R.J., Logan, J.M., Goñi, N., 446
Romanov, E., Allain, V., Staudinger, M., Abecassis, M., Choy, C.A., Hobday, A.J., Simier, 447
M., Galván-Magaña, F., Potier, M., and Ménard, F. 2017. Global trophic ecology of yellowfin, 448
bigeye, and albacore tunas: understanding predation on micronekton communities at ocean-449
basin scales. Deep Sea Res. Part II Top. Stud. Oceanogr. doi:10.1016/j.dsr2.2017.03.003. 450
France, R.L. 1995. Carbon-13 enrichment in benthic compared to planktonic algae: foodweb 451
implications. Mar. Ecol. Prog. Ser. 124: 307–312. doi:10.3354/meps124307. 452
Gruber, N., and Sarmiento, J.L. 1997. Global patterns of marine nitrogen fixation and denitrification. 453
Glob. Biogeochem. Cycles 11(2): 235–266. doi:10.1029/97GB00077. 454
Hobday, A.J., Arrizabalaga, H., Evans, K., Scales, K.L., Senina, I., and Weng, K.C. 2017. 455
International collaboration and comparative research on ocean top predators under CLIOTOP. 456
Deep Sea Res. Part II Top. Stud. Oceanogr. 140: 1–8. doi:10.1016/j.dsr2.2017.03.008. 457
Houssard, P., Lorrain, A., Tremblay-Boyer, L., Allain, V., Graham, B.S., Menkès, C., Pethybridge, H., 458
Couturier, L.I.E., Point, D., Leroy, B., Receveur, A., Hunt, B.P.V., Vourey, E., Bonnet, S., 459
Rodier, M., Raimbault, P., Feunteun, E., Kuhnert, P.M., Munaron, J.-M., Lebreton, B., Otake, 460
T., and Letourneur, Y. 2017. Trophic position increases with thermocline depth in yellowfin 461
and bigeye tuna across the Western and Central Pacific Ocean. Prog. Oceanogr. 154: 49–63. 462
doi:10.1016/j.pocean.2017.04.008. 463
ICCAT. 2015. ICCAT stock assessments. Available from https://www.iccat.int/en/assess.htm 464
[accessed 19 April 2017]. 465
Iverson, S.J., Field, C., Don Bowen, W., and Blanchard, W. 2004. Quantitative fatty acid signature: a 466
new method of estimating predator diets. Ecol. Monogr. 74(2): 211–235. doi:10.1890/02-467
4105. 468
Jackson, A.L., Inger, R., Parnell, A.C., and Bearhop, S. 2011. Comparing isotopic niche widths among 469
and within communities: SIBER–Stable Isotope Bayesian Ellipses in R. J. Anim. Ecol. 80(3): 470
595–602. 471
Kelly, J., and Scheibling, R. 2012. Fatty acids as dietary tracers in benthic food webs. Mar. Ecol. Prog. 472
Ser. 446: 1–22. doi:10.3354/meps09559. 473
Layman, C.A., Araujo, M.S., Boucek, R., Hammerschlag‐Peyer, C.M., Harrison, E., Jud, Z.R., Matich, 474
P., Rosenblatt, A.E., Vaudo, J.J., and Yeager, L.A. 2012. Applying stable isotopes to examine 475
food‐web structure: an overview of analytical tools. Biol. Rev. 87(3): 545–562. 476
Lefort, S., Aumont, O., Bopp, L., Arsouze, T., Gehlen, M., and Maury, O. 2015. Spatial and body-size 477
dependent response of marine pelagic communities to projected global climate change. Glob. 478
Change Biol. 21(1): 154–164. doi:10.1111/gcb.12679. 479
Logan, J.M., Jardine, T.D., Miller, T.J., Bunn, S.E., Cunjak, R.A., and Lutcavage, M.E. 2008. Lipid 480
corrections in carbon and nitrogen stable isotope analyses: comparison of chemical extraction 481
and modelling methods. J. Anim. Ecol. 77(4): 838–846. doi:10.1111/j.1365-482
2656.2008.01394.x. 483
Logan, J.M., and Lutcavage, M.E. 2013. Assessment of trophic dynamics of cephalopods and large 484
pelagic fishes in the central North Atlantic Ocean using stable isotope analysis. Deep Sea Res. 485
Part II Top. Stud. Oceanogr. 95: 63–73. doi:10.1016/j.dsr2.2012.07.013. 486
Lorrain, A., Graham, B.S., Popp, B.N., Allain, V., Olson, R.J., Hunt, B.P.V., Potier, M., Fry, B., 487
Galván-Magaña, F., Menkes, C.E.R., Kaehler, S., and Ménard, F. 2015. Nitrogen isotopic 488
baselines and implications for estimating foraging habitat and trophic position of yellowfin 489
tuna in the Indian and Pacific Oceans. Deep Sea Res. Part II Top. Stud. Oceanogr. 113: 188– 490
198. doi:10.1016/j.dsr2.2014.02.003. 491
Madigan, D.J., Litvin, S.Y., Popp, B.N., Carlisle, A.B., Farwell, C.J., and Block, B.A. 2012. Tissue 492
turnover rates and isotopic trophic discrimination factors in the endothermic teleost, Pacific 493
bluefin tuna (Thunnus orientalis). PLoS ONE 7(11): e49220. 494
doi:10.1371/journal.pone.0049220. 495
Ménard, F., Benivary, H.D., Bodin, N., Coffineau, N., Le Loc’h, F., Mison, T., Richard, P., and Potier, 496
M. 2014. Stable isotope patterns in micronekton from the Mozambique Channel. Deep Sea 497
Res. Part II Top. Stud. Oceanogr. 100: 153–163. doi:10.1016/j.dsr2.2013.10.023. 498
Ménard, F., Labrune, C., Shin, Y.-J., Asine, A.-S., and Bard, F.-X. 2006. Opportunistic predation in 499
tuna: a size-based approach. Mar. Ecol. Prog. Ser. 323: 223–231. 500
Ménard, F., Lorrain, A., Potier, M., and Marsac, F. 2007. Isotopic evidence of distinct feeding 501
ecologies and movement patterns in two migratory predators (yellowfin tuna and swordfish) 502
of the western Indian Ocean. Mar. Biol. 153(2): 141–152. doi:10.1007/s00227-007-0789-7. 503
Ménard, F., and Marchal, E. 2003. Foraging behaviour of tuna feeding on small schooling 504
Vinciguerria nimbaria in the surface layer of the equatorial Atlantic Ocean. Aquat. Living 505
Resour. 16(03): 231–238. doi:10.1016/S0990-7440(03)00040-8. 506
Ménard, F., Stéquert, B., Rubin, A., Herrera, M., and Marchal, É. 2000. Food consumption of tuna in 507
the Equatorial Atlantic ocean: FAD-associated versus unassociated schools. Aquat. Living 508
Resour. 13(4): 233–240. 509
Mourente, G., Megina, C., and Díaz-Salvago, E. 2001. Lipids in female northern bluefin tuna 510
(Thunnus thynnus thynnus L.) during sexual maturation. Fish Physiol. Biochem. 24(4): 351– 511
363. doi:10.1023/A:1015011609017. 512
Olson, R.J., Duffy, L.M., Kuhnert, P.M., Galván-Magaña, F., Bocanegra-Castillo, N., and Alatorre-513
Ramírez, V. 2014. Decadal diet shift in yellowfin tuna Thunnus albacares suggests broad-514
scale food web changes in the eastern tropical Pacific Ocean. Mar. Ecol. Prog. Ser. 497: 157– 515
178. 516
Olson, R.J., Young, J.W., Ménard, F., Potier, M., Allain, V., Goñi, N., Logan, J.M., and Galván-517
Magaña, F. 2016. Bioenergetics, Trophic Ecology, and Niche Separation of Tunas. In 518
Advances in Marine Biology. Edited by B.E. Curry. Academic Press. pp. 199–344. Available 519
from http://www.sciencedirect.com/science/article/pii/S0065288116300049 [accessed 30 520
September 2016]. 521
Parrish, C.C., Pethybridge, H., Young, J.W., and Nichols, P.D. 2015. Spatial variation in fatty acid 522
trophic markers in albacore tuna from the southwestern Pacific Ocean—A potential 523
‘tropicalization’ signal. Deep Sea Res. Part II Top. Stud. Oceanogr. 113: 199–207. 524
doi:10.1016/j.dsr2.2013.12.003. 525
Pfennig, K.S., and Pfennig, D.W. 2009. Character Displacement: Ecological and Reproductive 526
Responses to a Common Evolutionary Problem. Q. Rev. Biol. 84(3): 253–276. 527
doi:10.1086/605079. 528
Pinnegar, J.K., and Polunin, N.V.C. 1999. Differential fractionation of δ13C and δ15N among fish 529
tissues: implications for the study of trophic interactions. Funct. Ecol. 13(2): 225–231. 530
Post, D.M., Layman, C.A., Arrington, D.A., Takimoto, G., Quattrochi, J., and Montaña, C.G. 2007. 531
Getting to the fat of the matter: models, methods and assumptions for dealing with lipids in 532
stable isotope analyses. Oecologia 152(1): 179–189. doi:10.1007/s00442-006-0630-x. 533
Robin, J.., Regost, C., Arzel, J., and Kaushik, S.. 2003. Fatty acid profile of fish following a change in 534
dietary fatty acid source: model of fatty acid composition with a dilution hypothesis. 535
Aquaculture 225(1–4): 283–293. doi:10.1016/S0044-8486(03)00296-5. 536
Saito, H., and Murata, M. 1998. Origin of the monoene fats in the lipid of midwater fishes: 537
relationship between the lipids of myctophids and those of their prey. Mar. Ecol. Prog. Ser. 538
168: 21–33.
539
Sardenne, F., Bodin, N., Chassot, E., Amiel, A., Fouché, E., Degroote, M., Hollanda, S., Pethybridge, 540
H., Lebreton, B., Guillou, G., and Ménard, F. 2016. Trophic niches of sympatric tropical tuna 541
in the Western Indian Ocean inferred by stable isotopes and neutral fatty acids. Prog. 542
Oceanogr. 146: 75–88. doi:10.1016/j.pocean.2016.06.001. 543
Sardenne, F., Kraffe, E., Amiel, A., Fouché, E., Debrauwer, L., Ménard, F., and Bodin, N. 2017. 544
Biological and environmental influence on tissue fatty acid compositions in wild tropical 545
tunas. Comp. Biochem. Physiol. A. Mol. Integr. Physiol. 204: 17–27. 546
doi:10.1016/j.cbpa.2016.11.007. 547
Sardenne, F., Ménard, F., Degroote, M., Fouché, E., Guillou, G., Lebreton, B., Hollanda, S.J., and 548
Bodin, N. 2015. Methods of lipid-normalization for multi-tissue stable isotope analyses in 549
tropical tuna. Rapid Commun. Mass Spectrom. 29(13): 1253–1267. doi:10.1002/rcm.7215. 550
Schaefer, K.M., Fuller, D.W., and Block, B.A. 2009. Vertical Movements and Habitat Utilization of 551
Skipjack (Katsuwonus pelamis), Yellowfin (Thunnus albacares), and Bigeye (Thunnus 552
obesus) Tunas in the Equatorial Eastern Pacific Ocean, Ascertained Through Archival Tag 553
Data. In Tagging and Tracking of Marine Animals with Electronic Devices. Springer, 554
Dordrecht. pp. 121–144. doi:10.1007/978-1-4020-9640-2_8. 555
Schaefer, K.M., Fuller, D.W., and Block, B.A. 2011. Movements, behavior, and habitat utilization of 556
yellowfin tuna (Thunnus albacares) in the Pacific Ocean off Baja California, Mexico, 557
determined from archival tag data analyses, including unscented Kalman filtering. Fish. Res. 558
112(1–2): 22–37. doi:10.1016/j.fishres.2011.08.006.
559
Teffer, A.K., Staudinger, M.D., and Juanes, F. 2015. Trophic niche overlap among dolphinfish and co-560
occurring tunas near the northern edge of their range in the western North Atlantic. Mar. Biol. 561
162(9): 1823–1840. doi:10.1007/s00227-015-2715-8.
562
Teuber, L., Schukat, A., Hagen, W., and Auel, H. 2014. Trophic interactions and life strategies of epi- 563
to bathypelagic calanoid copepods in the tropical Atlantic Ocean. J. Plankton Res. 36(4): 564
1109–1123. doi:10.1093/plankt/fbu030. 565
Tocher, D.R. 2003. Metabolism and functions of lipids and fatty acids in teleost fish. Rev. Fish. Sci. 566
11(2): 107–184. doi:10.1080/713610925.
567
Ukwe, C.N., Ibe, C.A., and Sherman, K. 2006. A sixteen-country mobilization for sustainable fisheries 568
in the Guinea Current Large Marine Ecosystem. Ocean Coast. Manag. 49(7): 385–412. 569
doi:10.1016/j.ocecoaman.2006.04.006. 570
Vander Zanden, M.J., Cabana, G., and Rasmussen, J.B. 1997. Comparing trophic position of 571
freshwater fish calculated using stable nitrogen isotope ratios (δ15N) and literature dietary 572
data. Can. J. Fish. Aquat. Sci. 54(5): 1142–1158. doi:10.1139/f97-016. 573
Vaske, T., Vooren, C.M., and Lessa, R.P. 2003. Feeding strategy of yellowfin tuna (Thunnus 574
albacares), and wahoo (Acanthocybium solandri) in the Saint Peter and Saint Paul 575
Archipelago, Brazil. Bol. Inst. Pesca São Paulo 29: 173–181. 576
Weng, K.C., Stokesbury, M.J.W., Boustany, A.M., Seitz, A.C., Teo, S.L.H., Miller, S.K., and Block, 577
B.A. 2009. Habitat and behaviour of yellowfin tuna Thunnus albacares in the Gulf of Mexico 578
determined using pop up satellite archival tags. J. Fish Biol. 74(7): 1434–1449. 579
Wiafe, G., Dovlo, E., and Agyekum, K. 2016. Comparative productivity and biomass yields of the 580
Guinea Current LME. Environ. Dev. 17: 93–104. doi:10.1016/j.envdev.2015.07.001. 581
Young, J.W., Guest, M.A., Lansdell, M., Phleger, C.F., and Nichols, P.D. 2010a. Discrimination of 582
prey species of juvenile swordfish Xiphias gladius (Linnaeus, 1758) using signature fatty acid 583
analyses. Prog. Oceanogr. 86(1–2): 139–151. doi:10.1016/j.pocean.2010.04.028. 584
Young, J.W., Lansdell, M.J., Campbell, R.A., Cooper, S.P., Juanes, F., and Guest, M.A. 2010b. 585
Feeding ecology and niche segregation in oceanic top predators off eastern Australia. Mar. 586
Biol. 157(11): 2347–2368. doi:10.1007/s00227-010-1500-y. 587
Zudaire, I., Murua, H., Grande, M., Goñi, N., Potier, M., Ménard, F., Chassot, E., and Bodin, N. 2015. 588
Variations in the diet and stable isotope ratios during the ovarian development of female 589
yellowfin tuna (Thunnus albacares) in the Western Indian Ocean. Mar. Biol.: 1–15. 590
doi:10.1007/s00227-015-2763-0. 591
Zudaire, I., Murua, H., Grande, M., Pernet, F., and Bodin, N. 2014. Accumulation and mobilization of 592
lipids in relation to reproduction of yellowfin tuna (Thunnus albacares) in the Western Indian 593
Ocean. Fish. Res. 160: 50–59. doi:10.1016/j.fishres.2013.12.010. 594
595
Fig. 1. Location of bigeye (BET; n=45) and yellowfin tuna (YFT; n=50) caught by purse-seiners in the Gulf of Guinea between July 2013 and September 2014. Major seasonal upwelling (grey area) develops in boreal summer (July–September).
Fig. 2. Length influence on (a) nitrogen stable isotopic values (δ15N), (b) carbon stable isotopic values (δ13C) and (c) total lipid content (TLC) in muscle tissue of bigeye (BET) and yellowfin tuna (YFT) collected from the Gulf of Guinea. Linear regressions with confidence intervals are plotted when the relationship is significant.
Fig. 3. Length influence on proportions of common fatty acids trophic markers in pelagic environment: (a) 20:5n-3, (b) 20:4n-6, (c) 18:1n-9 and (d) 22:6n-3, in the liver tissue of bigeye (BET) and yellowfin tuna (YFT) collected from the Gulf of Guinea. Simple linear regressions with confidence intervals are plotted when length influence is detected. The black regression in (b) is adjusted on both BET and YFT data (similar length influence for BET & YFT).
Fig. 4. Longitude influence on the three most affected fatty acids according to PCA: (a) 20:5n-3, (b) 20:4n-3 and (c) 20:4n-6, in liver tissue of bigeye (BET) and yellowfin tuna (YFT) collected from the Gulf of Guinea. Linear regressions with confidence interval are adjusted on both BET and YFT data (no species difference) (a & b) and for BET only (c). The intensity of the grey in background indicates the seasonal upwelling influence.
Fig. 5. Feeding niches of bigeye (BET; n=45) and yellowfin tuna (YFT; n=50) from the Gulf of Guinea using SIBER on (a) δ13C and δ15N values of muscle, and on (b) Principal component analyze (PCA) dimensions of fatty acids (FA) profiles of liver. FA most influential in PCA (cos²>0.35) are superimposed. Ellipses areas contain 95% of the data; Boxes represent the credible intervals (95, 75 and 50%) for the Bayesian standard ellipses areas and their overlaps (in green).
Table 1. Characteristics of fish, stable isotopes (δ13C and δ15N values in ‰) and total lipid content (TLC in % dry weigh) of muscle and fatty acid (FA) distribution (in % of total FA) of liver for bigeye (BET) and yellowfin tuna (YFT) from the Gulf of Guinea. Data are mean ± SD. n denotes sample numbers analyzed. * denotes significant differences between BET and YFT (post-hoc t-tests for stable isotopes and TLC and Wilcoxon tests for fatty acids; p < 0.05). SFA: Saturated FA; MUFA: Mono-unsaturated FA; PUFA: Poly-unsaturated FA.
Size (cm FL) 111.3 ± 25.8 124.6 ± 22.6 Sex ratio (♀ : ♂) Muscle n δ13C (‰) -17.1 ± 0.2 -17.1 ± 0.3 δ15N (‰) 12.8 ± 0.6 11.7 ± 0.9 * TLC (% dw) 7.6 ± 9.3 4.5 ± 3.7 * Liver n 14:0 0.8 ± 0.2 0.7 ± 0.2 * 15:0 0.6 ± 0.2 0.6 ± 0.2 16:0 23.3 ± 4.1 25.0 ± 2.9 * 17:0 2.0 ± 0.4 1.5 ± 0.2 * 18:0 8.7 ± 1.2 11.0 ± 1.5 * Ʃ SFA 35.5 ± 4.7 38.9 ± 3.2 * 16:1n-7 2.4 ± 0.7 2.1 ± 0.7 * 17:1n-7 1.0 ± 0.3 1.2 ± 0.2 * 18:1n-9 14.1 ± 4.8 11.0 ± 5.9 * 18:1n-7 2.7 ± 0.8 2.3 ± 0.7 * 20:1n-9 1.4 ± 0.5 0.9 ± 0.4 * 20:1n-7 0.4 ± 0.8 0.1 ± 0.1 * 24:1n-9 0.8 ± 0.6 0.3 ± 0.1 * Ʃ MUFA 22.7 ± 6.3 17.9 ± 7.0 * 18:2n-6 0.9 ± 0.2 1.0 ± 0.2 * 20:4n-6 (ARA) 5.2 ± 1.7 4.3 ± 1.4 * 22:4n-6 0.4 ± 0.2 0.8 ± 0.4 * 22:5n-6 1.3 ± 0.4 1.4 ± 0.4 20:4n-3 0.4 ± 0.2 0.6 ± 0.2 * 20:5n-3 (EPA) 6.1 ± 1.6 6.2 ± 1.6 22:5n-3 1.7 ± 0.9 1.7 ± 0.7 22:6n-3 (DHA) 21.9 ± 3.5 23.3 ± 4.9 Ʃ n-6 7.8 ± 2.0 7.5 ± 1.7 Ʃ n-3 30.2 ± 3.9 31.8 ± 5.9 Ʃ PUFA 38.0 ± 4.8 39.3 ± 7.2 45 50 45 47 BET YFT 1 : 1.05 1 : 1.63
Table 2. Summary of factors influencing the ecological tracers of bigeye (BET) and yellowfin tuna (YFT) from the Gulf of Guinea according to ANOVA (after an AIC-based selection, _ denotes the unselected factors) for stable isotopes values (δ13C and δ15N) and total lipid content (TLC), and PERMANOVA (based on Bray-Curtis distance matrix and 1000 permutations) for fatty acids profile. P-values in bold denote factors with significant influence on the ecological tracers.
df F p-value df F p-value df F p-value df Pseudo-F r² p-value Fishing longitude 1 3.6 0.060 1 0.6 0.422 _ _ _ 1 3.7 0.03 0.027 Fishing date _ _ _ _ _ _ _ _ _ 1 0.3 0.00 0.757 Species 1 3.3 0.071 1 55.1 0.000 1 5.6 0.020 1 10.5 0.10 0.001 Size 1 0.4 0.511 1 8.8 0.004 1 14.4 0.000 1 5.0 0.05 0.013 Sex _ _ _ _ _ _ 1 7.7 0.007 1 0.5 0.00 0.653 Species*Size 1 3.8 0.054 _ _ _ 1 5.7 0.019 1 0.6 0.01 0.535
Factors δ TLC FATTY ACIDS
15
N δ13C