RESEARCH ARTICLE
Cellular and Molecular Properties of Neurons
Robust and tunable bursting requires slow positive feedback
XAlessio Franci,1* Guillaume Drion,2* and Rodolphe Sepulchre31Department of Mathematics, Universidad Nacional Autónoma de México, Mexico City, Mexico;2Institut Montefiore,
Université de Liege, Liege, Belgium; and3Department of Engineering, University of Cambridge, Cambridge, United Kingdom
Submitted 7 November 2017; accepted in final form 11 December 2017
Franci A, Drion G, Sepulchre R. Robust and tunable bursting requires slow positive feedback. J Neurophysiol 119: 1222–1234, 2018. First published December 13, 2017; doi:10.1152/jn.00804. 2017.—We highlight that the robustness and tunability of a bursting model critically rely on currents that provide slow positive feedback to the membrane potential. Such currents have the ability to make the total conductance of the circuit negative in a timescale that is termed “slow” because it is intermediate between the fast timescale of the spike upstroke and the ultraslow timescale of even slower adaptation currents. We discuss how such currents can be assessed either in voltage-clamp experiments or in computational models. We show that, while frequent in the literature, mathematical and computational models of bursting that lack the slow negative conductance are fragile and rigid. Our results suggest that modeling the slow negative con-ductance of cellular models is important when studying the neuro-modulation of rhythmic circuits at any broader scale.
NEW & NOTEWORTHY Nervous system functions rely on the modulation of neuronal activity between different rhythmic patterns. The mechanisms of this modulation are still poorly understood. Using computational modeling, we show the critical role of currents that provide slow negative conductance, distinct from the fast negative conductance necessary for spike generation. The significance of the slow negative conductance for neuromodulation is often overlooked, leading to computational models that are rigid and fragile.
bursting; feedback; modeling; neuromodulation
INTRODUCTION
While the function of neuronal bursting is still debated and probably diverse, the continuous modulation between distinct firing patterns is an important signaling component of many nervous functions. These include muscle contraction orches-trated by central pattern generators (Marder 2012), control of sleep, wakefulness, and attention in thalamocortical circuits (Bezdudnaya et al. 2006; McCormick and Bal 1997; Sherman 2001), and sensing (Krahe and Gabbiani 2004). Voltage re-cordings in these references suggest robust and continuous modulations between spiking and bursting. All transitions share a sharp separation between the low frequency of spikes in tonic firing and the high frequency of spikes during bursts. They are observed across a broad range of neuronal and bursting types.
The mechanisms of this regulation are still poorly under-stood. At the physiological level, they seem to involve a variety of ionic currents and neuromodulators; see, e.g., the review by Marder and Bucher (2007). At the modeling level, most text-books on computational and mathematical neuroscience in-clude a chapter on bursting (Izhikevich 2007, Chapter 9; Ermentrout and Terman 2010, Chapter 5), but the mathemati-cal theory of bursting is based on a classification of different types of bursting according to different bifurcation mecha-nisms. Each bursting type is associated with a different bifur-cation mechanism, with little importance given to the transi-tions between bursting types and, most importantly, to the connection between mathematical transitions and physiologi-cal modulation. To the best of our knowledge, a mathematiphysiologi-cal theory of bursting modulation and how it relates to physiolog-ical mechanisms had not been addressed until the recent paper by Franci et al. (2014).
In this study we use a state-of-the-art conductance-based model, widely used in computational neuromodulation studies, to highlight a modeling feature of bursting that is critical to robustness and modulation. Specifically, mimicking the clas-sical voltage-clamp experiment, we study the conductance of the neuron by analyzing the total current response to a voltage step perturbation around the threshold potential. We aim to show that, irrespective of the modeling details, the robustness and modulation properties of the model primarily rely on the ability to modulate the slow temporal component of the con-ductance from positive (in spiking mode) to negative (in bursting mode). This modulation only occurs transiently, in a timescale that is slow compared with the fast timescale of the spike upstroke. The voltage-clamp signature of this slow con-ductance makes it model independent and easy to assess experimentally.
The presence of a slow negative conductance in a circuit, distinct from its fast negative conductance, is easily overlooked because of its transient nature. We highlight the transient nature of this property with a computational experiment that only changes the kinetics of calcium channel activation from slow to fast, without affecting the balance of currents at steady state. We show that all the modulation properties of the bursting model are lost when the calcium activation is fast, just because the slow negative conductance is no longer distinct from the fast negative conductance.
A model can exhibit a slow negative conductance only if it includes an inward current with slow activation or an outward current with slow inactivation. Such currents were named
* A. Franci and G. Drion contributed equally to this work.
Address for reprint requests and other correspondence: A. Franci, Dept. of Mathematics, Universidad Nacional Autónoma de México, Mexico City, Mexico (e-mail: [email protected]).
First published December 13, 2017; doi:10.1152/jn.00804.2017.
“slow regenerative” in Franci et al. (2013). By definition, a model that does not include slow regenerative currents cannot exhibit a slow negative conductance in any voltage range. We show that such models abound in the literature of bursting. This is because the slow negative conductance, while essential to robust modulation, is not necessary to bursting per se. However, we illustrate in a number of published models that bursting models that lack a source of slow negative conduc-tance are both fragile and rigid: they are very sensitive to small parameter variations, and those parameter variations disrupt the bursting pattern altogether rather than modulating the shape of the bursting pattern. In sharp contrast, published models that include a slow negative conductance are robust and tunable: small parameter variations do not disrupt the bursting pattern, and specific parameter variations modulate the bursting shape between different bursting types.
The total conductance of a neuronal circuit is modulated in a given timescale by a balance between currents of negative and positive conductance or, equivalently, by a balance between currents providing positive and negative feedback to the mem-brane potential. Our results suggest that modulation of the sign of the slow conductance of a model is necessary for the regulation of bursting, meaning that slow regenerative channels are a natural target for neuromodulators involved in bursting modulation, in line with a number of experimental studies (Marder and Bucher 2007).
We also provide an analysis of our results in terms of phase portraits and bifurcation theory, the classical language of bursting theory. Phase portraits of regenerative and restorative models are indeed fundamentally different (Drion et al. 2012; Franci et al. 2012). We show that only in the presence of a slow negative conductance is the same phase portrait both robust to parameter variations and compatible with various bursting types that have traditionally been associated with distinct models. This comparison suggests the relevance of analyzing bursting as circuits regulated by a balance of positive and negative feedbacks in distinct timescales as a complement to the traditional classification based on bifurcation theory.
While the analysis in this study is performed at the single-cell level, there is growing evidence, see, e.g., the recent paper by Dethier et al. (2015), that slow positive feedback at the cellular level critically impacts the robustness and tunability of rhythmic circuits as well. This suggests that accounting for the modeling feature highlighted in this report is relevant for neuromodulation studies at every scale and therefore a feature that merits attention from both experimentalists and modelers. METHODS
All simulations and analyses were performed with the Julia pro-gramming language. The Julia code is available as Supplemental Data at the Journal website and can be downloaded at https://github.com/ elsesma/eNeuro2017-Code.
Figure 1A was generated with the STG model described in Gold-man et al. (2001). Briefly, the model is composed of a leak current
Ileak, a transient sodium current INa, a T-type calcium current ICa,T, an S-type calcium current ICa,S, a delayed-rectifier potassium current
IK,DR, a transient potassium current IA, and a calcium-activated potassium current IK,Ca. Parameters used in the simulations are as follows: point a: C ⫽ 1 F/cm2, V Na ⫽ 50 mV, VK⫽ ⫺80 mV, VCa⫽ 80 mV, Vleak ⫽ ⫺50 mV, gleak ⫽ 0.1 mS/cm2, gNa⫽ 700 mS/cm2, g Ca,T⫽ 6 mS/cm2, gCa,S⫽ 9 mS/cm2, gA⫽ 30 mS/cm2, gK,DR⫽ 80 mS/cm2, g K,Ca⫽ 25 mS/cm
2; point b: the same param-eters as in point a except gCa,T⫽ 1 mS/cm2, gCa,S⫽ 1.5 mS/cm2, and
gA⫽ 240 mS/cm2; point c: same parameters as in point a except
gCa,T⫽ 3 mS/cm2, g
Ca,S⫽ 4.5 mS/cm 2, and g
A⫽ 26 mS/cm 2; point
d: same parameters as in point a except gCa,T⫽ 7 mS/cm2, gCa,S⫽ 10.5 mS/cm2, and g
A ⫽ 225 mS/cm2. Burstiness is defined as spikes per burst⫻ intraburst frequency
bursting period . Voltage steps in the voltage-clamp experiments are from – 40 mV to –39 mV.
Figure 1B was generated with the same model and parameters as Fig. 1A except that mCa,Tand mCa,Sare scaled by 0.5 in the center parameter chart and mCa,T ⫽ mCa,T⬁共V兲, mCa,T ⫽ mCa,T⬁共V兲 (instanta-neous calcium activation) in the right parameter chart. Voltage-clamp steps are from –39 mV to – 40 mV.
Nominal models in Fig. 2 are given as follows. The STG model is the same as Fig. 1A with maximal conductance parameters gleak⫽ 0.1 mS/cm2, gNa ⫽ 1,200 mS/cm2, gCa,T ⫽ 6.5 mS/cm2, gCa,S ⫽ 9.75 mS/cm2, g
A ⫽ 100 mS/cm2, gK,DR ⫽ 80 mS/cm2, and gKCa ⫽ 40 mS/cm2. The Plant R15 model and parameters are the same as given in Rinzel and Lee (1987). The pancreatic beta cell (pC) model and parameters are the same as described in Chay and Keizer (1983). The thalamocortical (TC) model and parameters are the same as given in Wang (1994). The CA1 model and parameters are the same as given in Golomb et al. (2006). The modified CA1⫹ model was obtained from the nominal model by the following: the persistent sodium current activation is made dynamic with time constant equal to 6 times the original delayed-rectifier activation time constant; the original delayed-rectifier activation time constant is scaled by 4; and the cell capacitance is scaled by 0.4.
Figure 3A was generated with the same STG model as Fig. 1A. Parameters used in the simulations are as in Fig. 1A except for the following: Fig. 3A, left: gNa ⫽ 1,200 mS/cm2, g
Ca,T⫽ 1 mS/cm2,
gCa,S ⫽ 4 mS/cm2, gA ⫽ 10 mS/cm2, gK,DR ⫽ 40 mS/cm2, and
gKCa⫽ 8 mS/cm2; Fig. 3A, center: gNa⫽ 1,200 mS/cm2, gCa,T⫽ 1 mS/cm2, g
Ca,S⫽ 7 mS/cm2, gA⫽ 8 mS/cm2, gK,DR⫽ 40 mS/cm2, and gKCa⫽ 13 mS/cm2; Fig. 3A, right: gNa⫽ 1,200 mS/cm2, gCa,T⫽ 10 mS/cm2, gCa,S ⫽ 8 mS/cm2, g
A ⫽ 10 mS/cm2, gK,DR ⫽ 120 mS/cm2, and gKCa⫽ 40 mS/cm2.
Figure 3B was generated with the same STG model as Fig. 1A. Parameters used in the simulations are as in Fig. 1A except for the following: parabolic case: gNa⫽ 1,200 mS/cm2, gCa,T⫽ 1 mS/cm2,
gCa,S⫽ 32 mS/cm2, gA⫽ 40 mS/cm2, gK,DR⫽ 150 mS/cm2, and
gKCa ⫽ 200 mS/cm2; square-wave case: gNa ⫽ 1,200 mS/cm2,
gCa,T⫽ 10 mS/cm2, gCa,S⫽ 8 mS/cm2, gA⫽ 10 mS/cm2, gK,DR⫽ 120 mS/cm2, and gKCa ⫽ 5 mS/cm2; tapered case: gNa ⫽ 1,200 mS/cm2, gCa,T⫽ 1 mS/cm2, g
Ca,S⫽ 40 mS/cm2, gA⫽ 40 mS/cm2,
gK,DR⫽ 200 mS/cm2, and gKCa⫽ 200 mS/cm2.
Figure 5, A and B, were generated with the same STG model as Fig. 1A. The bifurcation diagrams were computed by setting the calcium-activated potassium channel activation variable as the bifurcation parameter and all other ultraslow variables at constant values (hCa,T⫽
hCa,S ⫽ 0.15, hA ⫽ 0.05). Bifurcation diagrams of Fig. 5A were computed with the original STG model in spiking and bursting modes. Bifurcation diagrams of Fig. 5B were computed with the STG model in bursting mode for different values of the calcium channel activation time constant. Figure 5C was computed by simulating the STG model (Fig. 5C, left) and the CA1 model (Fig. 5C, right) in bursting mode configuration for different values of the membrane capacitance (Cm⫽ 1F/cm2corresponds to the original value in both cases). Figure 5D was computed by simulating the CA1 mode in bursting mode config-uration and after changes in various model parameters as indicated in the figure. The bifurcation diagrams were computed for the original model and after an increase (Fig. 5D, top right) or a decrease (Fig. 5D,
bottom right) in membrane capacitance.
Figure 6A, top, was generated with the STG model described in Liu et al. (1998). Briefly, the model is composed of a leak current Ileak, a
transient sodium current INa, a T-type calcium current ICa,T, a S-type calcium current ICa,S, a delayed-rectifier potassium current IK,DR, a transient potassium current IA, a calcium-activated potassium current
IK,Ca, and a hyperpolarization-activated cyclic nucleotide-gated cur-rent IH. Parameters used in the simulations are as follows: tonic firing: C⫽ 1F/cm2, V
Na⫽ 50 mV, VK⫽ ⫺80 mV, VCa⫽ 80 mV, Vleak⫽ ⫺50 mV, gleak⫽ 0.01 mS/cm2, gNa⫽ 800 mS/cm2,
gCa,T⫽ 1 mS/cm2, gCa,S⫽ 1 mS/cm2, gA⫽ 50 mS/cm2, gK,DR⫽ 90 mS/cm2, g
KCa⫽ 60 mS/cm2, and gH⫽ 0.1 mS/cm2; bursting: same parameters as tonic firing except gCa,T ⫽ 4 mS/cm2 and
gCa,S⫽ 8 mS/cm2. Voltage steps in the voltage-clamp experiments are from – 44 mV to – 42 mV.
Figure 6A, bottom, was generated with the same STG model as Fig. 1A. Parameters used in the simulations are as in Fig. 1A except for
gNa⫽ 800 mS/cm2, gCa,T⫽ 10 mS/cm2, gCa,S⫽ 8 mS/cm2, gA⫽ 10 mS/cm2, gK,DR⫽ 120 mS/cm2, gK,Ca⫽ 50 mS/cm2(tonic mode) or
gNa⫽ 800 mS/cm2, g Ca,T⫽ 1 mS/cm 2, g Ca,S⫽ 1 mS/cm 2, g A⫽ 10 mS/cm2, gK,DR ⫽ 120 mS/cm2, and g K,Ca⫽ 50 mS/cm 2 (bursting mode). Voltage steps in the voltage-clamp experiments are from – 44 mV to – 42 mV.
Figure 6B was generated with the Plant R15 Aplysia model as described in Rinzel and Lee (1987). Briefly, the model is composed of a leak current Ileak, a transient sodium current INa, a persistent calcium current ICa, a delayed-rectifier potassium current IK,DR, and a calcium-activated potassium current IK,Ca. Parameters used in the simulation are as follows: C ⫽ 0.8F/cm2, V
Na ⫽ 30 mV, VK⫽ ⫺75 mV,
VCa⫽ 140 mV, Vleak⫽ ⫺40 mV, gleak ⫽ 0.003 mS/cm2, gNa⫽ 4 mS/cm2, g
K,DR⫽ 4 mS/cm2, gCa⫽ 0.006 mS/cm2, and gKCa⫽ 0.04 mS/cm2. Voltage steps in the voltage-clamp experiments are from ⫺80 mV to ⫺40 mV. Figure 6B, top, was generated with the same model and parameters as Fig. 6B, bottom, except that the calcium current activation is 100 times faster.
A
gCa (mS/cm2) gA (mS/cm 2) 0 10 0 300Fast Slow Fast Slow
c b
d
a Vm
Im Im
Voltage-clamp slow signature
Vm
B
gA (mS/cm 2) 10 0 0 300 10 0 0 300 10 0 0 300 gA (mS/cm 2) gA (mS/cm 2) Spiking BurstinessSlow calcium activation Faster calcium activation Instantaneous calcium activation
Vm gCa (mS/cm2) a b a b a b Im Vm gCa (mS/cm2) Im Vm gCa (mS/cm2) Im 25 ms 25 ms 25 ms 25 ms 0.5 μA/cm2 1 μA/cm2 1 μA/cm2 1 μA/cm2 a b a b a b a b 25 ms
Fig. 1. A: the slow transient in a voltage-clamp experiment near threshold is a reliable signature to discriminate between bursting and tonic firing. Left: parameter chart of burstiness as a function of the parameters gAand gCain the STG model (Goldman et al. 2001). Burstiness was computed as described inMETHODS. Right:
voltage-clamp experiment close to threshold potential in tonic mode (a) and bursting mode (b). Voltage steps are from – 40 mV to –39 mV. The slow transient of the current response to a voltage step is increasing in spiking mode (a signature of slow positive conductance) and decreasing in bursting mode (a signature of slow negative conductance). The signature is modulated along a modulation path (a– b) and conserved along a degeneracy path (c– d, not shown) in the parameter space of maximal conductances. B: effects of decreasing calcium current activation time constant on the parameter chart and the voltage-clamp experiment in A. The decreasing phase of the slow transient vanishes as calcium activation kinetics, the only source of slow negative conductance in the model, varies from slow to fast. In the parameter charts, reduction of the calcium activation time constants shrinks the parameter region where the model can be modulated. In the limit of instantaneous activation, the model has lost its modulation properties and in particular the transition from tonic firing to bursting.
RESULTS
A transient signature of robust and tunable bursting. Figure
1A uses the computational model of Goldman et al. (2001) to illustrate a classical physiological transition from tonic firing to bursting. The model includes seven voltage- and time-depen-dent conductances as well as a leak conductance (seeMETHODS).
The modulation from tonic firing to bursting is obtained by varying the balance of calcium and A-type potassium voltage-gated currents. This modulation defines modulatory paths in the parameter space of the two maximal conductances gCaand
gA(path a– b in Fig. 1A). The same plane contains degeneracy
paths where modulation of the maximal conductances results in almost no change in the resulting neuronal activity (path c– d in Fig. 1A). The coexistence of degeneracy and modulatory paths has been shown to be critical for robust neuromodulation (Marder et al. 2014). A computational model that reproduces such features does not only exhibit a bursting trace for a well-chosen set of conductance parameters. In addition, the bursting rhythm is robust and tunable in the parameter space of maximal conductances.
Figure 1B highlights that this tunability property is com-pletely lost by changing a single parameter in the model, namely, the time constant of activation of the calcium chan-nels. Before interpreting this result, we stress that the modeling difference between Fig. 1A and Fig. 1B is purely dynamical in nature: it does not affect the static behavior of the model, that is, the model equations at equilibrium. This means in particular
an identical balance of ionic currents at equilibrium and an identical current-voltage (I-V) curve.
To unfold the transient mechanism responsible for the struc-tural change between Fig. 1A and Fig. 1B, we mimic the classical voltage-clamp experiment of electrophysiology: we clamp the voltage at a constant value close to threshold potential (Vth ~ ⫺40 mV in this model) and apply a small
voltage step perturbation⌬Vmat time t⫽ 0. The current step
response⌬Im(t) provides us with the temporal evolution of the
local conductance⌬Im(t)/⌬Vmof the model around the
thresh-old potential. This total conductance is the aggregate conduc-tance resulting from all the ionic current variations at a given time and around a given voltage.
In Fig. 1A, we see that the transient behavior of the local conductance is markedly different in the spiking configuration (a) and in the bursting configuration (b). In the spiking con-figuration, the current step response carries the usual signature of an excitable circuit: an initial phase characterized by a fast inverse response, followed by a slow monotone convergence to equilibrium. In the bursting configuration, the current response exhibits an additional slow inverse response, distinct from the initial fast inverse response. If we decompose the current response into fast, slow, and ultraslow transient phases, it is the slow transient that discriminates bursting from spiking.
In Fig. 1B, the distinct slow transient signature of bursting is progressively lost as the time constant of calcium activation is decreased. This is because the two distinct inverse responses progressively merge. In the limiting case of an instantaneous
STG R15 PβC TC CA1 CA1+
Control
1.2 x g
0.8 x g
Variability in mean spike height
STG R15 PβC TC CA1 CA1+
Variability in burst period
0.5 1.6
1
STG R15 PβC TC CA1 CA1+
Variability in spikes per burst
STG R15 PβC TC CA1 CA1+ -1.0 0.4 0 -1.5 1.6 0
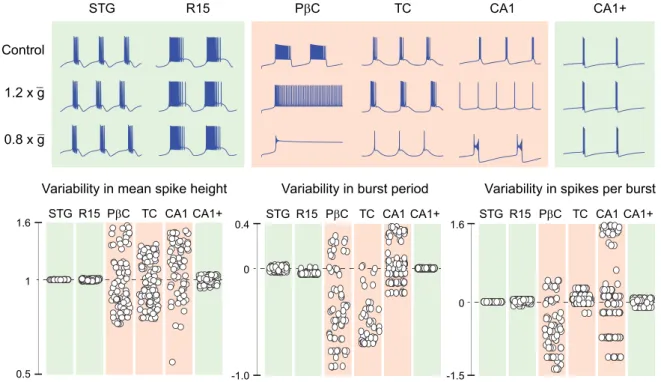
Fig. 2. Bursting models that lack currents providing slow negative conductance are fragile: tiny parameter variations disrupt the nominal rhythm. Green models (STG and R15) do include slow regenerative channels providing slow negative conductance. Red models (pC, TC, and CA1) lack slow negative conductance.
Top: only the bursting traces of green models are robust to a uniform scale of the maximal conductance vector (g ¡ 0.8g or g ¡ 1.2g). The red model CA1
is turned into the robust green model CA1⫹ by making the calcium activation slow. SeeMETHODSfor details. Bottom: random uniform scaling of the vector of maximal conductances induce large variability in the rhythm properties only in models lacking slow negative conductance. The scatterplots were obtained by scaling the maximal conductance vector g by a uniformly distributed random number in the range [0.8, 1.2]. Variability plots are absolute for the mean spike height (left) and logarithmic for the burst period (center) and number of spikes per burst (right): 共spike height兲
共spike height兲nominal
, log
冋
共burst period兲 共burst period兲nominal册
, log
冋
共spikes per burst兲共spikes per burst兲nominal
册
calcium activation, they simply add up in the fast timescale. This phenomenon is easy to explain in the computational model used in Fig. 1: the first (fast) inverse response of the current results from the fast activation of sodium channels, whereas the second (slow) inverse response results from the slow activation of calcium channels. The two successive in-verse responses are distinct in the voltage-clamp experiment of Fig. 1A because the timescales of the calcium channel activa-tions are significantly slower than the timescale of the sodium channel activation (Hille 2001, p.127; Kostyuk et al. 1977). In contrast, the two successive inverse responses merge in Fig. 1B because the timescale of calcium channel activation merges with the timescale of sodium channel activation.
A robust and tunable bursting model must include a source of slow negative conductance. In the seminal work of Hodgkin
and Huxley, the voltage-clamp experiment described in the previous section was applied to the squid giant axon and served as a foundation to model the voltage dependence and the dynamics of ionic conductances. The early inverse current response was attributed to a fast negative conductance modeled by the fast activation of an inward (sodium) current. Likewise, the late monotone convergence was attributed to a slow posi-tive conductance modeled both by the slow inactivation of sodium channels and the slow activation of an outward (po-tassium) current.
We proceed in the same manner to explain the slow transient signature of a bursting neuron: it requires a voltage-gated current providing a slow negative conductance, distinct from the fast negative conductance. A negative conductance is provided by the activation of an inward current or the inacti-vation of an outward current. It is slow if the corresponding channel kinetics is distinctively slower than the fast activation of sodium channels and distinctively faster than adaptation
current kinetics. Typical slow conductance time constants are in the range 5–20 ms. Physiological contributors of such currents include the whole family of calcium currents with slow activation as well as resurgent sodium channels (Swensen and Bean 2003). They also include any outward current that inactivates slowly, such as some potassium channels (Storm 1990). Such channels were called slow regenerative in the paper by Franci et al. (2013).
Our computational experiment suggests that a robust and tunable bursting neuronal model must include a source of slow negative conductance. For a conductance-based model, this means that the gated ionic currents must include at least one type of slow regenerative channel. In the simulated STG model, only calcium currents contribute to the slow negative conductance. They do so because their activation is slow. The modulation path in Fig. 1A amplifies the slow negative con-ductance of the total current from a to b by modulating the balance between slow regenerative (calcium) channels and slow restorative (potassium) channels. In Fig. 1B, this mod-ulation property is lost because the calcium channels be-come fast regenerative. Modulation of the total conductance in the slow timescale from positive to negative is no longer possible because the model has lost its only source of slow regenerative channels.
In a conductance-based model, modulation of the total slow negative conductance is possible only in the presence of slow regenerative channels. The voltage-clamp experiment in the previous section is a general method to assess the negative slow conductance of a circuit, irrespective of the modeling details of the model. The reader is referred to the recent paper by Drion et al. (2015) for a method that quantitatively assesses the slow negative conductance (or any other conductance) of
A
200 ms
200 ms
B
IBF IBF IBF
Square-wave Parabolic Tapered
Spike hyperpolarization Burst hyperpolarization
50 mV
50 mV Fig. 3. Bursting models that include currents
providing slow negative conductance are tun-able. A: the bursting quality (intraburst fre-quency, plateau or nonplateau) can continu-ously be modulated via changes in ion chan-nel densities independently of the bursting rhythm (interburst frequency). B: the bursting shape can be continuously modulated via changes in ion channel densities while main-taining both intraburst frequency and inter-burst frequency (IBF). SeeMETHODSfor the parameter values used.
an arbitrary one-port circuit at a given voltage, either compu-tationally or experimentally.
Robust vs. fragile bursting. The absence of slow negative
conductance has a dramatic consequence for the robustness of the bursting model to parameter perturbations. Figure 2 illus-trates the striking contrast between the fragility of models that lack slow negative conductance and the robustness of models that include slow negative conductance. The chosen perturba-tion is a uniform scaling of all maximal conductance parame-ters, which is mathematically equivalent to a scaling of the membrane capacitance.
The STG (Goldman et al. 2001) and R15 (Rinzel and Lee 1987) models are two classical bursting models in the literature that are robust to the perturbation. Both include slow regenerative channels by modeling calcium channels that activate slowly. The pC (Chay and Keizer 1983), TC (Wang 1994), and CA1 (Golomb et al. 2006) models are three published models that are fragile to the perturbation. Small deviations from the nominal parameter set produce large variations in different properties of the rhythm. The three models lack any source of slow negative conductance. They all include calcium channels or other regener-ative channels but assume an instantaneous activation, making them fast regenerative instead of slow regenerative.
The CA1⫹ model is a modification of the published CA1 model. In the modified model, the activation of persistent sodium channels was modified from fast to slow, making the persistent sodium channels slow regenerative instead of fast regenerative (seeMETHODSfor details). This only modification
was sufficient to recover the robustness of models that have a slow negative conductance.
Tunable vs. rigid bursting. Bursting models that include a
slow negative conductance are not only robust but robustly tunable. This means that the shape of the bursting trace can be tightly controlled by modulating maximal conductance values (i.e., channel densities). Figure 3 illustrates those modulation properties with the same published STG model as in the previous sections. Figure 3A illustrates the modulation of bursting quality: the intraburst frequency and plateau properties are continuously modulated while other features of the burst are maintained unaf-fected, such as the interburst frequency or the mean voltage during resting and spiking phases. Figure 3B illustrates the modulation of the bursting shape while the mean intraburst and interburst fre-quencies are maintained. The continuous modulation recovers three distinct types of bursting usually referred to as “square wave,” “parabolic,” and “tapered.”
The modulation properties illustrated in Fig. 3 do not result from a systematic exploration of the parameter space, a task already formidable for the chosen STG model (Prinz et al. 2003). Instead, they only rely on modulating the ratio of the maximal values of the total slow negative conductance and of the total ultraslow positive conductance following the method-ology of dynamic input conductances (Drion et al. 2015). Shaping the dynamic conductances relative to each other is easy and intuitive because the tuning parameters are few and directly map to the bursting behavior. This qualitative tuning is then easily translated into physiologically plausible modula-tions. For instance, modulation of the slow negative conduc-tance relative to the ultraslow positive conducconduc-tance in Fig. 3 was achieved by modifying only the five following maximal conductances: gCa,T, gCa,S, gA, gKd, and gKCa. In each case, the
modulation is robust, that is, not sensitive to small parameter
variations in the large-dimensional space of the conductance-based model parameters.
The robust modulation illustrated in Fig. 3 is in sharp contrast with the rigidity of bursting models that lack a source of slow negative conductance. The nominal bursting trace of the pC, TC, and CA1 models in Fig. 2 is rigid because the relationship between intraburst and interburst frequencies as well as the relationship between the mean voltage of the resting and spiking modes are extremely constrained. The resulting burst is not only fragile; it is also rigid, making it difficult to modulate the burstiness or the bursting type as in Fig. 3. The geometric analysis in the next section provides additional insight into those limitations.
Connection with phase portrait and bifurcation analysis. We
now examine the critical role of the slow negative conductance for modulation and robustness in the light of geometric anal-ysis. We rely on the common simplification that a three-timescale bursting attractor can be analyzed via the bifurcation diagram of a two-timescale phase portrait. The variables of the phase portrait are the fast voltage and a slow variable aggre-gating all the slow variables. The bifurcation parameter is a representative ultraslow variable. Bursting is modeled as ul-traslow adaptation of the bifurcation parameter across a pa-rameter range where a stable fixed point (the resting state) and a stable limit cycle (the spiking state) coexist in the phase portraits.
The role of the slow negative conductance has been analyzed previously in fast-slow phase portraits (see Drion et al. 2012; Franci et al. 2012, 2013) and in mathematical three-timescale models of bursting (Franci et al. 2014). The results of this qualitative analysis are summarized in Fig. 4. The reduced phase portraits are called regenerative when they include a slow negative conductance and restorative otherwise. Figure 4A shows that the two types of phase portrait are qualitatively different. In restorative phase portraits, the V nullcline has the classical N shape of spiking neuronal models. In regenerative phase portraits, this shape is mirrored. The reader is referred to Drion et al. (2012) and Franci et al. (2012, 2013) for a detailed analysis of why the mirrored V nullcline requires a slow negative conductance. Both restorative and regenerative phase portraits exhibit bistability between a fixed point and a limit cycle, and both phase portraits rely on the same bifurcations: they are of the same saddle node (SN)/saddle homoclinic (SH) type according to the classification of Izhikevich (Izhikevich 2007, Fig. 9.24). However, the difference in their V nullclines strongly affects the robustness and the tunability of the bistable attractor. In the regenerative phase portrait, the stable manifold of the saddle point is a separatrix that sharply divides the phase portrait into two distinct regions, each of which corresponds to the basin of attraction of one of the two attractors: the stable fixed point and the stable limit cycle. The two stable attractors can be shaped independently from each other by deforming the nullclines away from the separatrix and modulating the ratio of the fast and slow timescales. Robust bistability is maintained across a broad range of variations (Fig. 4A, top right). In sharp contrast, the bistability of a restorative phase portrait requires both a specific intersection of the nullclines and a specific ratio between the fast and slow timescales. The bistability is fragile to any perturbation of this specific tuning (Fig. 4A, bottom
right). As a result, the bifurcation diagram associated with
Figure 4B illustrates how the geometry of the bistable phase portrait impacts not only the robustness but also the tunability of the bursting attractor. The resting and spiking attractors can be shaped independently in a regenerative phase portrait because deforming the V nullcline near the fixed point does not affect the limit cycle and vice versa. As a result, the values of the membrane potential at rest and in spiking mode can be tuned independently, leading to the generation of both nonplateau bursting and plateau (or
square wave) bursting depending on the maximal conduc-tance parameter set (Fig. 4B, left). This flexibility does not exist in restorative phase portraits. In particular, the resting state is always more hyperpolarized than the spiking state, forcing a bursting trace of the square-wave type (Fig. 4B,
right).
The qualitative analysis above is based on a low-dimen-sional mathematical model, but the conclusions persist in higher-dimensional computational models. Figure 5
illus-V wu SH SN V ws V ws V wu SH SN V ws V ws V faster/ws slower SN-SH V slower/ws faster SN-SH V ws V ws Control: SN-SH V faster/ws slower SNIC V slower/ws faster SN/SN Control: SN-SH
B
Tunable vs rigid V ws V ws V ws Non-plateau “square-wave” V ws square-wave onlyA
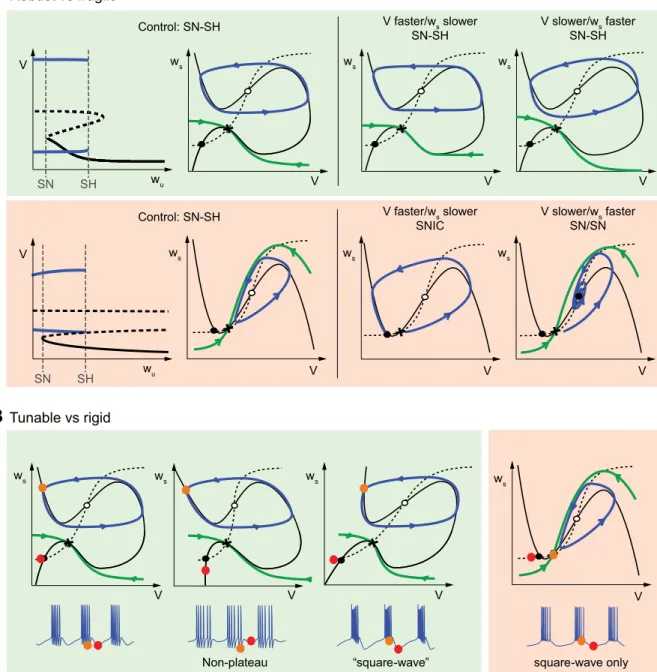
Robust vs fragileFig. 4. The phase portrait geometry of regenerative and restorative bursting. A: while sharing the same saddle node (SN) and saddle-homoclinic (SH) bifurcations, the phase portraits of rest-spike bistable models are radically affected by the slow negative conductance. Regenerative phase portraits (green) are robust to variations of the fast and slow timescales. Restorative phase portraits (red) are rest-spike bistable only for a well-chosen ratio of timescales. wsdenotes an aggregated slow variable.
Stable fixed points are marked as filled circles, unstable fixed points as open circles, and saddle points as crosses. Limit cycles and typical trajectories are sketched as blue oriented lines. The stable manifold of saddle points is sketched as a green oriented line. Bifurcation diagrams are the same as Fig. 5A, bottom (regenerative case) and Fig. 5D, left (restorative case). wudenotes an aggregated ultraslow variable. The mirrored N-shaped nullcline of the regenerative case ensures robustness with respect
to variations in the timescale separation between the membrane potential and the recovery variable. The N-shaped nullcline of the restorative case makes the phase portrait fragile to the ratio of fast and slow timescales. Small deviations from the nominal ratio destroy the rest-spike bistability, either via a saddle-node homoclinic bifurcation (cf. Izhikevich 2007, Fig. 6.44) or via Hopf bifurcation around the up equilibrium. B: regenerative phase portraits can be continuously deformed to match different types of bursters. Only the square-wave burster is compatible with restorative phase portraits.
SNIC SN SH 0.1 τCa 0.6 τCa 1 τCa 0.1 τCa 0.6 τCa 1 τCa mKCa 0 0.5 Vm Vm Vm Vm (mV) mKCa -90 50 0SN SH 1 Vm (mV) mKCa -90 50 0SNSH 1 Vm (mV) mKCa -90 50 0SNIC 1 Silent Spiking Bistable 1s 1s 1s
B
A
Vm (mV) mKCa -90 50 0 AH 1 1 τCa Vm (mV) mKCa -90 50 0SN SH 1 Increase gCa Decrease gAC
100 ms gNa -30% gNa +30% VK + 5mV VK - 5mV gNaP +30% gNaP -50% gK -30% gK +30% Vm (mV) z -90 50 0 0.5 Vm (mV) z -90 50 0 0.5 Vm (mV) z -90 50 0 0.5STG model CA1 model
Membrane capacitance (μF/cm2) Membrane capacitance (μF/cm2) 10-2 100 10-1 102 101 102 101 100 10-1 10-2
D
Slow oscillation One spike bursting Bursting Slow spiking
Fig. 5. Bifurcation analysis of bursting with and without slow negative conductance. A: membrane potential-ultraslow adaptation variable (mK,Ca) bifurcation
diagram and associated trajectories in tonic (top) and burst (bottom) modes in the STG model of Fig. 1. Other ultraslow variables of the model (hCa,T, hCa,S, and hA) are fixed at physiologically plausible constant values (seeMETHODS). B: deformations of the bursting traces (top) and bifurcation diagram (center) of the STG
model with parameter as in A, bottom, under reduction of the calcium activation time constants. The parameter range of bistability gradually shrinks as the time constant of calcium activation decreases to zero (bottom). C: effects of varying the cell membrane capacitance in models with (left) and without (right) slow negative conductance. In the STG model, bursting persists for arbitrary small values of the capacitance. In the CA1 model, bursting only persists in a tiny window around the nominal value of the published model. D: the fragility of bursting in the CA1 model is illustrated with respect to different parameters. The different perturbations cause similar alterations of the bifurcation diagram and of the corresponding rhythm: reduction or elimination of spiking in one direction, reduction or elimination of the slow bursting oscillation in the other direction. Bifurcation diagrams correspond to the nominal case (left), increased membrane capacitance (top right), and decreased membrane capacitance (bottom right). z is the activation variable of the M-type potassium current.
trates the various bifurcation diagrams associated with the numerical observations in the previous sections.
Figure 5A illustrates how the modulation from tonic spiking to bursting in Fig. 1A affects the corresponding bifurcation diagrams. For the tonic spiking mode (point a in Fig. 1A), the bifurcation diagram is the bifurcation diagram of a spiking model: the equilibrium curve is monotone, and there is no bistable range. For the bursting mode (point b in Fig. 1A), the diagram instead exhibits the bistable range of a robust SH burster consistent with the regenerative phase portraits of Fig. 4A. As illustrated in Fig. 5B, the bistable range of the burster is progressively lost when the slow conductance becomes fast. Here the bistability is lost not because of a deformation of the equilibrium curve (consistent with the fact that the static properties of the model are unchanged) but because the two bifurcations that determine the parameter range of bistability (SN and SH) progressively merge to a saddle-node homoclinic (SNH) bifurcation. Near the SNH bifurcation, the fragility of the bistable range is consistent with the fragility of restorative phase portraits of Fig. 4A.
The impact of the bistable parameter range on the fragility of bursting is further illustrated in Fig. 5C, where we reexamine the robustness of bursting models to a perturba-tion of the membrane capacitance (see Fig. 2). This pertur-bation affects the timescale separation between the fast and slow variables of reduced phase portraits. Bursting in the STG model is robust to this perturbation as far as the capacitance is low enough to allow for spike generation, consistent with the regenerative phase portraits of Fig. 4A. The timescale separation between fast and slow variables can be increased at will without destroying the bistable bifurcation parameter range that is essential to bursting (Fig. 5C, left). In sharp contrast, bursting in the CA1 model is fragile to the same perturbation, consistent with the restor-ative phase portraits of Fig. 4A. The bistable parameter range quickly disappears, perturbing the SN-SH bifurcation diagram of a bursting attractor into one of two possible scenarios: either the saddle-node on invariant circle (SNIC) bifurcation diagram of a slow spiker (smaller values of membrane capacitance) or the SN-SN bifurcation diagram of a slow rhythm that switches between low and high resting states (larger values of membrane capacitance) (Fig. 5C,
right). In the case where the capacitance is low enough to
allow for spike generation, the robust firing pattern of the CA1 model is a slow spiking pattern, not a bursting pattern. Finally, Fig. 5D illustrates that this fragility is generic and not specific to a particular parameter. The robustness of the nominal CA1 bursting model was tested against five differ-ent parameter perturbations. In each case, the perturbation is well in the range of physiological variability and it produces the same alteration of the bifurcation diagram (the effect of a 5-mV change in the potassium reversal potential is par-ticularly striking). The bursting attractor is fragile, in the sense that small parameter variations disrupt the rhythm of the nominal model. It is also rigid, in the sense that different parameter variations always disrupt the rhythm in the same way (i.e., deform the bifurcation diagram in the same way), disrupting either the fast or the slow oscillation of the bursting rhythm.
DISCUSSION
A transient signature characterizes the transition from spik-ing to burstspik-ing. The computational experiments in this study
suggest the critical role of the slow conductance in a robust and tunable bursting model. The classical voltage-clamp experi-ment of electrophysiology near threshold provides a clear signature that the sign of this conductance is modulated during a continuous modulation from spiking to bursting. We now discuss several reasons why the role of the slow negative conductance is often overlooked both in experimental and modeling studies.
The specific signature of a slow negative conductance has been reported experimentally, at least in two published papers: Rodriguez et al. (2013, Figs. 3 and 5) use this signature to assess the modulatory effects of the peptide CabPK in regu-lating a cellular and circuit bursting rhythm, and Swensen and Bean (2005, Fig. 11) use the same signature to assess the cooperation of calcium currents and persistent sodium currents in Purkinje cell burst excitability. One important reason why this signature is not more prevalent in experimental studies is that most voltage-clamp experiments nowadays study the cur-rent response to a quasi-static voltage ramp rather than a voltage step. There are several reasons to prefer a ramp to a step in an experimental setup. For instance, a single-ramp input experiment might be sufficient to extract the entire static I-V curve. Unfortunately, a ramp input will mask the transient signature reported in this article. The voltage-clamp experi-ments in Rodriguez et al. (2013) and Swensen and Bean (2005) are rare instances of step input experiments.
More generally, it is the transient nature of the slow con-ductance that makes it difficult to assess from the stationary indicators traditionally associated with experimental investiga-tions of bursting. Most importantly, such indicators include the monotonicity of the I-V curve (Butera et al. 2005; Chen and Tsai 2000; Lewis et al. 1984; Wilson and Wachtel 1974) or the analysis of slow oscillatory potentials (SOPs) (Amini et al. 1999; Canavier et al. 2007; Skinner et al. 1994; Wang and Rinzel 1992, 1993; Zhang and Lewis 2013). Figure 6A con-trasts the dynamical voltage-clamp signature with the mono-tonicity properties of the static I-V curve. It provides four model conditions for which the electrophysiological distinction between tonic firing and bursting is unambiguously predicted by the slow transient voltage-clamp signature but not by the I-V curve. This is because the I-V curve only depends on the stationary value of a voltage-clamp experiment and not on the transient current response. By definition, the slope of the I-V curve at a given voltage is the local conductance of the model at steady state: for a step of small amplitude, this corresponds to the asymptotic value for large t of the ratio ⌬Im(t)/⌬Vm. A
negative conductance in the I-V curve is thus the synonym of an inverse steady-state response in the voltage-clamp experi-ment. The slow transient of the voltage clamp is a transient feature that cannot be inferred from the steady-state response of the voltage clamp.
Bursting and its modulation are also often studied experi-mentally through SOPs observed in the absence of spikes (by blocking sodium channels). But a slow oscillation is not a reliable signature of bursting per se either. Figure 6B illustrates that a slow oscillation does not necessarily discriminate be-tween tonic firing and bursting because either a fast or a slow J Neurophysiol•doi:10.1152/jn.00804.2017•www.jn.org
current can be responsible for the regenerative upstroke of the slow oscillation. Fast or instantaneous activation of a calcium channel as in Fig. 1B will generate neither the slow transient voltage-clamp signature nor bursting, but it provides a steady-state inward current that can be sufficient to destabilize the resting potential and generate a slow oscillatory potential in the absence of sodium channels. Once again, the dynamic role of a given current cannot be inferred from its static properties.
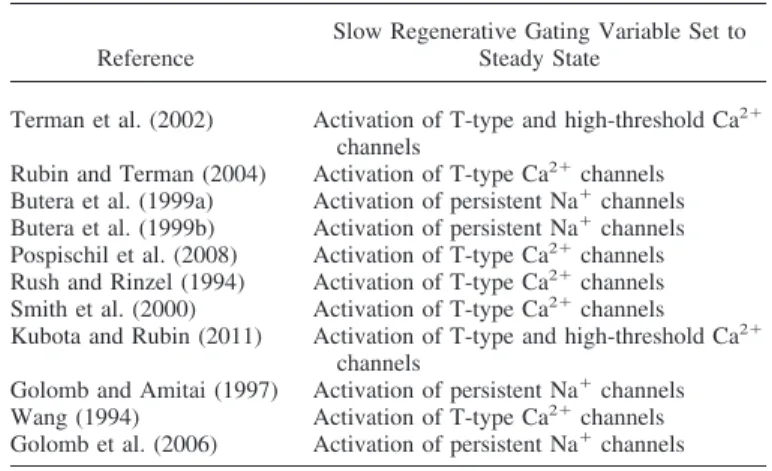
The negative slow conductance is also often overlooked in modeling and computational studies. Its role can only be captured in models that respect the timescale separation be-tween fast and slow regenerative channels. This timescale separation is well acknowledged in the ion channel literature. For instance, activation and inactivation of calcium channels is often described as similar to activation and inactivation of sodium channels, but up to fifty times slower for some of them (Hille 2001, p. 127; Kostyuk et al. 1977). However, it is often neglected in mathematical and computational modeling. For instance, Fig. 5.6 in the textbook by Izhikevich (2007) refers to both sodium and calcium activation as “fast.” The section on calcium channels in the recent textbook by Ermentrout and Terman (2010) also suggests that calcium and sodium channels have similar dynamics. In computational modeling, it is wide-spread practice to set both the calcium and sodium activation to steady state when reducing the complexity of a model. Table 1 provides a list of important papers that make this assumption. All these references suggest that the role of slow negative
conductances in robustness and neuromodulation is underappreciated.
Classification vs. modulation of bursting models.
Mathemat-ical models of bursting often omit the slow negative conduc-tance because they only include the minimal number of cur-rents that is necessary to bursting. The rationale is simple: a spiking model only requires two distinct currents to model the fast negative and the slow positive conductances. In such a
A
Control TTX experiment (gNa = 0) Firing pattern IV curve
(static signature) Voltage-clamp (dynamic signature) Im Vm Vm Im Im Vm Vm Im Im Vm Vm Im Im Vm Vm Im
B
Voltage-clamp Vm Im Vm Im 50 ms 50 ms 50 ms 50 ms 200 ms 250 ms 500 ms 500 ms 50 mV 25 sFig. 6. A: the transient signature of slow negative conduc-tance cannot be recovered from the static I-V curve. A: a region of negative conductance in the I-V curve is neither necessary nor sufficient for bursting. In the STG model described in Liu et al. (1998) (top) the I-V curve possesses a region of negative conductance both in tonic and burst modes. In the STG model of Goldman et al. (2001), the I-V curve is monotone both in tonic and burst modes. See METHODSfor details of the simulations. B: slow oscillatory potentials in the absence of sodium do not necessarily discriminate between fast and slow negative conductances. The Plant R15 Aplysia model described in Rinzel and Lee (1987) exhibits slow oscillatory potential under blockade of sodium channels both in tonic (top) and burst (bottom) modes. SeeMETHODSfor details of the simulations.
Table 1. Published models lacking a slow negative conductance because activation of slow regenerative channels is set to steady state
Reference
Slow Regenerative Gating Variable Set to Steady State
Terman et al. (2002) Activation of T-type and high-threshold Ca2⫹ channels
Rubin and Terman (2004) Activation of T-type Ca2⫹channels
Butera et al. (1999a) Activation of persistent Na⫹channels Butera et al. (1999b) Activation of persistent Na⫹channels Pospischil et al. (2008) Activation of T-type Ca2⫹channels Rush and Rinzel (1994) Activation of T-type Ca2⫹channels Smith et al. (2000) Activation of T-type Ca2⫹channels Kubota and Rubin (2011) Activation of T-type and high-threshold Ca2⫹
channels
Golomb and Amitai (1997) Activation of persistent Na⫹channels Wang (1994) Activation of T-type Ca2⫹channels Golomb et al. (2006) Activation of persistent Na⫹channels
model, the modulation from rest to spike is achieved by modulating the constant applied current. A third current is then enough to model the additional ultraslow positive conductance that converts the spiker into a burster. In this approach, burst-ing is seen as the result of ultraslow adaptation between restburst-ing and spiking. This minimal motif only requires three distinct ionic currents and is at the core of textbook expositions of bursting such as Chapter 9 of Keener and Sneyd (2009), Chapter 9 of Izhikevich (2007), and Chapter 5 of Ermentrout and Terman (2010). It was originally proposed in the work of Chay and Keizer (1983) on secretory (pancreatic) cells. None of these models includes slow regenerative channels, meaning that none of these models includes a source of slow negative conductance. The fact that a minimal model of bursting does not require a slow negative conductance probably reinforces the common practice of considering instantaneous calcium activations in computational models.
If minimal models in the literature show that a slow negative conductance is not necessary to bursting, our results suggest that bursting models that lack a slow negative conductance are necessarily fragile and rigid. Robustness and tunability are not addressed in mathematical textbooks, which focus on classifi-cation rather than modulation. Starting with the seminal work of Rinzel (1985, 1987), the mathematical theory of bursting has relied on a classification based on the possible bifurcations that can govern the transition between rest and spike. The recent work of Izhikevich (2007, p. 376) provides up to 16 different such mechanisms.
Our results show that robustness and tunability are proper-ties that are distinct from a mathematical classification based on bifurcations. For instance, Fig. 4 illustrates that a SN/SH burster can be fragile or robust, and it also illustrates that a burster can be continuously modulated between different shapes without affecting the two bifurcations that determine its mathematical class.
The feedback motif of robust and tunable bursting. Our
analysis of bursting modulation in terms of conductances in different timescales and different voltage ranges has a more general interpretation in terms of distinct feedback loops. When a current source has a positive conductance, it provides negative feedback to the circuit because it counteracts varia-tions of the membrane potential. When it has a negative conductance, it provides positive feedback to the circuit be-cause it amplifies variations of the membrane potential. With this terminology, the main message of this study is that a minimal motif of bursting is a three-feedback motif whereas a four-feedback motif is required for robust modulation. The fundamental role of the slow negative conductance is inter-preted as the fundamental role of a slow positive feedback.
It is common to associate excitability with a two-feedback motif: a fast positive feedback for the spike upstroke and a slow negative feedback for the refractory period. The minimal motif of bursting only adds a third ultraslow negative feedback for the ultraslow adaptation between rest and spike. Instead, our results highlight that bursting is modulated by a balance of negative and positive feedbacks in the slow timescale.
The interpretation of the results in terms of feedback loops links our results to similar findings in other areas of systems biology (see, e.g., Tsai et al. 2008). Positive feedback loops are the essence of switches and thresholds. Our emphasis on distinct sources of fast and slow positive feedbacks has
there-fore the interpretation of the necessity of two rather than one threshold for the robustness and modulation of bursting. Each threshold accounts for two discrete states of the circuit. An excitable circuit relies on one threshold, which separates two discrete states: rest and spike. Our results suggest that a tunable bursting circuit relies on both a fast and a slow threshold. The two thresholds determine four discrete states: rest, tonic spik-ing, slow spikspik-ing, and bursting. In the absence of a slow negative conductance, the circuit has only one source of positive feedback, leading to a single threshold that makes the distinction between spiking and bursting fragile and rigid. The distinction between one and two thresholds also has a clear interpretation in the phase portraits of Fig. 4. The thresholds correspond to points of ultrasensitivity where small perturba-tions of the initial condition lead to large differences in the resulting trajectory. Regenerative phase portraits have distinct fast and slow thresholds. In contrast, restorative phase portraits have only one threshold, which requires a specific ratio be-tween the fast and slow timescales.
We stress that the distinction between four distinct feedback loops of a bursting motif does not necessarily match the physiological distinction between four distinct ionic currents. For instance, sodium channels usually provide a source of fast positive feedback through their activation and a source of slow negative feedback through their inactivation. More generally, the same current can contribute to several of the four feedback loops (Drion et al. 2015; Franci et al. 2013), but a particular modulation scenario will usually have a clear interpretation in terms of the four feedback loops. Central to this study, the modulation from spiking to bursting will inevitably involve a balance between the slow positive feedback provided by slow regenerative channels and the slow negative feedback provided by slow restorative channels. The paper by Drion et al. (2015) introduces the concept of dynamic input conductances to map the modulation of feedback loops to the modulation of con-ductance parameters in an arbitrary concon-ductance-based model. What is central to the message of the present paper is that the slow positive feedback is key to a feedback motif that robustly accounts for modulation from spiking to bursting.
The essential role of the slow negative conductance is consistent with singularity theory. The recent paper by Franci
et al. (2014) uses singularity theory (Golubitsky and Schaeffer 1985) to propose a mathematical analysis of modulation in bursting models. It shows that conductance-based models that have tunable bursting capabilities have a normal form orga-nized by a codimension three winged-cusp singularity. All the attractors that can be generated in the vicinity of this singular-ity can be described in a four-dimensional parameter space: three unfolding parameters and the bifurcation parameter. Those abstract parameters aggregate all possible behaviors of the original model, regardless of the number of physiological parameters. They define the parameters that suffice to shape the attractors of the model.
It is a remarkable mathematical prediction from singularity theory that the four shaping parameters match the gains of the four feedback loops or, equivalently, the four distinct conduc-tances discussed in the present article. In particular, the bifur-cation parameter of the model (Franci et al. 2014) precisely has the interpretation of the balance between positive and negative feedback in the slow timescale. It is this parameter that governs the transition from spiking to bursting in the normal form. J Neurophysiol•doi:10.1152/jn.00804.2017•www.jn.org
Singularity theory therefore identifies this one parameter as the fundamental tuning parameter of a tunable burster. This math-ematical prediction was verified in six different published models in the literature (Franci et al. 2013). A key message of the present study is that this parameter cannot be tuned in a model that lacks currents with slow negative conductance. Modeling bursting without a slow negative conductance nec-essarily leads to models with fewer unfolding parameters than the codimension of its organizing center, a typical ground for caution in singularity theory (Golubitsky and Schaeffer 1985, Section IV.1).
GRANTS
The research leading to these results has received funding from the European Research Council under Advanced ERC Grant Agreement Switchlet No. 670645 and from DGAPA-PAPIIT(UNAM) grant RA105816.
DISCLOSURES
No conflicts of interest, financial or otherwise, are declared by the authors.
AUTHOR CONTRIBUTIONS
A.F., G.D., and R.S. conceived and designed research; A.F. and G.D. interpreted results of experiments; A.F. and G.D. prepared figures; A.F. and R.S. drafted manuscript; A.F., G.D., and R.S. edited and revised manuscript; A.F., G.D., and R.S. approved final version of manuscript; G.D. performed experiments.
REFERENCES
Amini B, Clark JW Jr, Canavier CC. Calcium dynamics underlying
pace-maker-like and burst firing oscillations in midbrain dopaminergic neurons: a computational study. J Neurophysiol 82: 2249 –2261, 1999. doi:10.1152/jn. 1999.82.5.2249.
Bezdudnaya T, Cano M, Bereshpolova Y, Stoelzel CR, Alonso JM, Swad-low HA. Thalamic burst mode and inattention in the awake LGNd. Neuron
49: 421– 432, 2006. doi:10.1016/j.neuron.2006.01.010.
Butera R, Rubin J, Terman D, Smith J. Oscillatory bursting mechanisms in
respiratory pacemaker neurons and networks. In: Bursting: The Genesis of
Rhythm in the Nervous System, edited by Coombes S, Bressloff PC. London:
World Scientific, 2005, p. 303–346. doi:10.1142/9789812703231_0012.
Butera RJ Jr, Rinzel J, Smith JC. Models of respiratory rhythm generation
in the pre-Bötzinger complex. I. Bursting pacemaker neurons. J
Neuro-physiol 82: 382–397, 1999a. doi:10.1152/jn.1999.82.1.382.
Butera RJ Jr, Rinzel J, Smith JC. Models of respiratory rhythm generation
in the pre-Bötzinger complex. II. Populations of coupled pacemaker neu-rons. J Neurophysiol 82: 398 – 415, 1999b. doi:10.1152/jn.1999.82.1.398.
Canavier CC, Oprisan SA, Callaway JC, Ji H, Shepard PD. Computational
model predicts a role for ERG current in repolarizing plateau potentials in dopamine neurons: implications for modulation of neuronal activity. J
Neurophysiol 98: 3006 –3022, 2007. doi:10.1152/jn.00422.2007.
Chay TR, Keizer J. Minimal model for membrane oscillations in the
pancreatic beta-cell. Biophys J 42: 181–190, 1983. doi: 10.1016/S0006-3495(83)84384-7.
Chen YH, Tsai MC. Action potential bursts in central snail neurons elicited
by d-amphetamine: roles of ionic currents. Neuroscience 96: 237–248, 2000. doi:10.1016/S0306-4522(99)00513-8.
Dethier J, Drion G, Franci A, Sepulchre R. A positive feedback at the
cellular level promotes robustness and modulation at the circuit level. J
Neurophysiol 114: 2472–2484, 2015. doi:10.1152/jn.00471.2015.
Drion G, Franci A, Dethier J, Sepulchre R. Dynamic input conductances
shape neuronal spiking. eNeuro 2: ENEURO.0031-14.2015, 2015. doi:10. 1523/ENEURO.0031-14.2015.
Drion G, Franci A, Seutin V, Sepulchre R. A novel phase portrait for
neuronal excitability. PLoS One 7: e41806, 2012. doi:10.1371/journal.pone. 0041806.
Ermentrout GB, Terman DH. Mathematical Foundations of Neuroscience.
New York: Springer Science & Business Media, 2010, vol. 35. doi:10.1007/ 978-0-387-87708-2.
Franci A, Drion G, Sepulchre R. An organizing center in a planar model of
neuronal excitability. SIAM J Appl Dyn Syst 11: 1698 –1722, 2012. doi:10. 1137/120875016.
Franci A, Drion G, Sepulchre R. Modeling the modulation of neuronal
bursting: a singularity theory approach. SIAM J Appl Dyn Syst 13: 798 – 829, 2014. doi:10.1137/13092263X.
Franci A, Drion G, Seutin V, Sepulchre R. A balance equation determines
a switch in neuronal excitability. PLOS Comput Biol 9: e1003040, 2013. doi:10.1371/journal.pcbi.1003040.
Goldman MS, Golowasch J, Marder E, Abbott LF. Global structure,
robustness, and modulation of neuronal models. J Neurosci 21: 5229 –5238, 2001.
Golomb D, Amitai Y. Propagating neuronal discharges in neocortical slices:
computational and experimental study. J Neurophysiol 78: 1199 –1211, 1997. doi:10.1152/jn.1997.78.3.1199.
Golomb D, Yue C, Yaari Y. Contribution of persistent Na⫹ current and M-type K⫹current to somatic bursting in CA1 pyramidal cells: combined experimental and modeling study. J Neurophysiol 96: 1912–1926, 2006. doi:10.1152/jn.00205.2006.
Golubitsky M, Schaeffer DG. The recognition problem. In: Singularities and Groups in Bifurcation Theory. New York: Springer, 1985. doi: 10.1007/978-1-4612-5034-0_2.
Hille B. Ion Channels of Excitable Membranes. Sunderland, MA: Sinauer,
2001.
Izhikevich EM. Dynamical Systems in Neuroscience. Cambridge, MA: MIT
Press, 2007.
Keener J, Sneyd J. Mathematical Physiology. New York: Springer, 2009.
doi:10.1007/978-0-387-75847-3.
Kostyuk PG, Krishtal OA, Shakhovalov YA. Separation of sodium and
calcium currents in the somatic membrane of mollusc neurones. J Physiol 270: 545–568, 1977. doi:10.1113/jphysiol.1977.sp011968.
Krahe R, Gabbiani F. Burst firing in sensory systems. Nat Rev Neurosci 5:
13–23, 2004. doi:10.1038/nrn1296.
Kubota S, Rubin JE. NMDA-induced burst firing in a model subthalamic
nucleus neuron. J Neurophysiol 106: 527–537, 2011. doi:10.1152/jn.01127. 2010.
Lewis DV, Evans GB, Wilson WA. Dopamine reduces slow outward current
and calcium influx in burst-firing neuron R15 of Aplysia. J Neurosci 4: 3014 –3020, 1984.
Liu Z, Golowasch J, Marder E, Abbott LF. A model neuron with
activity-dependent conductances regulated by multiple calcium sensors. J Neurosci 18: 2309 –2320, 1998.
Marder E. Neuromodulation of neuronal circuits: back to the future. Neuron
76: 1–11, 2012. doi:10.1016/j.neuron.2012.09.010.
Marder E, Bucher D. Understanding circuit dynamics using the
stomatogas-tric nervous system of lobsters and crabs. Annu Rev Physiol 69: 291–316, 2007. doi:10.1146/annurev.physiol.69.031905.161516.
Marder E, O’Leary T, Shruti S. Neuromodulation of circuits with variable
parameters: single neurons and small circuits reveal principles of state-dependent and robust neuromodulation. Annu Rev Neurosci 37: 329 –346, 2014. doi:10.1146/annurev-neuro-071013-013958.
McCormick DA, Bal T. Sleep and arousal: thalamocortical mechanisms. Annu Rev Neurosci 20: 185–215, 1997. doi:10.1146/annurev.neuro.20.1. 185.
Pospischil M, Toledo-Rodriguez M, Monier C, Piwkowska Z, Bal T, Frégnac Y, Markram H, Destexhe A. Minimal Hodgkin-Huxley type
models for different classes of cortical and thalamic neurons. Biol Cybern 99: 427– 441, 2008. doi:10.1007/s00422-008-0263-8.
Prinz AA, Billimoria CP, Marder E. Alternative to hand-tuning
conduc-tance-based models: construction and analysis of databases of model neu-rons. J Neurophysiol 90: 3998 – 4015, 2003. doi:10.1152/jn.00641.2003.
Rinzel J. Bursting oscillations in an excitable membrane model. In: Ordinary and Partial Differential Equations, edited by Sleeman BD, Jarvis RJ. Berlin:
Springer, 1985, p. 304 –316. doi:10.1007/BFb0074739.
Rinzel J. A formal classification of bursting mechanisms in excitable systems. Mathematical Topics in Population Biology, Morphogenesis and Neurosci-ences., edited by Teramoto E, Yumaguti M. Berlin: Springer, 1987, p.
267–281. doi:10.1007/978-3-642-93360-8_26.
Rinzel J, Lee YS. Dissection of a model for neuronal parabolic bursting. J Math Biol 25: 653– 675, 1987. doi:10.1007/BF00275501.
Rodriguez JC, Blitz DM, Nusbaum MP. Convergent rhythm generation from
divergent cellular mechanisms. J Neurosci 33: 18047–18064, 2013. doi:10. 1523/JNEUROSCI.3217-13.2013.
Rubin JE, Terman D. High frequency stimulation of the subthalamic nucleus
eliminates pathological thalamic rhythmicity in a computational model. J
Comput Neurosci 16: 211–235, 2004. doi:10.1023/B:JCNS.0000025686. 47117.67.
Rush ME, Rinzel J. Analysis of bursting in a thalamic neuron model. Biol Cybern 71: 281–291, 1994. doi:10.1007/BF00239616.
Sherman SM. Tonic and burst firing: dual modes of thalamocortical relay. Trends Neurosci 24: 122–126, 2001. doi:10.1016/S0166-2236(00)01714-8.
Skinner FK, Kopell N, Marder E. Mechanisms for oscillation and frequency
control in reciprocally inhibitory model neural networks. J Comput Neurosci 1: 69 – 87, 1994. doi:10.1007/BF00962719.
Smith GD, Cox CL, Sherman SM, Rinzel J. Fourier analysis of sinusoidally
driven thalamocortical relay neurons and a minimal integrate-and-fire-or-burst model. J Neurophysiol 83: 588 – 610, 2000. doi:10.1152/jn.2000.83.1.588.
Storm JF. Potassium currents in hippocampal pyramidal cells. Prog Brain Res
83: 161–187, 1990. doi:10.1016/S0079-6123(08)61248-0.
Swensen AM, Bean BP. Ionic mechanisms of burst firing in dissociated
Purkinje neurons. J Neurosci 23: 9650 –9663, 2003.
Swensen AM, Bean BP. Robustness of burst firing in dissociated purkinje
neurons with acute or long-term reductions in sodium conductance. J
Neurosci 25: 3509 –3520, 2005. doi:10.1523/JNEUROSCI.3929-04.2005.
Terman D, Rubin JE, Yew AC, Wilson CJ. Activity patterns in a model for
the subthalamopallidal network of the basal ganglia. J Neurosci 22: 2963– 2976, 2002.
Tsai TY, Choi YS, Ma W, Pomerening JR, Tang C, Ferrell JE Jr. Robust,
tunable biological oscillations from interlinked positive and negative feed-back loops. Science 321: 126 –129, 2008. doi:10.1126/science.1156951.
Wang XJ. Multiple dynamical modes of thalamic relay neurons: rhythmic
bursting and intermittent phase-locking. Neuroscience 59: 21–31, 1994. doi:10.1016/0306-4522(94)90095-7.
Wang XJ, Rinzel J. Alternating and synchronous rhythms in reciprocally
inhibitory model neurons. Neural Comput 4: 84 –97, 1992. doi:10.1162/ neco.1992.4.1.84.
Wang XJ, Rinzel J. Spindle rhythmicity in the reticularis thalami nucleus:
synchronization among mutually inhibitory neurons. Neuroscience 53: 899 – 904, 1993. doi:10.1016/0306-4522(93)90474-T.
Wilson WA, Wachtel H. Negative resistance characteristic essential for the
maintenance of slow oscillations in bursting neurons. Science 186: 932–934, 1974. doi:10.1126/science.186.4167.932.
Zhang C, Lewis TJ. Phase response properties of half-center oscillators. J Comput Neurosci 35: 55–74, 2013. doi:10.1007/s10827-013-0440-1.