HAL Id: tel-02021019
https://tel.archives-ouvertes.fr/tel-02021019
Submitted on 15 Feb 2019HAL is a multi-disciplinary open access archive for the deposit and dissemination of sci-entific research documents, whether they are pub-lished or not. The documents may come from teaching and research institutions in France or abroad, or from public or private research centers.
L’archive ouverte pluridisciplinaire HAL, est destinée au dépôt et à la diffusion de documents scientifiques de niveau recherche, publiés ou non, émanant des établissements d’enseignement et de recherche français ou étrangers, des laboratoires publics ou privés.
knowledge networks
Misbah Razzaq
To cite this version:
Misbah Razzaq. Integrating phosphoproteomic time series data into prior knowledge networks. Bioin-formatics [q-bio.QM]. École centrale de Nantes, 2018. English. �NNT : 2018ECDN0048�. �tel-02021019�
T
HESE DE DOCTORAT DE
L'ÉCOLE
CENTRALE
DE
NANTES
COMUE UNIVERSITE BRETAGNE LOIRE
ECOLE DOCTORALE N°601
Mathématiques et Sciences et Technologies de l'Information et de la Communication Spécialité : Informatique
« Integrating Phosphoproteomic Time Series Data into Prior Knowledge
Networks »
Thèse présentée et soutenue à « Nantes », le « 05/12/2018 »
Unité de recherche : Laboratoire des Sciences du Numérique de Nantes Par
« Misbah RAZZAQ »
Rapporteurs avant soutenance :
Céline ROUVEIROL Professeur des universités, Université Paris 13
Thomas SAUTER Professeur, Université du Luxembourg
Composition du Jury :
Président : Frédéric SAUBION Professeur des universités, Université d'Angers
Examinateurs : Sara-Jane DUNN Directrice de recherche, Microsoft Research Cambridge
Sabine PERES Maître de conférences, Université de Paris Sud
Dir. de thèse : Jérémie BOURDON Professeur des universités, Université de Nantes
Co-encadrant de thèse : Carito GUZIOLOWSKI Maître de conférences, École Centrale de Nantes
First and foremost, I want to thank God for blessing me with this life and for being there in good and bad times.
I would like to thank my supervisor, Dr. Carito Guziolowksi, who I met for the first time when I arrived to Nantes by train at 11 o clock at night. She was there to pick me up at this late hour. She won my heart right there by this simple act of kindness. I knew at that moment that I am going to learn science as well as humanity from her. She has played a significant role in my life in these 3 years of PhD. Her constant support and guidance has helped me to understand my thesis subject properly.
I would also like to thank my supervisor, Dr. Jeremie Bourdon, who I get to know in the mid of my PhD. He has provided me with immense support and guidance during my thesis work. I have also learned a great deal of politeness from him.
I am also grateful to my parents, for not following the typical traditions and helping me to get the education, which allowed me to write this thesis. My mother, Rubeena, encouraged me to be an independent woman. My father, Razzaq, appreciated my individuality instead of making me follow the crowd. My brothers, Adnan and Munsfeen, provided constant loving support even during the times when we disagreed.
I would also like to thank my special friend, Roland, with whom I enjoyed an 80km cycling trip and 1000m hike (record of my life, almost died). He also annoyed me a lot with his ambition of teaching me how to use articles. He taught me the importance of persistence and confidence.
I am thankful to my friends, Julia, Abhilash, and Khaoula for taking care of me when I got sick which happened quite a lot during first two years of my PhD. Thanks to Julien for taking care of my plants and listening to me during stressful times. Thanks to Simon for trying to teach me how to swim which I still cannot do. I am also grateful to Bodgan, Konstatin, Sylvain, Deep, Tahir, Sebestien and (annoying) Saman for great moments and discussions.
I would like to end this section with this beautiful quote:
“Your task is not to seek for love, but merely to seek and find all the barriers within yourself that you have built against it.” Rumi.
1 Introduction 13
1.1 Motivation . . . 14
1.2 Contributions . . . 16
1.2.1 The caspo-ts system applied to breast cancer . . . 16
1.2.2 Extension of the caspo-ts system . . . 17
1.3 Organization of the thesis . . . 18
2 Background and Related Work 19 2.1 Breast cancer . . . 19
2.1.1 Breast cancer types . . . 19
2.1.2 Cell lines . . . 21
2.2 Phosphoproteomics experimental dataset . . . 25
2.3 Prior knowledge networks . . . 28
2.4 Computational modeling of protein signaling networks . . . 29
2.4.1 Ordinary differential equation models . . . 29
2.4.2 Stochastic models . . . 34
2.4.3 Dynamic bayesian networks . . . 37
2.4.4 Integer linear programming . . . 39
2.5 Conclusion . . . 42
3 Answer Set Programming 43 3.1 Introduction . . . 43
3.2 Basic ASP syntax . . . 44
3.2.1 ASP extensions . . . 46
3.2.2 Optimization statements . . . 48
3.3 Related work . . . 51
3.3.1 Learning Boolean networks . . . 51
3.3.2 Learning diverse solutions . . . 54
4 Computational Discovery of Dynamic Cell Line Specific Boolean Networks from
Multiplex Time-Course Data 57
4.1 Introduction . . . 57
4.2 Caspo-ts framework . . . 58
4.2.1 Prior knowledge network . . . 58
4.2.2 Phosphoproteomic time series data . . . 58
4.2.3 Boolean network . . . 60
4.2.4 ASP solving . . . 61
4.2.5 Model checking and true positive BNs . . . 63
4.2.6 Computation of root mean square error . . . 63
4.3 Caspo-ts logic program . . . 64
4.3.1 Modeling PKN and data . . . 65
4.3.2 Over-approximation . . . 65
4.3.3 Objective function . . . 66
4.4 Graph similarity measure . . . 66
4.5 HPN-DREAM challenge case study . . . 67
4.5.1 Data acquisition . . . 67
4.5.2 Data preprocessing . . . 69
4.5.3 Prior knowledge network . . . 69
4.5.4 Cell line specific Boolean networks . . . 70
4.5.5 Heterogeneity among cell lines . . . 74
4.5.6 Biological literature related to the Boolean functions discovered by caspo-ts . . . 77
4.5.7 Evaluation . . . 77
4.6 Discussion . . . 84
4.7 Conclusion . . . 86
5 Computing Diverse Boolean Networks from Phosphoproteomic Time Series Data 87 5.1 Introduction . . . 87
5.2 Materials and methods . . . 88
5.2.1 Artificial dataset . . . 88
5.2.2 HPN-DREAM . . . 88
5.2.3 The caspo-ts system . . . 88
5.2.4 Improvements in caspo-ts . . . 93
5.3 Results . . . 96
5.3.1 Artificial dataset . . . 96
5.3.3 Computation of root mean square error . . . 100
5.3.4 Improvements in computation time of a BN’s model checking . . . 101
5.4 Discussion . . . 102
5.5 Conclusion . . . 103
6 Conclusions and Future Work 105 6.1 Summary . . . 105
6.2 Future perspectives . . . 107
6.2.1 Simulation of Boolean models . . . 107
6.2.2 Extension of diversity algorithm . . . 107
6.2.3 Extension of model checking algorithm . . . 107
6.2.4 Experimental design . . . 108 7 Scientific Activities 109 7.1 Publications . . . 109 7.2 Academic visits . . . 110 7.3 Scientific Communications . . . 110 7.3.1 Presentations . . . 110 7.3.2 Posters . . . 110 7.4 Teaching . . . 110 7.5 Supervision . . . 111
7.5.1 Simulator for Boolean models . . . 111
7.6 Collaborative Research . . . 111
2.1 Molecular classification of breast cancer cell lines . . . 22
2.2 Characteristics of different protein analysis platforms . . . 28
3.1 Basic connectives to form logic programs . . . 45
3.2 Comparison of ASP solver and CellNOpt as presented by Videla et al. . . 52
4.1 Computation summary . . . 72
4.2 Similarity scores among breast cancer cell lines . . . 74
4.3 Root mean square error . . . 80
4.4 Computation summary of BT549 Cell Line . . . 83
5.1 Analysis of TP BNs . . . 99
5.2 Comparison of previous and parallel model checking . . . 103
1.1 Central dogma of biology . . . 14
1.2 Caspo-ts workflow . . . 16
2.1 Breast structure . . . 20
2.2 Forward and reverse phase protein array format . . . 26
2.3 Overview of RPPA technology . . . 27
2.4 Modeling . . . 29
2.5 Genetic algorithm . . . 35
3.1 ASP workflow . . . 43
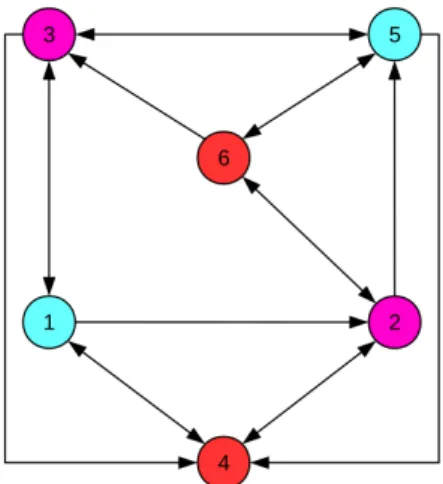
3.2 Directed graph . . . 49
3.3 Directed graph after coloring . . . 51
4.1 Caspo-tsworkflow. . . 59
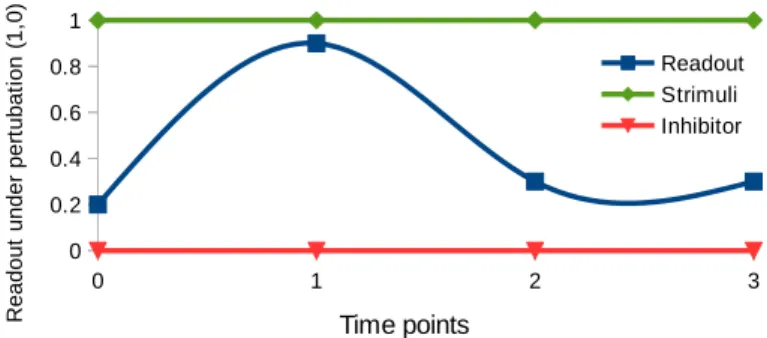
4.2 Phosphoproteomic time series data . . . 60
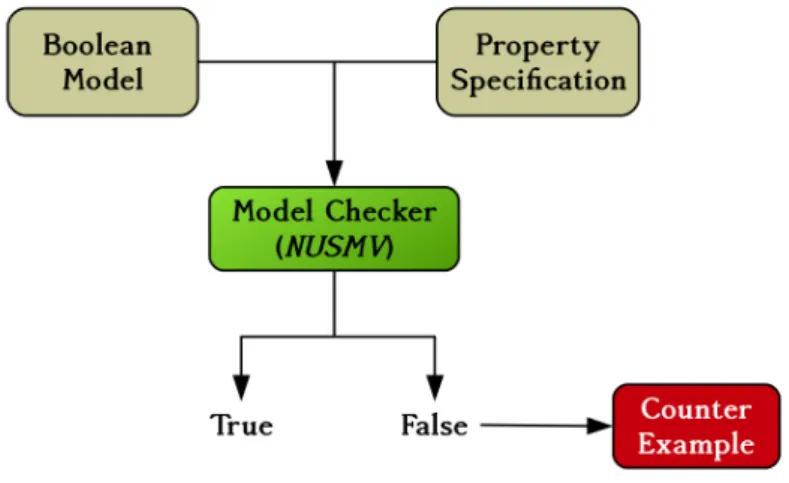
4.3 Model checking process . . . 63
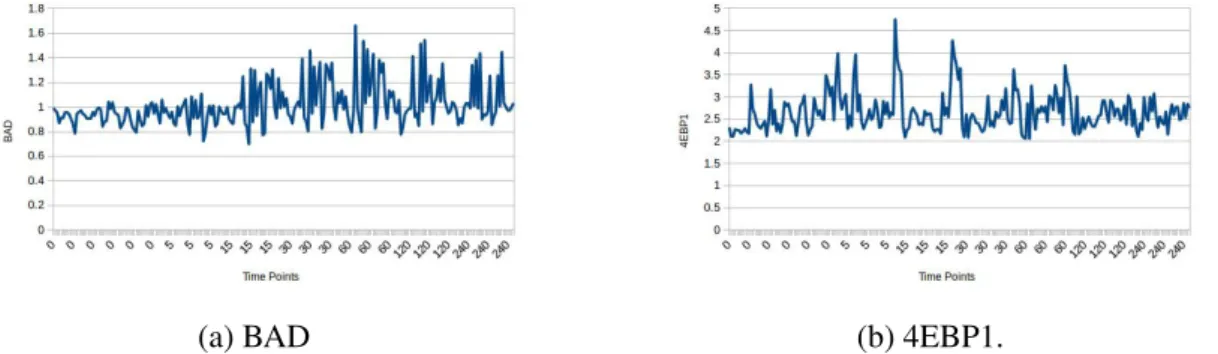
4.4 Protein behavior . . . 68
4.5 BT20 cell line dataset . . . 70
4.6 Breast cancer signaling pathway . . . 71
4.7 Union of BNs of BT20 . . . 73
4.8 Union of BNs of BT549 . . . 73
4.9 Union of BNs of MCF7 . . . 74
4.10 Union of BNs of UACC812 . . . 75
4.11 Boolean network of breast cancer cell lines . . . 76
4.12 Heterogeneous Boolean functions . . . 78
4.13 Common Boolean functions across all four cell lines . . . 79
4.14 RMSE for a family of BNs w.r.t testing data . . . 80
4.15 Performance assessment with learning, testing and random datasets . . . 82
4.16 ROC curve across all cell lines . . . 84
5.1 Difference between CDCL and DPLL algorithms . . . 91 11
5.2 Conflict driven clause learning for example 5.2.3 . . . 92
5.3 Frequency of clauses per node . . . 97
5.4 True positive rate of BNs . . . 98
5.5 caspo-ts: 10 optimal TPs BNs concatenated . . . 100
5.6 caspo-tsD: 10 optimal TP BNs concatenated . . . 101
1
Introduction
Systems biology is the study of biological functions and mechanisms consisting of DNA, RNA, and proteins in a systematic way. It is also concerned with understanding the complex and dynamic biological organization within the living organism in order to explain experimen-tally observed behaviors and do future predictions [Alo06]. Cells are the fundamental units of a living organism and share the same building blocks consisting of DNA, RNA and proteins with different complexity and structure. The central dogma of molecular biology explains the continuous reproduction of cells and flow of genetic information. It states that the blueprint of the DNA is carried by the mRNA (messenger RNA) to make a “protein” as a functional product, which performs the cellular work. Figure 1.1 explains the processes involved in the central dogma of biology: (1) Replication, (2) Transcription, and (3) Translation. Replication is the process of generating new DNA as functional product. Transcription produces new RNA as a result. Translation results in a protein as final product. Even after translation, proteins have to go through many modifications in order to become fully functional [Alo06].
These modifications involve the folding into three dimensional structure and moving to a specific location in the cell. Each cell contains different types of proteins and each protein can be expressed differently under different circumstances. Proteins play an integral role in all cellular functions of living organisms, i.e., creating a signaling cascade and regulating various biological mechanisms. Proteins are made up of the primary sequence of 20 amino acids. Usu-ally proteins interact with other proteins to create complexes of varying sizes. These complexes work with other proteins or complexes to create pathways or modules to carry out tasks in a cell such as signal transduction, metabolism, duplication, DNA transcription, and DNA dam-age repair, etc. Understanding the interactions among proteins and complexes is crucial to fully
Figure 1.1 – Central dogma of biology (Image source: Genome Research Limited).
identify and characterize the structure and functions of the cell machinery.
There have been a lot of advances in experimental, analytical and computational techniques in the last couple of decades. These advances helped to generate large amounts of proteomics data, such as the yeast two-hybrid system and mass spectrometry. Large scale protein to pro-tein interaction databases contain a large number of experimentally verified propro-tein to propro-tein interactions. These advances have made things less clear and at the same time they helped to understand the protein functions, interactions, and structure at varying levels. For example, linear dynamics were used to model signal transduction inside cells; now it seems that signals follow the more complex nonlinear dynamics. Understanding the mechanisms and interactions among proteins helps to unravel how information propagates within cells in different diseases such as cancer [Alo06, DW15]. In this thesis, I am focused on inferring and understanding the protein signaling networks in four breast cancer cell lines (BT20, BT549, MCF7, UACC812).
1.1
Motivation
Protein signaling networks are not static in nature since they respond to stimuli and per-turbation. They constitute complex regulatory systems controlled by crosstalk and feedback mechanisms. These networks are often regulated in diseases. Discovering the precise
mecha-nisms of signal transduction may provide a better fundamental understanding of disease behav-ior. For instance, a main difficulty in cancer treatment is that different signaling networks reveal that cell populations specialize upon treatment and therefore patient responses may be hetero-geneous. Computational models of signaling control for different patient groups could guide cancer research towards a better drug targeting system. In this work, we propose a method-ological framework to discriminate among the regulatory mechanisms of four breast cancer cell lines by building predictive computational models.
Boolean network (BN) modeling is a simple yet powerful framework to study biological models such as signaling pathways or regulatory networks. BNs are based on qualitative ap-proaches, allowing to model large scale biological networks [OPS+15]. Part of the research about this paradigm focuses on the topology of the network, searching for interesting charac-teristics such as cycles and hubs. Some researchers focus on identifying the influences among the components of the network, knowing which gene or protein activates or inhibits the oth-ers. There is also research about studying the dynamics of the model, how the combinations of inherent influences make the system evolve and how this evolution changes under different conditions or situations.
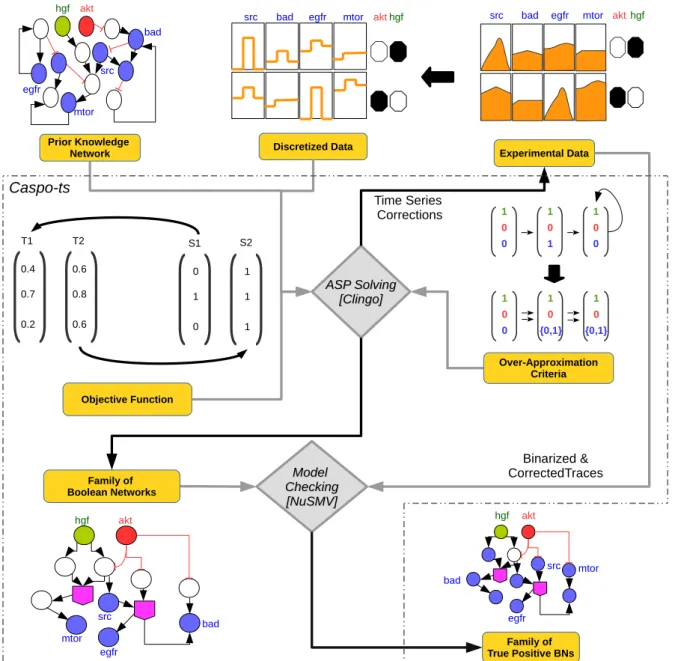
While many BN approaches exist to model biological systems, they focus mainly on system properties, and few exist to integrate experimental data in them. In this thesis, we use the caspo time series (caspo-ts) method to learn cell line specific BNs by integrating protein signaling networks with experimental data. The caspo-ts method uses Answer Set Programming (ASP) and Model Checking techniques to solve the combinatorial optimization problem of enumer-ating a family of Boolean networks (BNs) optimally explaining time-series data [OPS+16]. Figure 1.2 shows the overall process of caspo-ts, a publicly available software at [RPO18].
This thesis is focused on applying and ameliorating the caspo-ts method to large scale experimental data of four breast cancer cell lines to identify cell line specific Boolean models. More precisely, I apply the caspo-ts method to multi-perturbation time series data of four breast cancer cell lines (BT20, BT549, MCF7, UACC812) along with the traditional breast signaling network. I study how these cell lines derive different signaling behaviors under the same con-ditions. This behavior is important to study to unravel the remarkable heterogeneity among breast cancer types. It may help to design effective therapeutic strategies by having a better understanding of the underlying behavior of the system.
Figure 1.2 – Caspo-ts workflow. Prior Knowledge Networks (PKNs) are extracted from lit-erature curated databases containing information about interactions between different proteins or genes. PKNs are available in different databases such as Reactome, PID, etc. Phospho-proteomic time-series data show the measurement of different proteins at different time points under multiple perturbations. A BN consists of a set of nodes where a Boolean function is assigned to each node. The state of each node is updated by evaluating the Boolean function. Given phosphoproteomic time series data we construct a PKN by querying pathway databases. After normalizing the time series data, we use it together with the PKN as input of caspo-ts (ASP component) for learning BNs. Finally, caspo-ts, uses a model checking step to filter false positive BNs. In this figure, the two main components of caspo-ts are shown in orange.
1.2
Contributions
1.2.1
The caspo-ts system applied to breast cancer
Protein signaling networks are static views of dynamic processes where proteins go through many biochemical modifications such as ubiquitination and phosphorylation to propagate sig-nals that regulate cells and can act as feedback systems. Understanding the precise mecha-nisms underlying protein interactions can elucidate how signaling and cell cycle progression occur within cells in different diseases, such as cancer. This knowledge may guide better drug designs.
In this work, I focused on computational identification of BNs representing protein sig-naling behavior using the caspo-ts [OPS+15] method. I used four breast cancer cell lines of the HPN-DREAM challenge dataset [HHC+16, HNJC+17]. This dataset contains multi-perturbation time series data of four breast cancer cell lines (BT20, BT549, MCF7, UACC812). I thoroughly constructed and refined the prior knowledge network (PKN) from public databases, such as Reactom [WDD+14a], to cover the maximum number of proteins existing in the HPN-DREAM challenge dataset. I modeled a family of cell line specific BNs for the four breast cancer cell lines given this PKN.
My key findings suggest that this method is capable of constructing cell line specific Boolean models, which is extremely valuable given the heterogeneity of breast cancer due to many ge-netic modifications. An algorithm is implemented to analyze these cell line specific BNs to
study similarity among these breast cancer cell lines. I have highlighted the common and dis-tinct behaviors.
Further, I validated the inferred BNs using the testing dataset provided by the HPN-DREAM challenge. This dataset was not included while inferring BNs. My models have a Root Mean Square Error (RMSE) of 0.31 with respect to the traces for the testing data, providing an opti-mal fit to the testing data. Furthermore, I also validated the cell line specific Boolean models by comparing them to the canonical mTOR pathway. The obtained results are comparable to the top performing teams of the HPN-DREAM challenge. In addition, this approach can also be used as a complementary method to identify erroneous experiments. Related to this work, I have published an article in Plos Computational Biology journal [RPS+18].
1.2.2
Extension of the caspo-ts system
Diverse Boolean models
Since the ASP solver uses a backtracking algorithm to exhaustively generate BNs, it can lead to a situation where successive BNs share very similar properties. This can be problematic specially in the case of a large solution space where discovering or analyzing all BNs becomes computationally hard. To resolve this issue, a diverse enumeration scheme has been introduced. This feature has been implemented in caspo-ts and allows it to break up the clusters of similar BNs, hence generating diverse BNs. I refer to the modified caspo-ts as caspo-tsD.
I have demonstrated the results of the proposed approach on two different benchmark sce-narios in systems biology: (1) an artificial dataset to model TCR signaling and (2) the HPN-DREAMchallenge dataset to model breast cancer cell lines.
Results suggests substantial improvements of caspo-tsD in solution quality by discovering more signaling behaviors than caspo-ts. Moreover, caspo-tsD is able to find BNs in cases where caspo-ts is unable to find any. Related to this work, I have published an article in the Computational Methods in Systems Biology conference [RKR+18].
Parallel model checking
The ASP part of the caspo-ts system over-approximates BNs. This over-approximation removes a large set of BNs that have no reachable traces, reducing the number of invalid BNs. However, over-approximated reachability does not guarantee to reproduce all time series traces. Hence, at the final step the caspo-ts system uses a model checker to check exact reachability of all (binarized) traces existing in the experimental data by the given BN. This is the most time consuming part of the caspo-ts system. The verification of this reachability is a PSPACE-hard problem and the computation time for checking reachability is highly variable depending on the BN under verification. It can take from an hour to months. Moreover, caspo-ts specifies
all properties in one big specification, which can be slow to verify, especially in the case of large scale networks. I have improved this step, by splitting up the specification, to reduce the computational time of true positive BN detection. Results suggest substantial improvements in computation time.
1.3
Organization of the thesis
This thesis consists of six chapters.
Chapter 1 “Introduction” provides a broad overview and motivation behind this thesis. It precisely specifies the aims and contributions of this work.
Chapter 2 “Background and Related Work” provides background introduction on breast cancer, phosphoproteomic data, signaling networks, and computational modeling. We discuss four different computational methods to model signaling networks: ordinary differential equa-tions, genetic algorithms, dynamic bayesian networks, and integer linear programming. We state the advantages and disadvantages of these methods as compared to the modeling approach (answer set programming) used in this work.
Chapter 3 “Answer Set Programming” introduces the modeling approach used in this thesis. We define basic notations and explain them with examples. Then we discuss related work in the context of modeling signaling networks using answer set programming. We also discuss related work in the context of learning diverse solutions using answer set programming.
Chapter 4 “Computational Discovery of Dynamic Cell Line Specific Boolean Networks from Multiplex Time-Course Data” discusses the first contribution of this thesis. We describe in detail the caspo-ts system and its application on a real case study (HPN-DREAM Challenge). We build signaling networks given phosphoproteomic data and prior knowledge networks. We used multiple criteria to evaluate the learned networks. We also highlight different characteris-tics (such as enumeration order, false positive rate) of the caspo-ts method, which are resolved in the following chapter.
Chapter 5 “Computing Diverse Boolean Networks from Phosphoproteomic Time Series Data” introduces the improved version of the caspo-ts methods. This chapter is related to the second contribution of the method. Here, we describe the new enumeration criteria to sample the solution space of the caspo-ts method. We also give a new algorithm to improve the computational time of verifying a solution using model checker.
Chapter 6 “Conclusions and Future Work” provides the summary and the future perspec-tives of this work.
2
Background and Related Work
2.1
Breast cancer
Breast Cancer is a remarkably complex and heterogeneous disease. It develops as a result of uncontrolled growth of abnormal cells due to genetic mutations. Mutation causes cells to multiply and divide chaotically. Mostly, this leads to the situation where multiple copies of abnormal cells give birth to a tumor. There exists a high diversity within the same type of breast tumors in terms of genomic alterations [RvJH+13]. Moreover, there is also substantial difference within tumor bearing patients. This high level of diversity poses a great challenge for cancer therapy, and demands diverse clinical features [Pol11].
2.1.1
Breast cancer types
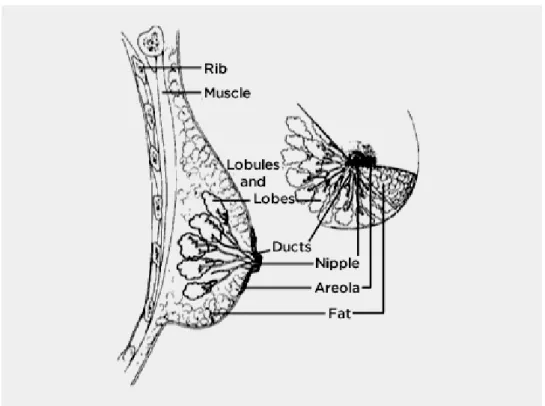
Breast cancer can develop in different sites of the breast: the lobules, the ducts or the tis-sue in between them. The milk producing section of the breast is called lobules. Milk travels through the pathway from lobules to the nipple using ducts (see Figure 2.1). Depending on the area, breast cancer can be divided into two subtypes: (1) Non-invasive and (2) Invasive. With the non-invasive type, the cancer is completely confined to the ducts or lobules and does not spread to the surrounding connective tissues. The non-invasive breast cancer is further sub-divided into two types: (1) ductal carcinoma in situ and (2) lobular carcinoma in situ. With the invasive type, the cancer breaks through the lobular and duct wall, and spreads into the sur-rounding connective tissues. There are further categories of the invasive breast cancer; the most common ones are: (1) invasive ductal carcinoma and (2) invasive lobular carcinoma [SDS+10].
Figure 2.1 – Breast structure (Image source: National Cancer Institute www.cancer.gov). In recent years, researchers have been studying different genetic mutations in breast can-cer through gene analysis techniques (expression microarrays). This led to the development of another classification criteria for breast cancer, i.e., molecular and genetic classification [SLB+10]. According to this criteria, breast cancer can be divided into four molecular sub-types [HS11, DCBL17]:
1. Luminal A or B,
2. Triple negative (A or B) or Basal like, 3. HER2 type,
4. Claudin low.
Luminal breast cancer is hormone receptor positive (estrogen and progesterone). This cancer is slow to grow because of tight cell-cell junctions. Luminal breast cancer is further subdivided into luminal A or B, based on the existence of human epithelial receptor 2 (HER2). HER2 is absent in luminal A and present in luminal B breast cancer. Triple negative breast cancer does not contain any of the most common three receptors (HER2, estrogen and progesterone). Hence, hormone therapy cannot be applied to treat this type of breast cancer. Triple negative breast cancer is further divided into subtype A and B. Subtype A has an abundance of basal markers while subtype B is enriched with stem cell markers. HER2 positive breast cancer contains an abundance of HER2 proteins. This type of cancer is more aggressive than other types. As triple negative breast cancer, claudin low breast cancer also displays the absence of three hormone receptors. Claudin genes (3, 4 and 7), and E-cadherin proteins are absent in
claudin low breast cancer. Studies show that claudin low cancer is enriched with stem cells or cancer initiating cells, which can help in studying earlier stages of tumor cells [Per11, SFG+14, DCBL17].
2.1.2
Cell lines
Cell culture is the process in which cells are cultivated in an artificial environment. Cells can be isolated through a variety of means. They can be derived from the living tissue and disaggregated by mechanical or enzymatic means. They can also be taken from an already established cell line. Cells are maintained and proliferated under controlled conditions, known as the primary culture stage. At this stage, cells are usually subcultured to provide more room for cultivation. After subculturing, cells capable of proliferation are selected and as with the outgrowth from the primary culture stage, give rise to a cell line. Cell lines developed through a primary culture usually have a genetically determined life span. However, some cell lines are transformed into immortal cells and can grow indefinitely under optimal conditions. This can happen because of variety of reasons, e.g., chemical induction or spontaneous occurrence [Fre06].
Cell lines provide a simple and powerful model for studying and analyzing breast cancer biology. They serve as an unlimited source of homogeneous self-replicating material, and are easy to handle, and replace in case of contamination. However, they pose a number of challenges too. Cell lines are susceptible to genetic and epigenetic drifts during their culture [BSE05]. If a cell line is stored for a long time, a subpopulation can arise and cause phenotypic drift resulting in various clones within it [DCBL17].
Despite of their challenging nature, cell lines have been widely used as an experimental model for in vitro studies [NCF+06, BFA+10, PZS+10, FAC13]. They became a powerful tool to investigate how apoptosis, migration and proliferation are deregulated during breast cancer progression. Breast cancer cell lines help to generate quantifiable and reproducible results [VGR07]. They have provided valuable insights into understanding different aspects of breast cancer [LL04]. They have created a large amount of knowledge about breast cancer biology [Eth96, SLB+10, YXW+10, TCJ+10]. They have suggested novel cancer therapies over the past decades [WBB+99, WBM+98, Mas00]. They have been used in preclinical studies and predicted accurate clinical outcomes [CGL10]. In this thesis, we are using four breast cancer cell lines (BT20, BT549, MCF7, and UACC812) to study signaling behaviors.
Molecular classification of breast Cancer cell lines used in this thesis
As described above, breast cancer cell lines are categorized according to the three important receptors: ER (estrogen receptor), PR (progesterone receptor), and HER2 (human epithelial
receptor 2) [DCBL17]. In Table 2.1, we show the molecular classification of the four cell lines used in this study.
Table 2.1 – Molecular classification of breast cancer cell lines.
Cell Lines ER PR HER2 Subtype
BT20 − − − Triple Negative A
BT549 − − − Triple Negative B
MCF7 + + − Luminal A
UACC812 + + / − + Luminal B
In the following, we discuss some history and research work related to these breast cancer cell lines.
BT20
In 1958, the BT20 cancer cell line was isolated from a 74 year old woman. It is the first human breast cancer cell line and was established by Lasfargues and Ozzello [LO58]. It depicts the invasive breast cancer type. Even though it was the first breast cancer cell line, it has not been widely used to study breast cancer. Here, we cite some of the work which has been done using this cell line alongside other cell lines.
In the past, there was a lack of experimental models to study biological properties of human breast cancer. For this, they transplanted the BT20 cell line into nude athymic mice. Results showed the development of tumors at the injection site. Their observations showed that nude athymic mice are suitable for studying human breast cancer [OSM+74].
This cell line together with other breast and ovarian cancer cell lines have been used to study the HER2/neu assay sensitivity. According to the results, the BT20 cell line did not contain an over-expression of HER2 [RJC+02].
A group of 41 breast cancer cell lines (including BT20) was studied to identify BRCA1 mutants. BRCA1 germ mutations put female mutation carriers to high risk of ovarian and breast cancer. Four new cell lines were identified with BRCA1 mutations [EHN+06].
This cell line belongs to the triple negative breast cancer, which means hormone therapy cannot be applied to this kind of cancer. Triple negative breast cancer patients have a poor treatment outcome because of the lack of validated molecular targets. There is a clear need to enhance knowledge about this type of cancer to develop better therapies. The BT20 cell line has been used to study the triple negative breast cancer type [CGL10]. Results suggests that the BT20 cell line has very high expression of the EGFR protein and a genetic amplification of the EGFR gene [LG87].
MCF7
In 1970, the MCF7 cancer cell line was developed using pleural effusion from a 69 year old female metastatic breast cancer patient. It was established by Soule and colleagues at the Michigan Cancer Foundation [SVL+73]. MCF7 is the most studied breast cancer cell line. It mimics several invasive breast cancers which expresses the estrogen receptor (ER). It is widely used to study estrogen response and resistance both in vivo and in vitro, as this cell line maintains a substantial level of ER, considering ER maintenance is not a trivial task. There have been around 25,000 publications related to this cell line till now.
MCF7 played a major role in the development of antibodies for ER positive tumors, since Green et al. developed the first monoclonal antibody to ER [GNEJ80]. These antibodies led to the identification of cDNA clones which express ER mRNA. This aided in the cloning and sequencing of the ESR1 gene [WGG+85]. These antibodies also helped in measuring ER levels in human breast cancer, thus serving as a guide on the use of hormone therapy for ER positive tumors. This cell line also expresses progesterone, glucocorticoid, and androgen receptors [HCM75]. Hence, it is used as a valuable model to study other hormone response pathways.
An area of research focuses on estrogen based stimulation of MCF7 cells. Earlier studies were focused on how estrogen regulates the growth factor signaling [OS11]. Recent studies have revealed that estrogen represses and induces a large number of genes simultaneously. This generates a complex network of alterations, which coordinate to change growth [CPM+12].
MCF7 cells have also been used to study hormone resistance. Some researchers have de-veloped hormone resistant variants of MCF7 cells by either chronic exposure to anti estrogens or estrogen withdrawal. Initially, this slowed down the cell growth, but finally growth resumed. It has been shown that estrogen deprived cells are highly sensitive to estrogen stimulation and express substantial levels of ER [JSB+98]. These studies have identified transcriptomic and epigenetic alterations, which eventually lead to changes in growth factor signaling. The single cell cloning of cells without classification of ER positive or negative clones, highlighted the heterogeneity existing in breast cancer [OZG+01].
MCF7 cell lines do not have an amplified level of HER2. However, Osborne et al. have de-veloped MCF7 cells with amplified HER2 [BSS+92]. They showed how anti HER2 inhibitors can block growth and can be used for treatment. The studies have been validated clinically. Moreover, many laboratories have developed anti HER2 resistant cell lines. Despite the limi-tation imposed by cell culture, this cell line has tremendously advanced the knowledge about breast cancer and gave new directions to breast cancer research [LOD15].
BT549
In 1978, the BT549 cell line was derived from a 72 year old women. This cell line was established by Coutinho and Lasfargues. It is a breast ductal carcinoma cell line. This cell line represents the triple negative breast cancer type [LC81].
Lehmann et al. analyzed gene expression profiles from 21 breast cancer datasets. They identified 587 triple negative breast cancer cases from these breast cancer datasets. Cluster anal-ysis was performed to identify 6 subtypes of triple negative breast cancer. They derived gene expression signatures from these subtypes to select the representative cell line of these subtypes. Then prominent signaling pathways were pharmacologically targeted in these cell lines to study the response to targeted therapies. Results showed that different cell lines have different sensi-tivities. This suggests that the heterogeneity of this disease can be studied through these triple negative cell lines and can help with designing effective preclinical treatments [LBC+11].
In [GMN+12], a group of 25 triple negative breast cancer cell lines were analyzed to iden-tify similarities between cell line and triple negative breast cancer. These cell lines were stud-ied on three molecular levels: genomic, transcriptomic, and epigenomic. They categorized cell lines in three groups. Two groups consisted of ER negative cell lines, while one encompassed of three ER negative and all ER positive cell lines The first two groups agreed with the existing knowledge, while one group was not consistent with existing studies. They further extended the characterization of these breast cancer cell lines. This provided valuable knowledge about suitability of a particular cell line for modeling different features of the breast cancer disease [GMN+12].
Recently, a new classification criteria was proposed to categorize breast cancer cell lines [SSK+17]. The relationship between RNA, TP53 mutation status and protein expression was also quantified. Their analysis revealed heterogeneity within cultures of established cell lines. They compared their finding with other studies, to help guide the selection of cell line models for in vivo and in vitro studies [SSK+17].
UACC812
In 1988, the UACC812 cell line was isolated from a 42 year old women. This cell line was established by Meltzer and colleagues [MLD+91]. It represents the HER2 positive breast cancer type.
Wang et al. investigated mechanisms of resistance to HER2 targeted drugs using a panel of HER2 positive cell lines. They used two drugs (trastuzumab and lapatinib) alone and in combination to study drug resistance. Their results revealed that the resistance to trastuzumab is due to the reactivation of the HER2 pathway. Furthermore, resistance to lapatinib or lapatinib combined with trastuzumab is associated with an alternative signaling through the ER pathway.
They suggested to completely block the HER network and inhibit ER to develop an optimal therapy [WMG+11].
Giuliano et al. analyzed the effects of HER2 targeted therapies on ER and Bcl2 expres-sion in clinical tumor samples and preclinical models. Results suggested that Bcl2 and ER expression increased significantly in breast tumor xenografts treated with anti HER2 therapies. They revealed that the co-regulation of Bcl2 or ER with an anti HER2 therapy can prevent the increased Bcl2 and ER expression in HER2 positive breast cancer patients. They also reported that tumor progression slowed down with endocrine therapy in the presence of restored ER expression in xenograft tumors treated with anti-HER2 therapy [GHW+15].
Zhang et al. investigated the role of EPOR (erythropoietin receptor) in the inhibition and the resistance to the trastuzumab drug, in HER2 positive breast cancer. They identified EPOR mRNA and protein expression in HER2 positive breast cancer cell lines (UACC812, MDA-MB-453, and SKBR3). They suggested that EPOR expression may influence tumor proliferation and progression in HER2 positive breast cancer [ZDX+12].
Brennan et al. studied the connection between the JAM-A (junctional adhesion molecule A) and aggressive tumor, using breast cancer cell lines and clinical datasets. They suggested that over-expression of JAM-A may increase breast cancer progression in HER2 positive breast cancer. They also suggested that JAM-A can serve as a potential drug target and biomarker of HER2 positive breast cancer [BMH+13].
2.2
Phosphoproteomics experimental dataset
Cancer is both a genomic and a proteomic disease at a functional level. A genetic defect may ultimately lead to alterations in a protein signaling network. A defective signaling path-way can cause cancer growth, metastasis, invasion and survival. The future of cancer therapy is personalized treatment. Genomic profiling has been extensively used to personalize chemother-apy treatment. However, it became apparent that genomic profiling represent only one level of detail of the overall process because most of the pharmaceutical targets are proteins. Proteomic profiling provides direct information about protein signaling pathways. Proteomic profiling can be used to examine the signaling network in a normal and a cancerous state. Phospho-proteomics is a branch of Phospho-proteomics, where researchers focus on studying proteins containing post-translational modifications. Such proteins are called phosphoproteins or phosphorylated proteins. Phosphorylation plays a ubiquitous role in regulating different processes, i.e., protein functions, cellular growth, degradation of proteins and signaling [NLSBW08].
Protein arrays are used to measure protein expression in a high-throughput manner. Pro-tein arrays are categorized into a forward phase proPro-tein array and a reverse phase proPro-tein array (RPPA). Forward phase protein arrays (FPPA), also referred to as Enzyme Linked
Immunosor-bent Assays, involve immobilization of multiple antibodies on a surface (see Figure 2.2). FPPA provides a way to analyze the level of multiple proteins in a single sample simultaneously. In reverse phase protein arrays (RPPA), also referred to as Lysate Arrays, different samples (cell, tissue lysates) are immobilized on a surface and are analyzed for the presence of a single pro-tein (see Figure 2.2). Hence, RPPA is ideally suited for measuring the level of a single propro-tein for multiple samples simultaneously [NBK12, MLE10]. For example, it can be used to study the regulation of proteins in healthy and cancerous cells [HRS+09]. It is mainly used to: (1) define new and efficient targeted drug therapies for individual patients, (2) identify and validate biomarkers, and (3) verify drug effects (on or off targets, downstream signaling) [SGTP17].
Figure 2.2 – Forward and reverse phase protein array format.
RPPA has emerged as a standard protein profiling platform over the past few years. RPPA provides an excellent way to capture the activated pathway or protein as a result of phosphoryla-tion. MacBeath and Schreiber are the pioneer developers of protein microarrays [MS00]. They used high-throughput detection to identify protein to protein interaction. Another variation of protein microarrays named as “RPPA” was proposed by the Paweletz et al. in 2001 [PCB+01]. Since 2011, an annual meeting is held to provide a platform for scientists and researchers for exchanging ideas related to RPPA technology.
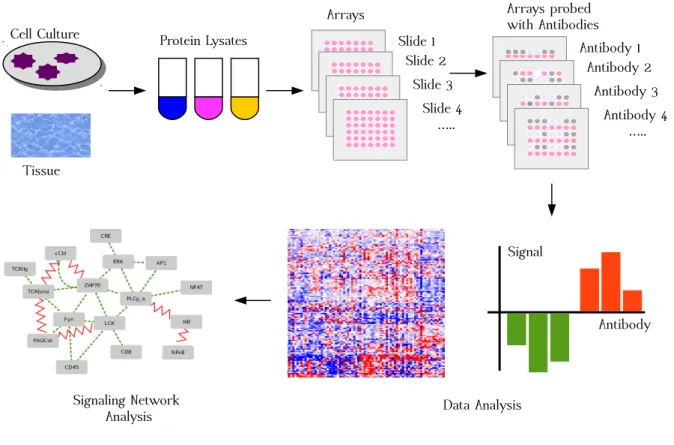
hun-dreds of proteins in biological samples (clinical and preclinical). It consists of micro-blots of protein lysates from multiple samples of cell lines or tissues on a single array where each sam-ple is described by at least one spot. Each array is incubated by one antibody to identify the corresponding protein expression across multiple samples simultaneously. Each array can con-tain thousands of samples. For high-throughput measurement of many proteins, multiplexing on multiple arrays of the same set of lysates is performed using different antibodies (see Figure 2.3) [CH15].
Cell Culture
Tissue
Protein Lysates Slide 1
Slide 2 Slide 3 Slide 4 ….. Antibody 1 Antibody 2 Antibody 3 Antibody 4 ….. Data Analysis Signal Antibody
Arrays Arrays probed
with Antibodies
Signaling Network Analysis
Figure 2.3 – Overview of analysis of signaling networks using RPPA technology. RPPAs offer excellent data for studying deregulated signaling networks in cancer. It allows for investigating and comparing samples treated at different time points under different condi-tions with different doses. It is a useful tool to quantify multiple phosphorylated proteins even in a very small sample, which makes them suitable for individual patient therapy. Several stud-ies have investigated heterogeneity among protein levels within a primary tumor, tumor and metastases of the same patient using data generated by the RPPA technology. Results showed significant heterogeneity in a subset of proteins within a tumor, and between metastases and the primary tumor. This suggests to analyze the samples from multiple locations instead of a single sample. Another study used RPPA to distinguish colon and ovarian cancer by finding molec-ular markers. Other studies found key proteins which play important role in the regulation of signaling pathways in different cancers such as breast cancer, leukemia, and glioma. A first commercial RPPA assay (the TheraLink HER Family Assay) was developed by Theranostics
Health in 2018 and has been given access to by some insurance companies. This assay can be used to guide personalized treatment by linking drug targets with available therapies [The18].
In contrast to RPPA, there exist other proteomic technologies such as mass spectrometry, western blot, and enzyme linked immunosorbent assay (ELISA) (See Table 2.2). Mass spec-trometry based methods can analyze thousands of proteins at a time but they are unable to resolve all proteins within a sample. In contrast, RPPAs are highly sensitive and can detect even low abundance proteins. Mass spectrometry based approaches can be used to discover new candidate biomarkers by comparing healthy tissues with cancerous tissues. RPPA can be used to validate these markers in small samples (taken from patients), thereby deriving an individual precise cancer therapy. There are 380 validated antibodies available for RPPA. As compared to ELISA which requires two antibodies for a protein, RPPA requires only one anti-body against the same protein. Western blot and ELISA require high amount of protein lysates as compared to the RPPA technology [BB15, CH15].
Table 2.2 – Characteristics of different protein analysis platforms.
Pros Cons
Western Blot High specificity High sample, Low-medium throughput ELISA Quantitative, High sensitive High sample, Costly setup for high-throughput Mass Spectrometry High multiplex, Discovery of new biomarkers Low throughput, Complex sample preparation
RPPA High sensitive, High-throughput Costly setup, Specific antibodies
In this thesis, we are using the HPN-DREAM dataset, which was generated by RPPA quan-titative proteomics technology [HNJC+17, HHC+16]. These data contain phosphorylated mea-surements of multiple proteins under sets of perturbations. Perturbation refers to the combina-tion of stimuli and inhibitors.
2.3
Prior knowledge networks
Prior Knowledge Networks (PKNs) are available in different databases such as Reactome, PID, and kegg among others [DW15, WDD+14a, KG00, C+04, KvIH+12, Nis01, SBR+06, SMC+17, XRS+00, PNK+04, HMPL+04, ZMPQ+02, RMD08]. PKNs are graphs where molecules are represented by nodes and interactions are represented by edges. We can con-struct a PKN through different tools or softwares such as ReactomeFIViz [WDD+14b] which is available as a Cytoscape [SMO+03] plugin. A PKN alone cannot be used to build reliable dynamical models or to explain underlying biological behaviors [RCAdS15], because signaling behaviors are rewired in specific contexts. The signaling behavior may differ in cancerous and normal cells due to many genetic modifications [HLM+12]. Therefore, it is extremely impor-tant to manifest how these networks are regulated in different diseases. In order to overcome
this issue, methods have been proposed which take into account both literature based knowl-edge (such as PKNs) and experimental data (such as phosphoproteomic datasets) to build sig-naling networks [OPS+15, MTH+12, GVE+13, SRAE+09, VGE+12]. In this thesis, we use a PKN (built using ReactomeFIViz) combined with the phosphoproteomic time series dataset of four breast cancer cell lines to generate cell line specific Boolean Networks.
2.4
Computational modeling of protein signaling networks
Network modeling has been widely used for studying phosphoproteomic data, yielding important insights into protein interactions, functions, and evolution. Figure 2.4 shows the work-flow of the computational modeling. Computational modeling bridges the gap between traditional biology and high-throughput datasets. A model is constructed using different for-malisms like mathematical modeling, stochastic search methods, bayesian networks, integer linear programming, answer set programming, and then integrated with the experimental data. Afterwards, models can be validated through testing data. These testing data can be generated by traditional biology experiments. If a model’s predictions coincide with the testing data, then it can be used to predict novel events. These novel events can be further validated through experiments before suggesting novel biological insights.
Figure 2.4 – Work-flow of the Computational Modeling (This work-flow was inspired by [KHJ+06]).
Network modeling is an important part of this thesis. In the following, we discuss the general frameworks that can be used for network discovery.
2.4.1
Ordinary differential equation models
Ordinary differential equations (ODEs) based approaches have been widely used for mod-eling complex and dynamic signaling networks. ODEs represent the interaction among various
molecules (such as proteins or genes). In ODEs, the various biological species (such as pro-teins) are represented as variables, where each variable has an equation reflecting its dynamic evolution over time. Here, we describe two types of ODEs:
1. Law of Mass Action, 2. Hill Function.
Here, we show how to formulate biochemical reactions (such as phosphorylation) using above mentioned equations.
Law of mass action
This law states that the rate of reaction is proportional to the chance of a collision of re-actants, which in turn, is proportional to the concentrations of the participating molecules to the power of the molecularity (such as the number in which they enter the specific reaction) [JYL+17]. For example, we can define the molecular interaction between A, B and C by the following equation:
A + B −−*)−−k+ k−
C, (2.1)
where A and B are reactants, C is the product, and k+and k−are the forward and the reverse ki-netic rate constants . The following ODEs can be used to derive the change in the concentration of A, B, and C over time:
d[A] dt = d[B] dt = k+[C] − k−[A][B], (2.2) d[C] dt = k+[A][B] − k−[C]. (2.3) Hill function
In the context of protein signaling networks, Hill functions can be used to represent the state of proteins such as activation or inhibition. In the following, Hill functions can be used to describe the change in protein expression over time. The Hill function is associated with each protein involved in the signaling network.
dy dt = M X i=1 f+(xi) + N X j=1 f−(xj) − y ∗ dy, (2.4) f+ −(x) = kxy x+−nx H + −nx x + x + −nx , (2.5)
where y denotes the concentration of activated protein, xi represents ith protein (i = 1, 2, ..., M ), which activates protein y , and xj is the jth protein (j = 1, 2, ..., N ), which inhibits protein y. f+
−(x), represents the activating or inhibiting profile induced by protein x, respec-tively; kxy denotes the activation or inhibition rate; Hxrepresents the microscopic dissociation constant and nxis the Hill coefficient; dydenotes the degradation rate of protein y [JYL+17].
Iadevaia et al.
In [ILM+10], a computational approach is proposed to model the IGFR signaling network in the MDA-MB231 breast cancer cell line, using a set of ODEs with the law of mass action. The IGFR signaling network representing activation and inhibition interactions, was mapped into a set of 77 chemical reactions. For example, the following equation was used to represent the activation of protein PIK31 by IRS1,
P IK31 + IRS1∗ −−*)−−k+ k−
P IK31∗, (2.6)
where k+ and k− are the forward and the reverse kinetic rate constants. These set of chem-ical reactions were mapped into a system of 127 ODEs. There were total of 313 unknown parameters, representing initial concentration of proteins and kinetic rate constants. The model reduction was performed to decrease computational complexity of the model. The reduced model consisted of 41 chemical reactions, 65 ODEs, and 161 unknown parameters. The qual-ity of the reduced model was ensured by comparing protein profiles predicted by it, with the ones predicted by the original model. To obtain values for the 161 unknown parameters, the mass action model was trained against experimental data using the particle swarm optimization method. Training data consisted of time course measurements of six readouts proteins (p-AKT, p-TSC2, p-GSK3, p-p70S6K, p-mTOR, and p-MAPK). This dataset contained normalized pro-tein profiles of MDA-MB231 cells after IGF1 stimulation. The RPPA technology was used to generate this data. They obtained 10 sets of parameters which explained the experimental data equally well. To determine the quality of the inferred model, testing data were used to gener-ate responses of the IGFR network after MEK inhibition. Computational results were verified experimentally, confirming the accuracy of the modeled network. The mass action model was used to inhibit an individual molecule to predict the response of the IGFR network. Results suggest that inhibition of an individual molecule can activate another molecule, for example through a feedback loop. Three protein p-AKT, p-p70S6K, and p-MAPK levels are usually up-regulated in cancer. To decrease these protein levels, the authors identified optimal inhi-bition targets using random sampling of model parameters (initial protein concentration and kinetic constants). ODEs were solved with these randomly sampled parameter values. The
au-thors identified five main drug targets p-IGFR, p-MAPK, p-MEK, p-IRS-1, and p-AKT. They also performed experimental validations of their findings. Experimental findings agreed that the optimal combination (inhibition of the PI3K and MAPK pathways) of drugs decreased cell proliferation and inhibited cell signaling. However, non-optimal combination (MEK and mTOR inhibitors) did not sufficiently inhibit signaling.
Solomon et al.
Solomon et al. [IGT10] proposed a mathematical approach based on ODEs, to model the HER2/3 AKT protein signaling pathway in breast cancer. They used experimental data from two breast cancer cell lines (SKBr3 and BT747). This dataset contained short term (48 hours) and long term (2 days) effects of inhibition of TKIs (Gefitinib). In this study, 46 proteins (species) were modeled using ODEs. The connectivity information was derived from the liter-ature. All kinetic reactions were represented as first or second order mass action equations. For example, following equation was used to model phosphorylation of B with rate Kb,
d(pB)
dt = Kb∗ B, (2.7)
where p represents the phosphorylation of the protein.
The authors also took into account the trafficking of proteins between the cell membrane and cytoplasm, since HER3 can take hours or days to transfer to cell membrane. This slow transfer can be caused by the feedback loops involved in the pathway or DNA reprogramming (cells rewrite their DNA to survive). Two versions of the model were created to account for the transfer of protein between cell membrane and cytoplasm. DNA reprogramming was modeled by a long delay, and feedback was modeled as a reaction rate following the law of mass ac-tion. They implemented the process of protein transfer between cell membrane and cytoplasm by defining two compartments. One compartment contained HER2 and HER3, and other con-tained internal HER3. Transfer between these two compartments was modeled using diffusion differential equations. Parameter estimation was performed using simple search algorithm, al-lowing the models to fit experimental data. In this work, they described the detailed analysis of one model which has a feedback loop mechanism to show the slow transfer of HER3 between two compartments. The authors applied Gefitinib on this model to study its effects. For this, the model was augmented with a chemical reaction (which follows the kinetic law of mass action), representing that Gefitinib binds to HER2 and its dimers. Results showed pHER3 and AKT recovered their levels even after persistent inhibition of HER2, and HER3 transferred from cy-toplasm to the cell membrane. After they inhibited the trafficking between compartments and applied Gefitinib. Results showed pHER3 and AKT did not recover their levels, and HER3
did not transfer to the cell membrane. Another simulation was performed where AKT was activated externally. Results showed decrease in pHER3 level and HER3 is transferred from the cell membrane to the cell. They kept the parameters where simulation results agreed with the experimental data. Finally, they proposed and simulated a treatment scheme where AKT was activated for two days, which caused drainage in HER3 from the cell membrane, and then Gefitinib was applied which inhibited the HER2/3 and reduced transferring. Their simulation results suggest that the proposed scheme works better than the traditional scheme where Gefi-tinib was applied alone. Moreover, low level of AKT was maintained, eventually leading to the apoptosis of cancer cells.
Shao et al.
Shao et al. [SPJ+13] proposed a systematic approach to study therapeutic effects on cancer cells, and side effects on liver cells. Several canonical pathways were selected by investigating literature curated databases such as KEGG and IPA [KG00, Ing]. These pathways were filtered according to the list of underlying proteins, to build a generic pathway of 26 proteins. Two pathways (cancer cell line specific and liver specific) were generated by training the generic pathway on two different experimental datasets (imaging data and cue signal response data). The cue signaling response dataset was a multiplex time series dataset, containing measurement of 12 proteins under 7 perturbations (6 stimuli and 5 inhibitors) at 4 time points. The cell imag-ing data consisted of measurements of 5 readouts for PC9 lung cancer cell line under kinase inhibitor (GW843682) with 12 concentration levels. A mathematical model based on ODEs with Hill functions was formulated for the generic pathway. For each protein in this pathway, Hill functions were used to represent inhibiting or activating effects, and were formulated ac-cording to Equation 2.4. The mathematical model consisted of 21 ODEs and 151 parameters. Then this mathematical model was trained against experimental data (imaging data) to build a cancer cell line specific pathway. To build the liver cell specific pathway, the generic pathway was trained against the cues response signaling dataset. This model was represented with 52 ODEs (following the law of mass action) and 83 parameters. For parameter estimation, an objective function was defined to minimize the distance between the simulation and experi-mental results. The genetic search algorithm was adopted as a two stage approach for optimal parameter estimation. During the first stage, the algorithm was repeated 50 times to select the best parameters with minimal error between simulation and experimental results. Then the model was simplified by removing links (containing non-best parameters). During the second stage, best parameters were refined by repeating the search algorithm for a simplified model. To perform validation, a leave-one out approach was used. Simulation predictions agreed with experimental results. They analyzed the effects of 27 kinase inhibitors and identified 6 key inhibitors. Out of these, the PF02341066 kinase inhibitor was identified as a proper inhibitor
for suppressing cancer while avoiding damage to the liver cells. They also analyzed the effect of combined inhibitions by selecting 4 out of 6 effective key kinase inhibitors. Their find-ings revealed the threshold for each kinase inhibitor in a combination to predict the expected combined effect.
Conclusion
Mathematical modeling offers useful and powerful tools to model small-scale networks. Models elucidated using mathematical modeling are complex and require explicit specifications of kinetic parameters of the system; parameter estimation becomes computationally intensive as networks grow larger [WMG08, SK13, MTH+12, MW07, ABLS06]. One way to obtain kinetic parameters is from the literature, then find remaining unknown parameters by fitting the model to the experimental data. However, parameter values differ by the order of magnitude. This can be due to incorrect experimental measures or inaccurate modeling. Therefore, parameter estimation is a challenging question in mathematical modeling. Several heuristic methods such as genetic algorithms, and particle swarm optimization are used to estimate parameters in ODE modeling [JYL+17, Blo09].
2.4.2
Stochastic models
Stochastic modeling frameworks are used to model signaling networks accurately, by offer-ing a strategy to cope with the uncertainty and noise inherent in biological processes. Different stochastic methods can be used to model signaling networks such as genetic algorithms.
Genetic algorithms
A genetic algorithm is a bio-inspired search method, which follows the principal of natural selection and evolution. It starts with the belief that the offspring inherit properties of their parents. If parents have the best fitness then their offspring will be better than parents. This is an iterative process, and finally the fittest individuals will be found. Figure 2.5 shows general steps involved in solving problems using genetic algorithm. It starts with defining an initial population. Each individual in this population represents a solution to the problem. A fitness function is evaluated for each individual according to some objective function. Then a stopping criteria is evaluated to create a new population or to terminate the search process. Genetic algorithms have been widely used for solving optimization problems. They are also used for parameter estimation of mathematical models based on ODEs.
Figure 2.5 – Genetic algorithm.
Saez et al.
Saez et al. [SRAE+09] proposed a method (CellNOpt; Cell Net Optimizer), to train pro-tein signaling networks against experimental data in order to build predictive BNs. A propro-tein signaling network of downstream of seven cytokine and growth factor receptors in liver cells was built using ingenuity systems [Ing], and then augmented with literature based information. The network consisted of 82 nodes and 116 edges. The network was compressed by removing non identifiable elements using the CellNOpt software, resulting in a network structure with 31 nodes and 53 edges. The superstructure of logical models was identified from the compressed network, consisting of 131 hyper-edges (logic gates). Hyper-edge refers to the generalization of an edge with multiple inputs and outputs. The resulting superstructure of BNs is trained against the experimental data (cue signal response dataset) using a genetic algorithm. This dataset con-tained measurements of 16 proteins before, and 30 min after, stimulation. The genetic algorithm was run multiple times to optimize the objective function. The objective function was based on minimizing the distance between the data and the simulation while penalizing model size. The resulting family of BNs was validated using those data absent from the training dataset. The results showed a good fitness of BNs to the training dataset. The key findings suggest that the trained networks have fewer interactions as compared to the protein signaling network, but has higher false positive, false negative rate. New links or interactions were suggested which im-proved the fitness of BNs to the experimental data. The resulting models were more predictive than the protein signaling network due to the elimination of nonfunctional links.
Mishra et al.
A hybrid approach based on genetic algorithm and ODEs was proposed by Mishra et al. [MBC+15] to model cell fate decisions and cancer signaling pathways. The authors started with building an apoptosis network (N1) representing the signaling activities inside a normal
cell. The network N1 consisted of 22 proteins, and was constructed by exploring literature knowledge. Twenty two ODEs were formulated for each protein to simulate the N1 network. These ODEs were solved using ode45 (Matlab library function), to infer time series for each protein. Some parameter values were inferred directly from the literature, while others were selected randomly. From the N1 network, the cancer network (N2) was inferred by fitting the simulated data to the cancer dataset using the genetic algorithm. This dataset contained six phenotypic responses of 35 proteins at five time points , for three triple negative breast cancer cell lines BT20, MCF7 and MDA-MB-453. The genetic algorithm was iterated 150 times to discover 50 cancer networks. The rewired events discovered by the genetic algorithm were different in different cancer networks. The rewired events with high frequency were kept to construct N2 network. The N2 network is a modified version of the N1 network, containing two newly added edges while 3 edges were deleted. Various inferred rewired events were verified and confirmed through existing literature. From the N2 network, the cancer network (N3) is inferred by fitting the simulated data to the drug treatment dataset using the genetic algorithm. Th drug treatment dataset consisted of measurements of the signaling and cell fate data under six treatments. The genetic algorithm was repeated 150 times to discover the drug sensitive network. The N3 network is a modified version of the N2 network, containing two newly added edges while 2 edges were deleted. Most of the rewiring events inferred by this method are consistent with the literature. In this work, authors modeled only 18 out of 35 proteins existing in the experimental dataset.
Conclusion
Here, I have described two studies based on non-deterministic stochastic search method (genetic algorithms). Saez et al. [SRAE+09] used genetic search algorithm to train Boolean networks against experimental data. However, it was not guaranteed that genetic search would yield the lowest value of the objective function, so all interactions were exhaustively checked to decrease the model size. Mishra et al. [MBC+15] also used the genetic algorithm to infer models which fit experimental data. They discovered different rewiring events over different iterations of the algorithm. Hence a decent number of iterations were required to converge the solutions. Overall, stochastic search methods are useful for modeling signaling networks, especially with their inherent ability to deal with noise. However, quality of the solution in case of genetic algorithms is highly dependent on the initial population, well written objective function, and the number of iterations. Similar to our method (caspo-ts), the genetic algorithm based method generates a family of solutions. In comparison to caspo-ts, stochastic search methods cannot generate a complete set of solutions, hence they cannot guarantee a global optimal solution.
2.4.3
Dynamic bayesian networks
A bayesian network is a directed acyclic graph G, representing a probabilistic relationship between random variables Xi where i = 1 . . . n. These random variables represent nodes and the probabilistic dependencies among them is represented by edges. The edges are described by the joint probability distribution P (X1, . . . , Xn). The joint probability distribution of the graph has the following general form:
P (X1, . . . , Xn) = ΠNi=1P (Xi = xi||Xj = xj, . . . , Xj+p = xj+p) where Xj is a parent of Xi in G [FLNP00].
Dynamic bayesian networks [DGH92, DGH+95, MR02] are an extension of bayesian net-works in which a directed graph represents how random variables Xi evolve over time. Dy-namic bayesian networks can incorporate feedback loops. In the context of modeling time series data for protein signaling networks, proteins are represented by random variables Xi, time is represented by Tj where j = 1 . . . n. The dynamic bayesian networks described here follow the assumption that time can flow forward only, therefore the value of the variable Xi at t + 1 is only dependent on value of the variable Xi at t [FMR98, Hus03]. The dynamic bayesian networks can be referred to as static bayesian networks unrolled through time where each variable is represented at multiple time points [HLM+12].
There are two steps to model bayesian networks: (1) structure learning and (2) parame-ter learning. The structure learning step involves finding a set of candidate directed acyclic graphs which best explain the data. Then these graphs are scored against some bayesian met-ric (Bayesian Dimet-richlet equivalence or Bayesian Information Criteria). The graph with highest scoring metric is selected. In the parameter learning step, the conditional probability tion of each node is learned. The PKN is taken into account by assuming a particular distribu-tion over a directed acyclic graph.
Hill et al. 2012
Hill et al. [HLM+12] proposed a framework to learn cell specific protein signaling net-works from phosphoproteomic data given a PKN. They started by building a structure of the network which best explains the data. The PKN is taken into account using an informative prior distribution on network structure. Then the posterior distribution over the network is calculated using the marginal likelihood and prior distribution. The marginal likelihood employed here penalizes models with complex parameters, hence reducing the model complexity. The prior distribution contained the expected number of edges (interactions existing in the PKN) and pe-nalized the unusual edges (not part of expected edges). Finally, the posterior probabilities of edges are calculated by model averaging. Model averaging is used to highlight edges which
are common in many network structures. This network building approach was applied to learn signaling network for the MDA-MB-468 breast cancer cell line. The learning data contained measurements of 20 proteins at 8 time points under 4 growth conditions. The PKN consisted of 20 protein and 74 edges. The robustness of the cell line specific network to the PKN was investigated by adding and deleting an edge in the PKN. The 25 perturbed PKNs were gener-ated with changes in one third (25) of the total edges (74). The results showed the robustness to modification in the PKN. The robustness of the results to the data perturbation was also investi-gated, by deleting part of the data and replacing it with the average of adjacent time points. The analysis showed that results are robust to the perturbation of the data. They generated a set of testable hypothesis, discovered various known and unknown signaling behaviors. The known inferred edges were validated through existing literature knowledge. Some of the novel edges were validated through experimental validation.
Hill et al. 2017
Hill et al. [HNJC+17] learned cell line specific networks given PKN and phosphoproteomic data for four breast cancer cell lines (BT20, BT549, MCF7, UACC812) using a variant of dy-namic bayesian networks. The learning data contained measurements of 35 proteins at 7 time points in all cell lines under a combination of perturbations (8 stimuli and 5 inhibitors). The PKN contains information about the connection of these 35 proteins with 65 edges curated from literature. A dynamic bayesian network approach was used to learn 32 context specific networks (4 cell line ∗ 8 stimuli) using learning dataset given PKN. Each network contained 49 edges on average, and 40% of these edges were not part of prior network. The learned net-work consist of probabilities associated to each edge in all these 32 netnet-works. For validation, the changes in these context specific networks under inhibition were compared with the true descendants existing in the canonical pathway. Based on this, a true and false positive rate was calculated to draw the area under the operating curve (AUROC). It was observed that on average 8 proteins showed changes in one context which were not observed in other context. Experimental validation was performed for 78 % of these observations (104 out of 134 ob-servations). To verify robustness of the approach, some part of the data (between 1 to 6 time points) for all proteins was deleted and replaced with adjacent time points. Initial and final time points were kept outside from random removal of the data. The robustness of the learning approach to the prior network was verified by adding and deleting an edge in the PKN. They generated a set of testable hypotheses by discovering some novel interactions. They discovered 235 novel interactions and some (six) of these interactions were validated using western blot analysis. Their key findings suggest that the signaling networks varies according to biolog-ical background. Heterogeneity of inferred networks strongly supports the fact that existing computational methods should be improved to take into account the context specificity.


![Figure 2.4 – Work-flow of the Computational Modeling (This work-flow was inspired by [KHJ + 06]).](https://thumb-eu.123doks.com/thumbv2/123doknet/7871705.263506/30.892.115.782.637.846/figure-work-flow-computational-modeling-work-flow-inspired.webp)