Evolution of microstructure and mechanical properties during
linear friction welding of AD730
TMNi-based superalloy
by
Fatemeh MASOUMI
MANUSCRIPT-BASED THESIS PRESENTED TO ÉCOLE DE
TECHNOLOGIE SUPÉRIEURE IN PARTIAL FULFILLMENT OF THE
REQUIREMENTS FOR THE DEGREE OF DOCTOR OF PHILOSOPHY
Ph.D.
MONTRÉAL, JULY 17, 2018
ÉCOLE DE TECHNOLOGIE SUPÉRIEURE
UNIVERSITÉ DU QUÉBEC
This Creative Commons licence allows readers to download this work and share it with others as long as the author is credited. The content of this work may not be modified in any way or used commercially.
BOARD OF EXAMINERS THIS THESIS HAS BEEN EVALUATED BY THE FOLLOWING BOARD OF EXAMINERS
Dr. Mohammad Jahazi, Thesis Supervisor
Department of Mechanical Engineering at École de technologie supérieure
Dr. Simon Joncas, Chair, Board of Examiners
Department of Automated Production Engineering at École de technologie supérieure
Dr. Tan Pham, Member of the jury
Department of Mechanical Engineering at École de technologie supérieure
Dr. Vladimir Brailovski, Member of the jury
Department of Mechanical Engineering at École de technologie supérieure
Dr.Olanrewaju Ojo,External Evaluator
Department of Mechanical Engineering at University of Manitoba
THIS THESIS WAS PRESENTED AND DEFENDED
IN THE PRESENCE OF A BOARD OF EXAMINERS AND THE PUBLIC JUNE 08 2018
ACKNOWLEDGMENTS
This research work would not have been possible without perspective on various aspects and continual guidance of my supervisor, Mohammad Jahazi. His kindness and positive attitude made this project a very enjoyable learning experience. I thank him for making my PhD study possible and for giving me the opportunity to explore many interesting aspects of materials characterization, welding, physical modeling and data analysis that were documented in this manuscript.
I am very grateful for the opportunity to work with Prof. Jonathan Cormier and learn from him. I owe many thanks to him for his continuous support during my thesis. I would like to extend my appreciation to Loius Thébaud for performing the mechanical tests.
I would like to express appreciation to Aubert & Duval Co. for providing AD730TM samples and to TWI Ltd. for welding the samples especially Dr. Alexandre Deveaux and Mr. Bertrand Flipo for their invaluable discussions.
I would like to thank Dr. Hossein Monajati for helping and training on SEM and EBSD machine and Mr. Radu Romanica for providing facilities at the material laboratory.
I am gratefully acknowledging the financial support from the Natural Sciences and Engineering Research Council (NSERC) of Canada in the form of a Discovery Grant.
Finally, I am deeply indebted to my family for all their love and support.
Most of all, I would like to thank my supportive, patient, and encouraging husband Davood whose support and help during this Ph.D. is so appreciated.
ÉVOLUTION DE LA MICROSTRUCTURE ET DES PROPRIÉTÉS MÉCANIQUES DURANT LE SOUDAGE PAR FRICTION LINÉAIRE DU SUPER ALLIAGE BASE
NICKEL AD730TM
Fatemeh MASOUMI
RÉSUMÉ
Le soudage par friction linéaire (LFW) est une technologie de fabrication émergente d’une part pour l'assemblage des aubes aux disques et d’autre part pour la réparation des disques de turbine (Blisks) dans les turbines à gaz et des moteurs à réaction. Ce type de soudage a déjà été appliqué à des alliages de Ti pour des applications de fonctionnement de compresseur (c'est-à-dire à basse température) mais pas à des composants à haute température. Ainsi, de nombreux défis devaient être résolus avant une application industrielle complète. Certains de ces défis ont été pris en compte dans cette recherche. L'objectif de cette étude a été de développer, pour ce type de soudage, une meilleure compréhension des mécanismes fondamentaux régissant l'évolution de la microstructure et des propriétés mécaniques à haute température des superalliages base nickel et particulièrement dans le cas d'un alliage nouvellement introduit, AD730TM.
Les expériences LFW ont été réalisées en utilisant différents paramètres de procédé. Une méthodologie a été développée pour déterminer les paramètres optimaux pour l'alliage étudié. Cette méthode peut être appliquée à d'autres alliages métalliques. Cela a consisté à estimer l'oscillation, la fréquence, le frottement et la force de forge en utilisant des contraintes plastique d'écoulement de matière, des données rapportées dans la littérature et la capacité de la machine. Le temps de frottement a été estimé sur la base d'un modèle analytique de distribution de température. Il a été déterminé que les échantillons obtenus, par ce type de soudage, avec un raccourcissement axial de 3.5 mm étaient exempts de défauts tels que couches d'oxyde ou microfissures.
Ce superalliage base nickel, AD730TM, a subi des traitements de mises en solution à différentes températures. Dans le but de décrire les processus de dissolution des particules γ' et de quantifier leur fraction volumique des modèles semi-analytique ont été développés. Ces modèles ont été utilisés pour prédire la température ou la fraction volumique du γ' dans différentes zones de l'échantillon soudé par cette technique. Les mécanismes de re-précipitation et la cinétique de rere-précipitation des particules γ' pendant le refroidissement des regions super-solvus et sub-solvus ont été étudiés. Suite à cela, un modèle cinétique a été proposé pour quantifier et prédire la fraction volumique de particules γ' reprécipitées à des vitesses de refroidissement élevées et faibles, représentant le refroidissement post-soudure à différentes distances de l'interface de soudure.
L'étude de la microstructure à l'aide de la microscopie électronique à balayage (MEB) a révélé que la fraction volumique et la taille de γ' augmentaient avec la distance de l'interface
de la soudure. Ces particules ont été totalement dissoutes à l'interface de la soudure, et seule une distribution de re-précipitée γ′ monomodale re-précipitée, de taille inférieure à 10 nm, a été observée à l'interface de soudure. Les cartes de diffraction par électron rétrodiffusé (EBSD) ont montré que la recristallisation discontinue se produisait dans la zone de soudure. La taille des zones affectées thermo-mécaniquement (TMAZ) et des zones de soudure a été estimée en utilisant des cartes EBSD, et confirmée par des mesures de microdureté.
Des mesures de mico-dureté sur des échantillons soudés ont révélé une diminution de la dureté dans les zones affectées thermo-mécaniquement due à la dissolution des particules γ' secondaires et une augmentation de la dureté dans la zone de soudure due au raffinement du grain.
L'examen de l'interface de soudure et de la matière extrudéà l’interface n'a révélé aucun phénomène de liquéfaction (formation de zones resolidifiées). Un nouveau modèle analytique a été développé ; celui-ci prédit les conditions de l'apparition ou de l'absence de la liquéfaction durant le soudage par LFW des superalliages base nickel. Une explication générale est proposée à l’aide de ce modèle qui est capable d'expliquer les données contradictoires rapportées dans la littérature.
Un traitement thermique post-soudage (PWHT), consistant en un traitement en solution sub-solvus γ' suivi d'un vieillissement, a été réalisé sur des éprouvettes soudées par la technique LFW. L'évolution de la microstructure à travers la soudure dans les conditions de soudure et de PWHT a été étudiée en utilisant la microscopie optique et électronique (MEB et EBSD). Les propriétés mécaniques des éprouvettes ont été évaluées en utilisant la microdureté, la traction à température ambiante et à 650°C, ainsi que des tests de fluage.
Des essais de traction 650°C sur des échantillons soudés ont révélé une rupture dans la zone affectée thermiquement (ZAT) en raison de la dissolution des précipités γ'. Les joints ayant subis un traitement thermique post-soudage présentaient une résistance à la traction et au fluage plus élevées que celles des échantillons soudés du fait de la re-précipitation des précipités γ' dans les zones TMAZ et ZAT ; ainsi qu’une croissance des grains dans la zone de soudure. Après le traitement thermique post-soudage (PWHT), les échantillons soudés par la technique LFW ont rompu dans le matériau de base lors des essais de traction. Les joints PWHT présentaient, d’une part une meilleure ductilité, que ceux du matériau de base, à 850°C et d’autre part, une durée de fluage légèrement inférieure à 700°C en comparaison avec le métal de base. L'examen de la microstructure a montré que des fissures étaient initiées à l'interface des particules oxydées à 700°C. La diminution de la résistance au fluage du superalliage AD730TM à 850°C était liée à la combinaison de la formation de zones exemptes de précipités (PFZ) au voisinage des joints de grains (GB) et de microfissuration assistée par oxydation. En outre, il a été trouvé que dans l'intervalle de température étudié, l'AD730TM PWHT avait des caractéristiques de fluage similaires à UdimetTM720 Li et Inconel 738LC pour des faibles valeurs des paramètres de Larson-Miller (LMP) et de meilleures propriétés de fluage que celles de l'alliage Inconel 617 pour des grandes valeurs de LMP.
Mots clés : Soudage friction linéaire ; Superalliage à base de Ni ; AD730TM ; Cinétique de dissolution et de re-précipitation ; Température de liquéfaction ; Mécanismes de liquéfaction ; Propriétés mécaniques à hautes températures ; Mécanismes de fluage.
EVOLUTION OF MICROSTRUCTURE AND MECHANICAL PROPERTIES DURING LINEAR FRICTION WELDING OF AD730TM NI-BASED SUPERALLOY
Fatemeh MASOUMI ABSTRACT
Linear friction welding (LFW) is an emerging manufacturing technology for joining of blades to disks or repairing turbine disks in gas turbines and jet engines. LFW has already been applied to Ti alloys for compressor (i.e. low temperature) operation applications but not to high temperature components. Thus, many challenges need to be addressed before full industrial application. Some of these challenges will be considered in this research. The focus of this study is to develop a better understanding of the fundamental mechanisms governing the evolution of the microstructure and high temperature mechanical properties of LFWed Ni-based superalloys in the case of a newly introduced alloy, AD730TM.
LFW experiments were carried out using different processing parameters. A methodology was developed for determining the optimum LFW parameters for the investigated alloy. The method can be extended and applied to other metallic alloys too. This consisted in estimation of the oscillation, frequency, friction and forge force using material plastic flow stresses, data reported in the literature and machine capability. Friction time was estimated based on an analytical thermal model. It was determined that the LFWed specimens with axial shortening of 3.5 mm were sound and free from oxide layers and microcracks.
The Ni-based superalloy, AD730TM, was solution treated at different temperatures. Semi- analytical model was developed to describe the dissolution processes of γ´ particles, and quantify their volume fraction. This model was used to predict temperature or γ´ volume fraction in different zones of LFWed sample. Reprecipitation mechanisms and kinetics of γ′ particles during cooling from supersolvus and subsolvus temperatures were studied. Then, kinetic model was proposed to quantify and predict the volume fraction of reprecipitated γ′ particles for high and low cooling rates representing the post weld cooling at different distances from the weld interface.
Microstructure investigation using Scanning Electron Microscopy (SEM) revealed that γ′ volume fraction and size increased with the distance from the weld interface. These particles were totally dissolved at the weld interface, and only a monomodal re-precipitated γ′ distribution, less than 10 nm in size, was observed at the weld interface of the as-welded specimens. Electron Backscatter Diffraction (EBSD) maps showed that dynamic recrystallization occurred in the weld zone during LFW in as-welded samples. Thermo-mechanically Affected Zone (TMAZ) and weld zone sizes were estimated using EBSD maps, and were confirmed with microhardness measurements.
Micohardness measurements on as-welded samples revealed a decrease in hardness in TMAZ due to dissolution of secondary γ′ particles, and an increase in hardness in the weld zone due to grain refinement.
Examination of the weld interface and the flash did not reveal any occurrence of liquation (formation of resolidified zones). A new analytical model was developed that predicts the conditions for the occurrence or absence of liquation during LFW of Ni-based superalloys. Using this model, a general explanation is proposed that is able to explain the contradictory data reported in the literature.
Post Weld Heat Treatment (PWHT), consisting of γ′ sub-solvus solution treatment followed by aging, was conducted on LFWed specimens. Microstructure evolution across the weld in the as-weld and PWHT conditions were studied using optical microscopy, SEM and EBSD. Mechanical properties of the LFWed specimens were evaluated using microhardness, tensile at room temperature and 650°C, as well as creep tests.
Tensile tests on as-welded samples at 650°C revealed failure at Heat Affected Zone (HAZ) due to dissolution of γ′ precipitates. PWHTed joints showed higher tension and creep resistance than those of as-welded samples due to a combination of reprecipitation of γ′ precipitates at TMAZ and HAZ as well as grain growth at the weld zone. After PWHT, LFWed specimens failed in the base material under tensile tests. The PWHTed joints exhibited better ductility than those of base material at 850°C while they showed slightly lower creep life at 700°C in comparison to the base metal. Microstructure examination showed that cracks initiated at the interface of oxidized particles at 700°C. The decrease in creep resistance of AD730TM Ni-based superalloy at 850°C was related to a combination of the formation of Precipitate Free Zones (PFZ) in the vicinity of the grain boundaries (GBs) and microcracking assisted by oxidation. In addition, it was found that in the investigated temperature range, the PWHTed AD730TM had similar creep characteristics to UdimetTM720 Li and Inconel 738LC at low values of Larson Miller Parameter (LMP) and better creep properties than those of Inconel 617 alloy at higher LMP values.
Key Words: Linear friction welding; Ni-based superalloy; AD730TM; Dissolution and re-precipitation kinetics, Liquation temperature; Liquation mechanisms; Mechanical properties at elevated temperatures, Creep mechanisms
TABLE OF CONTENTS
Page
INTRODUCTION ...1
CHAPITRE 1 LITREATURE REVIEW AND RESEARCH METHODOLOGY ...3
1.1 Superalloys ...3
1.1.1. Composition–microstructure relationships in Ni-based superalloys ... 3
1.2 Linear Friction Welding ...5
1.2.1 Thermomechanical Analysis of the LFW Process ... 8
1.3 LFW of Superalloys ...9
1.3.1 Microstructure Evolution during LFW ... 10
1.3.2 Mechanical Properties after LFW ... 18
1.4 LFW of Ni-based Superalloys: State-of-the-art ...19
1.5 Objectives ...20
1.6 Materials and Methods ...21
1.6.1 Materials ... 21
1.6.2 Methods... 22
CHAPITRE 2 DETERMINATION OF OPTIMUM LINEAR FRICTION WELDING PROCESS PARAMETERS FOR AD730TM ALLOY ...25
2.1 Introduction ...25
2.2 Selection of the LFW Process Parameters ...26
2.2.1 Selection of Friction and Forge Pressures ... 26
2.2.2 Oscillation Frequency and Amplitude ... 32
2.2.3 Estimating the Heat Input ... 34
2.2.4 LFW Process Time ... 34
2.2.5 Estimating the Axial Shortening ... 36
2.3 Macrostructure ...38
2.3.1 Macroscopic Evaluation of the Joint after LFW ... 38
2.4 Microstructure ...41
2.4.1 Grain Refinement at the Weld Interface ... 41
2.4.2 γ´ Size and Volume Fraction Variation across the Weld ... 46
2.5 Mechanical Properties ...48
2.5.1 Microhardness Variation across the Weld ... 48
2.5.2 Mechanical Properties of as-welded and Post Weld Heat Treated (PWHTed) Samples ... 51
2.5.3 Conclusions ... 58
CHAPITRE 3 ARTICLE 1: COARSENING AND DISSOLUTION OF γ´ PRECIPITATES DURING SOLUTION TREATMENT OF AD730TM NI-BASED SUPERALLOY: MECHANISMS AND KINETICS MODELS ...65
3.2 Introduction ...66
3.3 Coarsening by agglomeration ...69
3.4 Experimental Procedure ...71
3.5 Results ...72
3.5.1 Characteristics of the As-Received Material ... 72
3.5.2 Thermo-calc ® Simulations ... 75
3.5.3 DTA Experiments ... 76
3.5.4 Dissolution Kinetics ... 77
3.5.5 Coarsening Kinetics Model ... 88
3.6 Discussion ...92
3.6.1 γ´ Precipitate Size Evolution after Short Exposure Time ... 92
3.6.2 γ´ Precipitate Size Evolution after Longer Holding Times ... 94
3.6.3 γ´ Precipitate Dissolution Mechanisms ... 100
3.7 Summary and Conclusions ...103
3.8 Acknowledgements ...104
CHAPITRE 4 ARTICLE 2: KINETICS AND MECHANISMS OF γ′ REPRECIPITATION IN A NI-BASED SUPERALLOY ...111
4.1 Abstract ...111
4.2 Introduction ...112
4.3 Precipitation Kinetics ...115
4.4 Experimental Procedure ...117
4.5 Results ...119
4.5.1 Continuous Cooling Precipitation from supersolvus Temperature ... 119
4.5.2 Precipitation during Discontinuous Cooling from Subsolvus Temperature ... 132
4.6 Discussion ...134
4.6.1 Analysis of DTA Data during the Heating Cycle ... 134
4.6.2 Effect of Cooling Rate on γ′ Stability during Growth ... 135
4.6.3 Multiple Precipitation during Cooling ... 140
4.7 Summary and Conclusion ...143
4.8 Acknowledgments...144
CHAPITRE 5 ARTICLE 3: ON THE OCCURRENCE OF LIQUATION DURING LINEAR FRICTION WELDING OF NI-BASED SUPERALLOYS ...151
5.1 Abstract ...151
5.2 Introduction ...152
5.3 Experimental Procedure ...154
5.4 Results and Discussion ...156
5.4.1 Macroscopic and Microscopic Examination of the Joint after LFW ... 156
5.4.2 Physical Simulation of the LFW Thermal Cycle ... 160
5.4.3 Prediction of Temperature in Different Zones of LFWed Sample ... 168
5.4.4 Possible Micromechanisms Controlling Diffusivity during LFW ... 173
5.6 Acknowledgments...181
CHAPITRE 6 ARTICLE 4: HIGH TEMPERATURE CREEP PROPERTIES OF A LINEAR FRICTION WELDED NEWLY DEVELOPED WROUGHT NI-BASED SUPERALLOY ...191
6.1 Abstract ...191
6.2 Introduction ...192
6.3 Experimental Procedures ...194
6.4 Results and Discussion ...196
6.4.1 Macroscopic and Microscopic Evaluation of the Joint after LFW ... 196
6.4.2 Creep Testing of PWHTed Joints at 700°C and 850°C ... 198
6.4.3 Effect of PWHT on Larson-Miller Diagram ... 202
6.4.4 Microstructure Analysis of PWHTed Joints ... 204
6.5 Conclusions ...214
6.6 Acknowledgement ...215
CONCLUSIONS ...221
RECOMMENDATIONS ...223
LIST OF TABLES
Page Table 1-1 Chemical composition and γꞌ volume fraction of AD730TM
compared to some other Ni-based superalloys (wt%) ...22 Table 2-1 Linear friction welding parameters determined and used for
AD730TM a Ni- based superalloy ...34 Table 2-2 Distribution of grain orientations from the base material to
the weld region of sample #4 ...42 Table 2-3 Room and elevated tensile properties ...54 Table 3-1 Chemical composition of AD730TM (wt%) (Devaux et al., 2012a) ...71 Table 3-2 Activation energies Q , frequency factors Do (Campbell, Boettinger et
Kattner, 2002) and calculated D for the diffusion of aluminium,
titanium and chromium in nickel ...81 Table 3-3 Dissolution kinetics and activation energies for various
solution treatments ...85 Table 4-1 Chemical composition of AD730TM (wt%) (Devaux et al., 2012c) ...118 Table 4-2 Values of phase transformations temperatures during cooling
for various cooling rates ...121 Table 4-3 The constants of kSC15(T) and kFC(T) equations for SC15 and FC
conditions, respectively ...126 Table 4-4 The results of optimizing kinetics models to the experimental
reprecipitation kinetics for SC15 and FC conditions and using optimized kSC15(T) and kFC(T) models for SC10 and IC conditions, respectively. For the optimized parameter k0(T), the mean absolute percentage error, MAPE, is given by Eq.(4.10. Additionally, the quality of the optimization is quantified by the mean
squared error, MSE (Eq.(4.9). ...127 Table 5-1 Chemical composition of AD730TM (wt%) (Devaux et al., 2012c) ...155 Table 5-2 Chemical composition of intermetallic constituents (wt%)
in the incipient melting zone at samples heated at a rate
Table 5-3 Temperature, pressure coefficients and material data for Ni alloys (Lesuer et al., 2001; Li et al., 2016; Milhet et al.,
2013; Wang et al., 2009) ...175 Table 6-1 Chemical composition of AD730TM (wt%) (Devaux et al., 2012a) ...194
LIST OF FIGURES
Page Figure 1.1 Two various attachments of blades and disk (Bhamji et al., 2011) ...5 Figure 1.2 Sample geometry, LFW process principles ...7 Figure 1.3 Schematic diagram of the parameter traces that are obtained
during LFW process (Bhamji et al., 2011) ...7 Figure 1.4 EBSD-based orientation maps showing the recrystallized
grains of weld line in LFWed CMSX-486 (Ola et al., 2012). ...12 Figure 1.5 TEM microstructure of a friction weld interface of Inconel 718
(Damodaram, Raman et Rao, 2013). ...13 Figure 1.6 Microhardness profile obtained across the weld of Inconel 718
(Damodaram, Raman et Rao, 2013). ...14 Figure 1.7 Vickers hardness profiles of Inconel 718, Alloy 720Li and
RR1000 inertia friction welds in the as-welded condition as a function of axial distance from the weld line (z = 0)
(Preuss, Withers et Baxter, 2006a). ...15 Figure 1.8 SEM micrographs of the TMAZ showing (a) intergranular and
(b) intragranular liquation and the presence of resolidified fine γ- γ′ eutectic products that formed from residual liquid during weld
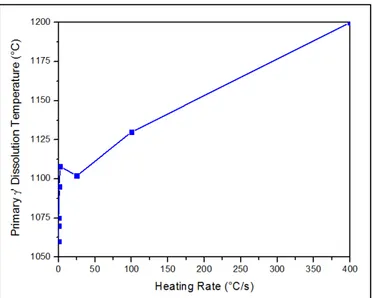
cooling (Ola et al., 2011b). ...17 Figure 2.1 Primary γ´ dissolution temperature of the AD730TM at different
heating rates. ...29 Figure 2.2 Peak stress values of the AD730TM and the other Ni-based
superalloys at strain rate 0.1s-1. ...30 Figure 2.3 Peak stress values of the AD730TM and the other Ni-based
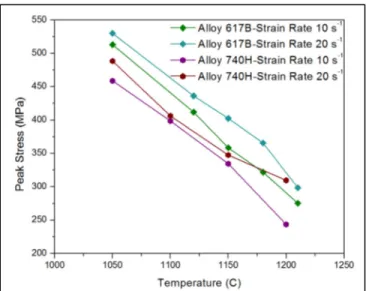
superalloys at strain rate 1s-1. ...30 Figure 2.4 Peak stress values of the various Ni-based superalloys
at strain rates 10 and 20s-1. ...32 Figure 2.5 Operating window for LFW
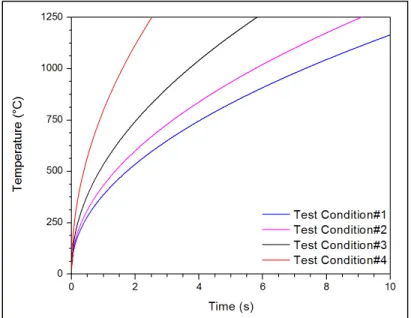
Figure 2.6 Temperature variation with time for different LFW
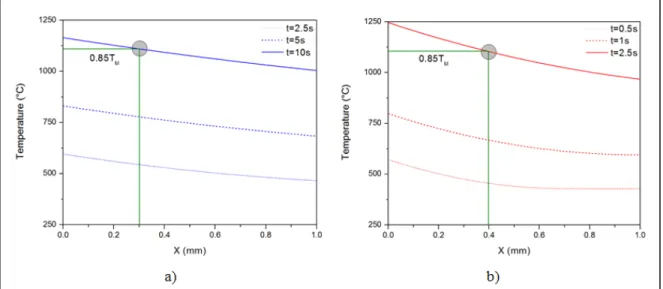
process parameters. ...36 Figure 2.7 Temperature distribution with various times along the x-axis
with (a) the lowest and (b) the highest heat input. ...37 Figure 2.8 Photographs of side views of the LFWed AD730TM joints.
Minimum flash is observed in the test condition #1 while
test conditions #3 and #4 present well-formed flash. ...38 Figure 2.9 Macrograph of the LFWed joints#1 and #4. Oxides are
forming similar to sinusoid or wavy shape at the weld interface in test condition #1(a) while uniform deformation is attained in test condtion#4(b). Higher magnification of red box is revealed in
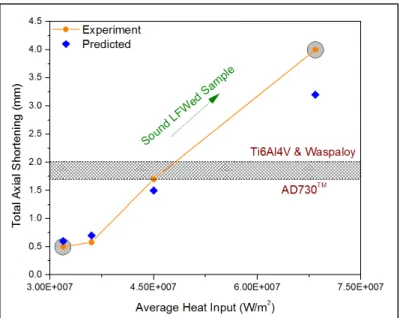
(c) where no voids or oxides are observed. ...40 Figure 2.10 Variation of axial shortening with the expected heat input. ...41 Figure 2.11 (a) EBSD map of the base material, (b) misorientation distribution
in the parent material. ...42 Figure 2.12 Low magnification EBSD map of the transversal cross section of the
LFWed sample#4. Red zones depict deformed areas and blue areas
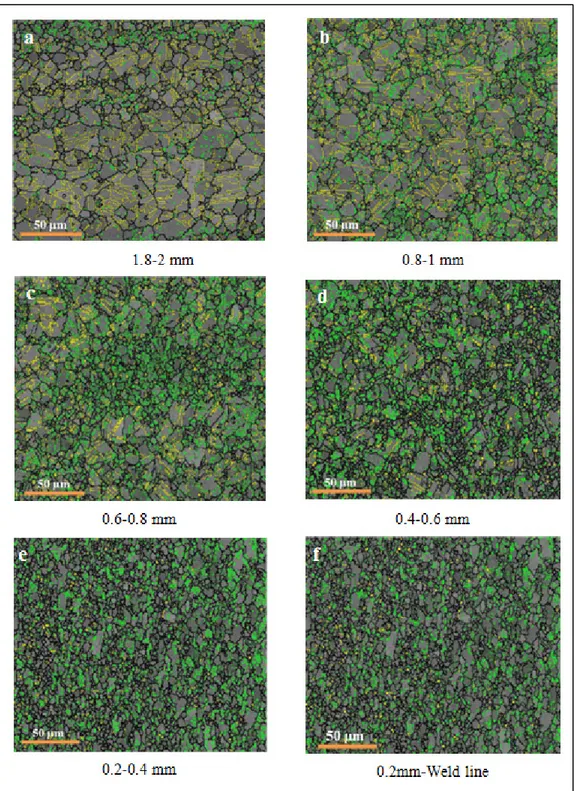
are undeformed zones. ...43 Figure 2.13 EBSD grain boundary maps showing microstructural changes of the
LFWed sample#4. (a) 1.8-2mm, (b) 0.8-1mm, (c) 0.6-0.8mm, (d) 0.4-0.6mm, (e) 0.2-0.4mm from the weld interface and (f) 0.2mm to weld line. In the maps, LABs, HABs and twin boundaries are depicted as green, black and yellow
lines, respectively. ...44 Figure 2.14 EBSD grain boundary map of the LFWed sample#4;
(a) 0.6 mm and (b) 0.2 mm from the weld interface showing grain
boundary bulging. ...45 Figure 2.15 (a) Misorientation distribution in weld zone(0-0.4mm),
TMAZ (0.6-0.8mm) and base metal (1.8-2mm) of the LFWed
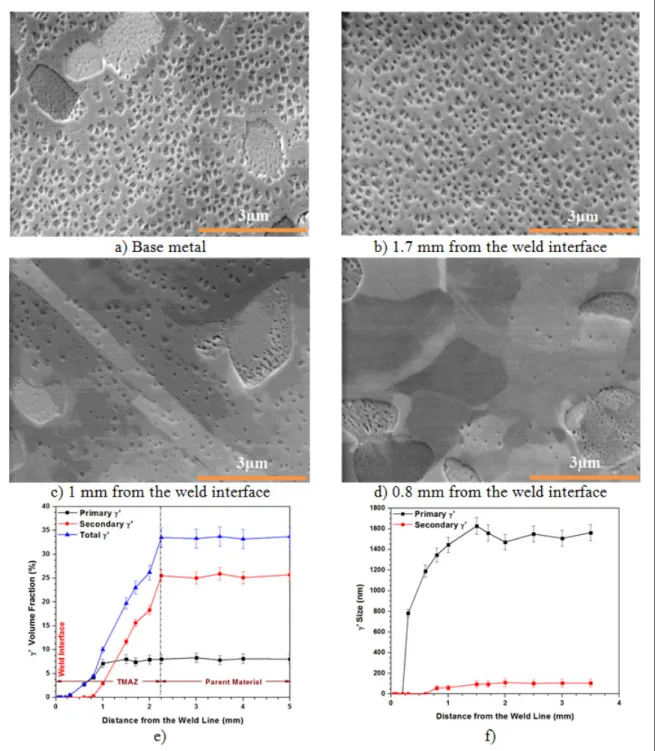
sample#4. (b) Higher magnification of (a). ...46 Figure 2.16 FEG-SEM images of γ´ precipitates in sample#4 (a) in the parent
material, (b) to (d) respectively at 1.7, 1, and 0.8mm from the weld interface. (e) Variation of γ´ volume fraction as a function of the distance from the weld interface. (f) Average γ´ size at various distances from the weld line. The standard deviations of the γ´
Figure 2.17 Variation in microhardness with distance from the weld line of LFWed samples produced at (a) low heat input with test condition #1 and (b) high heat input with test condition #4. The standard deviation of the microhardness measurement
is shown by error bars. ...49 Figure 2.18 EBSD grain boundary map of the LFWed sample#1 at
the weld interface. ...50 Figure 2.19 EBSD grain boundary map of the LFWed sample#4 after PWHT. ...52 Figure 2.20 Configuration of (a) tensile specimen inside LFWed sample and
(b) specimen geometry for tensile tests according to ASTM A370
standard (all dimensions are in mm). ...53 Figure 2.21 Fractured PWHT tensile samples of jonit#4 at room
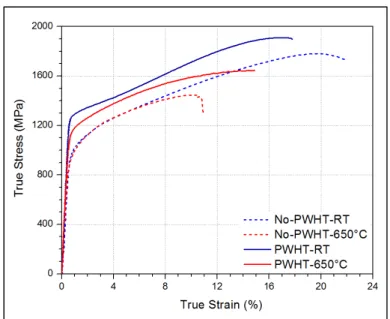
temperature (RT) and 650 °C. ...53 Figure 2.22 Stress-strain curves of the LFWed sample #4 before and after heat
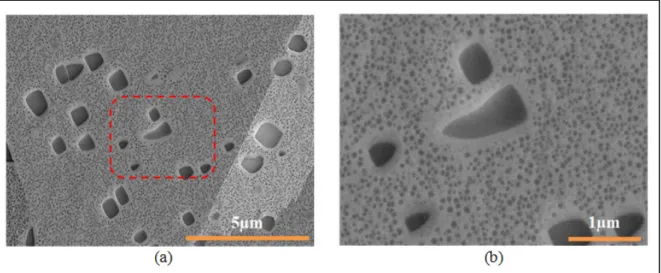
treatment. ...55 Figure 2.23 FEG-SEM images γꞌ particles of the LFWed sample #4 after PWHT
(a) at 1mm from the weld interface, (b) higher magnification of the
inset(red box) in (a). ...56 Figure 2.24 (a) Macrofractograph of the fractured surface at room temperature.
The central portion of the fracture is slightly flat and 45° shear lips surround this region. (b) Higher-magnification view of the selected area (red box) at the center of the specimen which consists of
equiaxed dimples formed during ductile rupture. ...57 Figure 2.25 (a) Macrofractograph of the fractured surface at 650°C. Shear lips
observed at 45° to the stress axis are indicated by black arrows. (b) Magnified view of a flat area from region A (inset in (a)). Ductile dimple rupture is the fracture mode. (c) Typical features of region B (inset in (a)) which consists of γ´ particles
(orange arrows) in the fracture surface. ...58 Figure 3.1 SEM microstructure of the as-received AD730TM superalloy
showing a) primary γ′ b) secondary and tertiary γ′. ...73 Figure 3.2 BSE/EDS X- ray maps of the (a) MC carbide mainly
consisting of Ti, Nb (b) M23C6 carbides mainly consisting
Figure 3.3 (a) and (b) Calculated equilibrium phase diagram of AD730TM superalloy representing the amounts of all phases between
400 and 1400°C...76 Figure 3.4 DTA curve at the 1°Cs-1 heating rate, showing three endothermic
reactions that occur during heating indicating tertiary (Peak A), secondary (Peak B) and primary γ′ (Peak C)
dissolution temperatures. ...77 Figure 3.5 Microstructure of solution treated samples at (a) 1080°C for
15min and (b) 1100°C for 15min, showing the occurrence of γ′ particles agglomeration (c) 1110°C for 15min and (d) 1110°C for
1.5min, showing γ′ particlesʼ dissolution. ...78 Figure 3.6 Evolution of average γ′ particle size as a function of time
at 1080, 1100 and1110°C. ...78 Figure 3.7 Denuded zones from the small precipitates around primary γ′
particles at 1080°C for 5 minutes at (a) lower magnification
(b) higher magnification. ...79 Figure 3.8 Comparison of the single γ′ precipitate dissolution kinetics at different
sizes at 1110°C indicating the influence of particle
size on dissolution rate. ...82 Figure 3.9 (a) Comparison of the multiple γ′ precipitate dissolution kinetics
at 1080, 1100 and1110°C (b) Schematic of the T95%. ...84 Figure 3.10 Comparison of the Al, Ti, Co and Cr concentration profiles
for large or primary (P) and small or secondary (S) γ′ particles
using EDS line map analysis. ...86 Figure 3.11 Comparison of experimental data and theoretical prediction of
γ′ surface fraction as a function of time at 1080 and 1100°C for low
heating rate heat treatments. ...88 Figure 3.12 Calculated equilibrium composition of (a) γ′ phase (b) γ phase, as a
function of temperature. ...91 Figure 3.13 Evolution of γ′ particle size distribution as a function of time at
(a) 1080°C (b) 1100°C (c) 1110°C. The plot indicates that dissolution occurs for the first 1.5 minutes and coarsening takes place after 30 minutes holding time at 1080 and 1100°C. For heat treatment
at 1110°C, only dissolution occurs at all holding times. ...93 Figure 3.14 Early stage of coalescence of two γ′ particles through diffuse neck
Figure 3.15 The fraction of γ′ particles interconnected by neck as a function of
holding time at 1080 and 1100°C. ...96 Figure 3.16 Mean precipitate radius cubed, r̅3, as a function of holding time at
1080 and 1100°C. Points represent experimental values and the regression line shows there is a reasonable linear relationship
(R2 >0.93) between r̅3 and t. ...98 Figure 3.17 Model predictions of γ′ precipitate radius as a function of aging
time at 700, 750 and 800°C based on Eq. (3.24). ...99 Figure 3.18 Various dissolution mechanisms a) Splitting (b) Dissolution from
center and corner (c) Dissolution in the form of layers of γ and γ′. ...101 Figure 3.19 Comparison of γ′ particle size distribution at 1080, 1100 and
1110°C for (a) 30 minutes holding time (b) 60 minutes holding time. The plot indicates that breaking and splitting of larger particles into smaller ones occurs during heat treatment
at 1110°C for 30 minutes holding time. ...102 Figure 4.1 DTA curves showing (a) γ′ dissolution and precipitation
peaks during heating for different heating rates (b) γ′ precipitation
peaks during cooling for various cooling rates. ...120 Figure 4.2 Amount of γ′ precipitation as a function of temperature for various
cooling rates showing the curves shift to lower temperatures with
increasing the cooling rate. ...122 Figure 4.3 γ′ precipitation rate as a function of temperature for various
cooling rates showing the shift of the maxima of the transformation rate curves to lower temperatures with increasing the cooling rate. ...122 Figure 4.4 The relationship between [− (1 − )] and at 1039°C for
determining Avrami exponent of γ′ precipitation (R2= 0.95). ...123 Figure 4.5 The relationship between ln ( / ) and 1000/ for
determining activation energies of γ′ precipitation (R2= 0.98). ...124 Figure 4.6 (a) Comparison between experimental data of DTA (solid lines) and
predictions by the non-isothermal JMA model (dashed lines) using developed k(T) function for SC15 and FC conditions (b) Validating developed equations of kSC15(T) and kFC(T) for SC10 and IC conditions, respectively. The error between the experimental
Figure 4.7 Scanning electron microscopy images of the (a) FC (b) IC (C) SC15 (d) SC10 samples, showing the morphology and size-scale of
first generation of γ′ precipitates. Some of protrusions are shown by arrows and their number, , was indicated inside some particle
core areas. ...129 Figure 4.8 Average diameter of first generation of γ′ precipitate as a function of
cooling rate (R2 =0.97). ...130 Figure 4.9 (a) Scanning electron microscopy image (b) Precipitate size
distribution plot of the Gleeble™ 3800 sample. ...130 Figure 4.10 BSE and SE images of the (a) SC10 (b) FC samples, respectively,
showing first and second population of cooling γ′ precipitates. ...131 Figure 4.11 Precipitate size distribution plot of SC10 sample showing the size
difference between the first and second population of cooling γ′
precipitates. ...131 Figure 4.12 Precipitate size distribution plot of (a) high interrupt temperature
(b) low interrupt temperature, from 1100ºC showing the size
difference between the first and second population of γ′ precipitates. ...132 Figure 4.13 Scanning electron microscopy image of the (a) first burst of
nucleation at high interrupt temperature (b) coarsening of first generation of γ′ and second burst of nucleation between initial primary and existing γ′ precipitates at low interrupt temperature. The interrupted cooling consisted of continuous cooling from 1100°C at a constant rate of 120°C/min, followed by water quenching at 1040°C (high interrupt temperature) or 780°C
(low interrupt temperature). ...133 Figure 4.14 The calculated variation of the critical precipitate radius with
supersaturation and schematic illustration of possible growth trajectories of spherical precipitates for SC10 (path-1) and
WQ (path-2). ...137 Figure 4.15 Scanning electron microscopy images showing the morphology evolution
of first generation of γ′ precipitates during various cooling rates. ...139 Figure 4.16 Nucleation of γ′ particles around initial primary γ′ at the γ grain
boundaries at high interrupt temperature indicating supersaturation is not uniform at the early stages when cooling from subsolvus
temperature. ...142 Figure 5.1 Processing phases and parameters during LFW of AD730TM. ...155
Figure 5.2 (a) A photograph of LFWed sample (b) a low magnification optical image of the welded sample showing oxide particles in flash 3, as shown by arrow (C) higher magnification of flash 1 and 2 (defined in (b)) showing formation of flashes with thickness 1.7 mm and height 3.3mm due to material flow, as shown by arrows, near
the LFW interface. ...158 Figure 5.3 Variation in γ′ volume fraction as a function of distance from the
weld interface. ...159 Figure 5.4 SEM micrographs of the: (a) flash (b) TMAZ at 500 µm from the
weld interface. No indication of liquation or γ/γ′ eutectic product
was observed at the γ/γ′ interface at the flash or TMAZ. ...159 Figure 5.5 SEM micrographs of Gleeble-simulated materials under rapid thermal
cycle (heating rate of 400K/s) and 3 s holing time at peak temperatures of : (a) 1423K (1150°C) and (b) 1493K (1220°C) showing the presence of some undissolved secondary γ′ particles at 1423K (1150°C)
(see zoom area in (a)) and primary γ′ particles at 1493K (1220°C)
(with only 0.4 % remained undissolved). ...161 Figure 5.6 SEM micrographs showing the formation of γ-γ′ eutectic at γ/γ′
interface after constitutional liquation of primary γ′ particle. Heating rate of 400K/s + 3 s holing time at 1473K (1200°C)
followed by compressed air cooling. ...163 Figure 5.7 a) SE/EDS X-ray maps of simulated material showing the formation
of γ-γ′ eutectic and Ni-Ti-Nb intermetallics close to Nb-Ti carboboride and Cr-Mo-W-Nb rich boride particles. b) EDX spectrum from
Ni-Nb-Ti intermetallic contain 32 % Ni, 20 % Ti, 14 % Nb, 4 % Al, 17% Cr, 7 % Zr, 3 % Mo, 1.8 % W. samples heated at a rate of
400K/s, 3 s holing time at peak temperature of 1493K (1220°C). ...165 Figure 5.8 a, b) SEM micrographs showing formation of γ-γ′ eutectic and
Ni-Ti-Nb intermetallic close to Nb-Ti carbide and Cr-Mo-W-Nb rich boride particles . Samples heated at a rate of 400K/s + 3 s holding
time at 1523K (1250°C), followed by air quench. ...166 Figure 5.9 SEM micrographs showing: (a) formation of Ni-Nb-Ti intermetallic
after sub-solidus incipient melting of boride and carbide particles, and (b) liquated grain boundary. Samples heated at a rate of 400K/s, held 3 s at 1573K (1300°C), followed by compressed air cooling. ...167 Figure 5.10 Comparison between predicted values using 1D analytical model
and measured (thermocouple or infrared camera) temperature distributions in locations near to the LFW line and for two |
different superalloys, Waspaloy and GH4169. Predicted temperature at one location is also compared with predicted
temperature by microstructure observation. ...170 Figure 5.11 SEM micrographs of (a) primary γ′ (b) secondary γ′ precipitates
at 2.5 mm from the weld interface. ...171 Figure 5.12 Diffusion distance, = √ , vs. time for lattice, pipe and total
diffusion coefficients at 1523K (1250°C) for LFWed
AD730TM superalloy. ...176 Figure 5.13 Diffusion distance, = √ , vs. time for lattice and pipe diffusion
coefficients at 1503K (1230°C) for LFWed IN738 superalloy. ...178 Figure 5.14 Comparison of diffusion distance, = √ , vs. time for total diffusion
coefficients at 1503K (1230°C) for LFWed AD730TM and IN738
superalloys. ...179 Figure 6.1 (a) A photograph of LFWed sample (b) a low magnification optical
image of the welded sample showing integrated joint with no defects or impurities in the weld line (c) higher magnification
of flash corner showing no microcracks or oxide particles. ...196 Figure 6.2 Microstructure of LFWed specimens in: (a) weld line in as-welded
condition (b) parent material and (c) weld zone (100 µm from the weld interface) in PWHTed condition. Primary (P), secondary (S) and tertiary (T) γ´ precipitates have been shown by white arrows. γ´ size distribution of the parent material and the weld zone after
PWHT are presented respectively in (b) and (c). ...197 Figure 6.3 Microstructure of a LFWed AD730TM at the weld line in:
(a) as-welded (b) post welded conditions. ...198 Figure 6.4 Creep curves of base material and LFWed specimens in as-welded
and PWHTed conditions at (a) & (b) & (c) 700°C under 600 MPa and 750 MPa (d) & (e) & (f) 850°C under 100 MPa and 200 MPa. Strain rate vs. strain data, shown in (b) & (c) & (e) & (f), are used to reveal various stages of creep tests. Shaded zone is magnified to indicate the absolute minimum of the curves, as shown
by filled circles. ...200 Figure 6.5 Appearance of the cross section of PWHTed samples after
rupture during creep tests at (a) 700°C / 600 MPa
Figure 6.6 Comparison of Larson Miller parameter (LMP) for (a) base metal, as-welded and PWHTed samples of AD730TM (b) PWHTed
AD730TM, U720Li, IN 738 LC and IN 617. ...202 Figure 6.7 Fracture surface of the creep tested specimen at 700°C under
600 MPa showing (a) parallel strips on flat fracture surface, as marked by black arrows (b) dimples and intergranular fracture (c) oxidized layer at the fracture surface, as marked by red arrow.
Transverse direction is shown by brown color. ...205 Figure 6.8 Post-failure observations on longitudinal cut from the creep
tested samples at 700°C/600 MPa showing (a) decohesion of primary γ′ (b) cavities and microcracks at GB (c) Cavities at
the interface of coarse secondary γ′. Longitudinal direction is shown by brown color. ...206 Figure 6.9 Post-failure transverse and longitudinal observations of the creep
tested specimen at 700°C /750 MPa test condition showing
(a) initiation of crack at parent material and propagation adjacent to the weld zone, at the thermomechanically affected zone (TMAZ) (b) and (c) crack initiation from oxidized secondary particle and intergranular fracture (e) and (f) pore nucleation at the primary γ′ and the matrix interface or at the junction of GB. Transverse and
longitudinal directions are shown by brown color. ...207 Figure 6.10 Transverse and longitudinal fracture surface of samples tested at
850°C under 100 MPa stress showing (a) necking (b) coalescence of voids at the center of the neck (c) and (d) PFZ formation and lamellar coarsening of γ′ particles, crack and cavity initiation in PFZ (e) chromium oxide particles. Transverse and longitudinal directions are shown by brown color. ...209 Figure 6.11 EDS mapping results and chemical analysis of the samples
tested at 850°C/100 MPa showing Chromium enrichment at the grain boundary. Longitudinal direction is shown by
brown color. ...211 Figure 6.12 Transverse and longitudinal observations of post-failure of samples
tested in 850°C under 200 MPa stress showing (a) parallel strips on flat fracture surface, as marked by white arrows (b) decohesion of grain due to crack connection (c) and (d) PFZ and cavity formation adjacent to GB. Transverse and longitudinal directions are shown by brown color. ...213
Figure 6.13 EDS mapping results of the creep tested specimen at 850°C/200 MPa showing oxide and crack formation at GB. Longitudinal direction is
LIST OF ABREVIATIONS
LFW Linear Friction Welding
SEM Scanning Electron Microscopy
EBSD Electron Backscatter Diffraction
TMAZ Thermo Mecanically Affected Zone
PWHT Post Weld Heat Treatment
HAZ Heat Affected Zone
PFZ Precipitate Free Zones
LMP Larson Miller Parameter
FSW Friction Stir Welding
WZ Weld Zone
DRX Dynamic Recrystallization
FEG-SEM Field Emission Gun Scanning Electron Microscopy
BSE Back Scattered Electron
LAB Low Angle Boundary
HAB High Angle Boundary
DTA Differential Thermal Analysis
EDS Energy Dispersive Spectroscopy
JMA Johnson Mehl Avrami
MAPE Mean Absolute Percentage Error
LIST OF SYMBOLS
Symbol Unit Description
MPa Shear strength
- Friction coefficient
and ℎ mm Width and height of the specimen
MPa Flow stress
- Strain s-1 Strain rate K Temperature ρ Kg.m-3 Density η - Thermal efficiency C J.Kg-1.K-1 Specific heat mm.s-1 Rubbing velocity mm Oscillation amplitude HZ Frequency W.m-1.K-1 Thermal diffusivity m2.s-1 Thermal conductivity W.m-2 Heat generation rate
mm Distance from the weld interface
. MPa Friction pressure
m2.s-1 Diffusion coefficient mm Initial precipitate radius
- Solute concentration in the matrix
- Equilibrium solute concentrations at the precipitate - Equilibrium solute concentrations at solid solution - γ′ area fraction
FSlim - γ′ area fraction at thermodynamic equilibrium
F1 - Difference between the γ′ area fraction at t=0 seconds
and FSlim
min Dissolution time
K Holding temperature
KJ.mol-1 Activation energy for the dissolution of the γ′ phase
K(°).s-1 Heating rate
K(°).s-1 Cooling rate
s Holding time
- Coarsening rate constant J.m-2 Interfacial free energy
m3 Molar volume of the γ′ precipitates J.mol-1.k-1 Gas constant
- Equilibrium concentration of the th solute element in
the γ matrix
- Distribution coefficient of the th solute element between the γ matrix and γ′ precipitates
INTRODUCTION
Ni-based superalloys have emerged as materials of choice for high temperature applications (above 800°C) in gas turbines in aerospace and power generation industries, when significant resistance to loading under static, fatigue and creep conditions is required (Reed, 2006b). Turbine discs and blades are two key components in gas turbines. Indeed, turbine blades are affected by high operation temperatures while high rotation speed imparts tensile stresses to both the turbine disc and blades. The development of new superalloys has therefore been motivated to increase efficiency by allowing higher operating temperatures. The cast and wrought (C&W) Ni-based superalloy, AD730TM, has been recently developed by Aubert & Duval, and introduced especially for the first stages of the turbine discs with high properties up to 700°C (Devaux et al., 2012b). However, many of its fundamental properties are still unknown. For example, no quantitative data is available on dissolution and reprecipitation kinetics in AD730TM.
In recent years, an emerging technology, LFW, has been developed for manufacturing and repair of aerospace components such as rotating gas turbine components. This technique has many advantages over traditional mechanical assembly process such as fir tree. For example, the weight is reduced, and the susceptibility to fatigue damages and initiation of fretting cracks from fir tree is decreased, and therefore, the service life is improved. In addition, it is economical to repair damaged blades tips by fusion welding rather than blade replacement. However, liquation and solidification which are often observed in fusion welded Ni-based superalloys has a deteriorating effect on mechanical properties of the welded components due to heat affected zone cracking. In this context, LFW can be an excellent alternative technique for the repair of damaged turbine disc and blades.
LFW is a solid state joining technique in which heat is generated by the reciprocal motion between a moving component and a stationary workpiece under compression loading. LFW is divided into three stages (Bhamji et al., 2011): I- conditioning stage: two parts to be joined are moving under specified frequency and amplitude, and brought together under small pressure; II- frictional stage: the friction pressure is increased. Thus, heat is increased due to
friction and sliding between the two parts. Plasticized material is expelled out of the weld interface due to applied friction pressure and high temperature, and axial shortening of the samples start to occur, and therefore, a flash is formed. III- forge stage: the amplitude is decreased to zero, and the workpieces are brought together while forge pressure is applied. The weld is consolidated and is strengthened at this stage.
This Ph.D. thesis begins with a comprehensive literature survey to review the state-of-the-art knowledge regarding linear friction welding of Ni-based superalloys. This chapter summarizes developments on manufacturing processes of gas turbine discs, and discusses different points of view about microstructure evolution of LFWed superlloys. Finally, an overview on the mechanical properties of LFWed samples is presented, the challenges are identified, and the objectives are defined. Based on these objectives, a methodology is proposed at the end of this section.
CHAPITRE 1
LITREATURE REVIEW AND RESEARCH METHODOLOGY
1.1
Superalloys
Superalloys were, and continue to be, developed for elevated temperature service. They are utilized at a higher proportion of their actual melting point than any other class of broadly commercial metallic material. They are divided into three classes, namely Ni-based superalloys, cobalt-based superalloys and iron-based superalloys (Sims, Stoloff et Hagel, 1987). Among them, the Ni-based superalloys are the most widely used for the hottest applications. In advanced aircraft engines, more than 50 percent of the weight comes from Ni-based superalloys. They are also used in power generation, chemical, and petroleum industries because of their superior mechanical properties and corrosion resistance at elevated temperature.
1.1.1. Composition–microstructure relationships in Ni-based superalloys
Most of the superalloys contain significant amounts of chromium, cobalt, aluminium and titanium. Small amounts of boron, zirconium and carbon are often included. Other elements that are added, but not to all alloys, include rhenium, tungsten, tantalum, hafnium, ruthenium, molybdenum, niobium and zirconium. Some superalloys, such as IN718 and IN706, contain significant proportions of iron, and should be referred to as nickel–iron superalloys. The first group of elements includes nickel, cobalt, iron, chromium, ruthenium, molybdenum, rhenium and tungsten; having atomic radii close to that of nickel, they prefer to partition to the austenitic γ and thereby stabilize it. A second group of elements, aluminum, titanium, niobium and tantalum, have greater atomic radii and promote the formation of ordered phases such as the compound Ni3(Al, Ta, Ti), known as γ′. Boron, carbon and zirconium constitute a third class that tends to segregate to the grain boundaries of the γ phase, on account of their atomic sizes, which are very different from that of nickel. Carbide and boride phases can also be promoted. Chromium, molybdenum, tungsten, niobium, tantalum and titanium are
particularly strong carbide formers; chromium and molybdenum promote the formation of borides (Reed, 2006b).
The microstructure of a typical Ni-based superalloy consists therefore of different phases, drawn from the following list (Reed, 2006b):
(i) The gamma phase, denoted γ has a face centered cubic, FCC, structure, and in nearly all cases, it forms a continuous matrix phase in which the other phases reside. It contains significant concentrations of elements such as cobalt, chromium, molybdenum, ruthenium and rhenium.
(ii) The gamma prime phase, denoted γ′ forms as a precipitate phase, which is often coherent with the γ -matrix, and rich in elements such as aluminum, titanium and tantalum. In nickel– iron superalloys and those rich in niobium, a related ordered phase, γ ̋, is preferentially formed instead of γ′.
(iii) Carbides and borides. Carbon, often present at concentrations up to 0.2 wt%, combines with reactive elements such as titanium, tantalum and hafnium to form MC carbides. During processing or service, these can decompose to other species, such as M23C6 and M6C (M=Cr, Mo, W), which prefer to reside at the γ - grain boundaries. Boron can combine with chromium or molybdenum to form borides which also reside at the γ - grain boundaries. Other phases can be found in certain superalloys, particularly in the service-aged condition, for example, the topologically close-packed (TCP) phases μ, σ, Laves, etc. However, these phases are deleterious to mechanical properties, and the compositions and processing of superalloys are selected to avoid, rather than to promote, the formation of these compounds. After the beneficial effects of the coherent phase γ′ in improving the strength properties of alloys at high temperatures were discovered (Durand-Charre, 1997; Reed, 2006b), more γ′ forming elements such as aluminium (Al), titanium (Ti), and tantalum (Ta) were added to the base composition to increase the proportions of γ′ in superalloys. The γ′ fraction of some single crystal superalloys can be as high as 70% (Murakumo et al., 2004). Some refractory metal additions, such as molybdenum, tungsten, and rhenium are also used in superalloys to provide additional strengthening through solid solution and carbide formation. In polycrystalline superalloys, boron and carbon are also added to form borides and carbides for
grain-boundary strengthening. In single-crystal superalloys, these elements are removed since there is no need for grain-boundary strengthening; instead, rhenium (Re) and ruthenium (Ru) gradually take greater roles in the development of new generations of single crystal superalloys.
1.2
Linear Friction Welding
Industrial and aircraft gas turbine engines are high technology products and their manufacturing processes involve various innovative techniques. Technological viability and manufacturing costs are the key factors in the successful development of new processes. In the turbine engines, ″blade″ and ″disk″ (BLISK) can be integrated by machining from a single forged part as a single piece for both compressor and turbine sections. However, this manufacturing technique is expensive for large BLISKs, and is not good for fabricating dissimilar blades and disk. Blades and disks can be attached mechanically (fir tree assembly); although damaged blades are easily replaceable, fatigue cracks initiate from the fir tree, and the weight of the part will increase due to the fir tree root. Figure 1.1 shows separated and integrated ″blade″ and ″disk″ in a typical gas turbine (Bhamji et al., 2011).
Figure 1.1 Two various attachments of blades and disk (Bhamji et al., 2011)
Recent developments have led to emerging LFW technology. The major commercial use of LFW is for the joining of aeroengine compressor blades to compressor discs to form blisks. As a result, much of the published literature on the subject has focused on the joining of materials for aeroengine applications. To this end, a range of titanium alloys and Ni-based superalloys have been studied for understanding the influence of LFW process parameters on the microstructural characteristics and mechanical performance. However, the process can be used to join other materials and interest in this aspect is growing. The application of LFW has greatly extended the commercial potential of conventional frictional welding techniques since non-round and round parts can be joined with precise angular alignment (Nicholas et Thomas, 1998).
Friction welding is classified as a solid state welding process, in which joining occurs at a temperature below the melting point of the work metal. If incipient melting does occur, there is no evidence in the finished weld, because the metal is worked during the welding stage (Bhamji et al., 2011).
In LFW, an imposed linear reversing motion of the two surfaces to be joined generates frictional heat and plasticizes the material at the weld interface (Figure 1.2). When adequate heat and metal flow has been reached, the moving part is brought into alignment with the stationary one while the axial load is maintained or increased to finalize the weld sequence. Material, including surface oxides, are expelled from the interface as “flash” and a Thermo-Mechanically Affected Zone (TMAZ) expands from the interface into the parent material (McAndrew et al., 2018). LFW has three main stages: Conditioning, Frictional and Forge (Bhamji et al., 2011; Vairis et Frost, 2000a).
Figure 1.2 Sample geometry, LFW process principles
I) Conditioning Phase
Oscillation of one of the parts is increased and stabilized over a set period (usually very quickly) and the parts are brought together under a small force for a predetermined time (Figure 1.3).
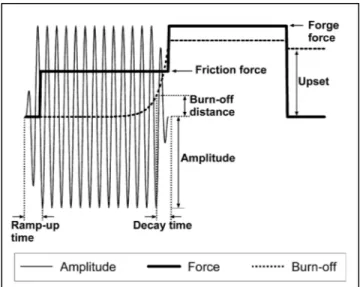
Figure 1.3 Schematic diagram of the parameter traces that are obtained during LFW
II) Frictional Phase
The compressive force (friction force) is increased to a set level and heat is generated at the interface. The material at the interface becomes plastic and flows out of the weld, as flash, because of the shearing motion between the two parts and the applied force. This loss of material from the weld causes the parts to shorten (or burn-off). This phase usually ends, and the next is triggered, when a predetermined loss of length, or burn-off distance, is reached. However, the next phase can also be triggered after the frictional phase has continued for a predetermined time (burn-off time) or a number of oscillation cycles (burn-off cycles). The LFW process is always carried out under load control, but other parameters also play a role in controlling the welding process. For example, when using a burn-off distance the load is controlled throughout the welding process, however, the burn-off is also monitored (although not controlled) and at a set burn-off distance, the next phase (forge phase) is triggered. Similarly with burn-off time or cycles the load is controlled throughout welding and the amount of time or cycles determines the transition to the next phase.
III) Forge Phase
The last phase is known as the deceleration or forge phase. The amplitude is decayed to zero over a predetermined time to ensure good alignment (usually very quickly). In other words, the materials are brought to rest after the desired shortening has been attained. Once the materials have been brought to rest and aligned, the axial pressure is increased and held for a set time until the weld is consolidated.
1.2.1 Thermomechanical Analysis of the LFW Process
As the solid surfaces rub against each other, heat is generated as a result of friction. The heat generated due to friction subsequently diffuses through the bulk of the contacting solid materials. Varis and Frost (1998; 1999b; 2000a) calculated the rate of heat generation during LFW by considering two solid objects with flat surfaces while pressed together with a friction pressure P and sliding against each other with a relative velocity of V:
= (1.1)
where μ is the friction coefficient. If the contact area is A, the rate of thermal energy generation per unit area becomes:
= = (1.2)
Frictional heating along with the applied pressure increases temperature at the interface and plasticizes the material. The parent material cannot be melted by this frictional heat.
Varis and Frost (1998; 1999b; 2000a) proposed the following equation for the average friction heat rate:
= 2 (1.3)
where α and ω are the amplitude and the oscillation angular velocity. Thus, the main input parameters during LFW process are:
- Frequency (f): Number of oscillatory cycles per second,
- Amplitude (α): Maximum displacement of the oscillating sample from its equilibrium position,
- Friction Pressure (P .): Pressure applied during the friction stage, - Forge Pressure (P .): Pressure applied during the forge stage.
By choosing appropriate LFW process parameters, a sufficient heat can be generated, oxides and other impurities could be expelled as flash, and a defect free joint with a narrow heat affected zone (HAZ) could be formed.
1.3
LFW of Superalloys
Very little has been published on LFW of Ni-based superalloys (Chamanfar et al., 2011a; 2012a; Dalgaard et al., 2012; Ola et al., 2011a; Ola et al., 2012). The few reported
publications have been focused on LFW of Ti alloys (Dalgaard et al., 2012; McAndrew et al., 2018). While fusion welding is an economical joining technique for the fabrication and repair of service-damaged Ni-based superalloy turbine parts; their poor weldability limits the application of welded components in critical structure locations. The alloys, particularly, those with high-volume fraction of the γ′ phase (>40%) are highly susceptible to intergranular microcracking during conventional welding processes. The fundamental cause of the weldability problem in these alloys is the liquation of grain boundary region, which weakens the material during joining (Rowe, Ishwar et Klarstrom, 2006). Developments in welding research have resulted in the use of solid-state friction joining processes (Henderson et al., 2004; Korsunsky et al., 2009). These include Friction Stir Welding (FSW), friction spot welding, inertia friction welding, continuous drive friction welding and LFW, which are state of- the-art in producing crack-free welds in difficult-to-weld structural alloys. Studies have shown that, in particular, LFW is potentially well-suited for joining highly crack-susceptible Ni-based superalloys (Karadge et al., 2008). Currently, there is active on-going research on effective and efficient industrial utilization of this technique in the manufacturing of aero-engine components like turbine discs and blades (Vairis et Frost, 1998).
1.3.1 Microstructure Evolution during LFW
Since the mechanical properties of superalloys strongly depend on their microstructure, and its widespread industrial applications, it is necessary to understand microstructural evolution with time, temperature and deformation during LFW to optimize the friction welding process.
Although the interface temperature during LFW is not expected to exceed the melting temperature of the materials being welded, the peak interface temperature is nevertheless very high, and could be close to the solidus temperature of the material (Mary et Jahazi, 2007a). In all reported cases, this high temperature, along with the applied pressure, cause significant microstructural variations at the weld interface and its neighboring region. These changes in microstructure are summarized in the following sections.
1.3.1.1 Microscopic Features of LFW
No widely accepted nomenclature exists for microstructural regions in linear friction welds. The following nomenclature that has received widespread acceptance for friction stir welds is also used for LFW (Threadgill, 2007). The weld is divided into four regions:
Parent material (PM): This region corresponds to the base material, where no change in microstructure, mechanical properties or other properties can be detected.
Heat-affected zone (HAZ): In this region, the microstructure and/or other properties have been changed by heat from the weld, but there is no optically visible plastic deformation. Changes could, for example, include one or more of grain growth, precipitate morphology, mechanical or physical properties.
Thermo-mechanically affected zone (TMAZ): In this region, the material has been subjected to more heat than in the HAZ and shows clear evidence of plastic deformation. Phase transformation could also take place in some materials in this zone. Changes in this region would be expected to be more apparent than in HAZ. Weld zone (WZ): In many materials there will be a region close to the weld line
where the microstructure is very different to that in other parts of the weld due to recrystallization, phase transformation, etc. As this area has been subjected to severe heat and plastic flow, it is a sub-group of the TMAZ.
I) Occurrence of Recrystallization
It is suggested that recrystallization occurs dynamically in linear friction welded poly-crystal to poly-crystal and single crystal to single crystal Ni-based superalloy, due to the thermomechanical conditions imposed during friction welding, namely, the combination of high strain and strain rates at elevated temperatures (Chamanfar et al., 2011a; Ola et al., 2012). The recrystallization behavior in the weld zone of linear friction welded CMSX-486 is notable, in that finer (smaller) grains are present at the weld centerline area (Figure 1.4) compared to other weld zone areas away from the centerline, where the grains are more than 5 times greater (Ola et al., 2012). LFW has many similarities with hot deformation processes, and can be compared with hot forging. Hot deformation of IN-718 induces competitive mechanisms of strain hardening, dynamic recovery and recrystallization. During
the first steps of hot deformation, the main phenomena are usually linked to energy storage and strain hardening. As strain increases, dislocations rearrange themselves into sub-boundaries that progressively divide them into finer grains. This phenomenon is called grain fragmentation and is followed by the nucleation of the first recrystallized grains. Through nucleation and grain boundary migration, the recrystallized microstructure progresses (Thomas, Montheillet et Dumont, 2003).
Figure 1.4 EBSD-based orientation maps showing the recrystallized grains of weld line
in LFWed CMSX-486 (Ola et al., 2012). II) γ´ Evolution
As the temperatures experienced during LFW are above the solvus temperatures of the strengthening precipitates, dissolution of the precipitates can occur in the weld zone and TMAZ/HAZ (Chamanfar et al., 2011a; Ola et al., 2012). Under equilibrium conditions, both coarse and fine γ´ precipitates start to dissolve as the temperature increases due to the diffusion of γ´ forming elements (Al and Ti) into the surrounding γ matrix. Therefore, above γ´ solvus temperature, full γ´ dissolution can occur. However, the rapid heating cycle experienced by the material during LFW is far from equilibrium conditions, and therefore, no significant diffusion of the γ´ forming elements occurs. Hence, probably only very fine γ´ particles dissolve and the coarse ones most likely remain intact. However, for linear but
mostly inertia friction welded Ni-based superalloys, during cooling from solvus temperatures, two types of γ´ evolution trends have been reported. (Chamanfar et al., 2011a; Damodaram, Raman et Rao, 2013; Huang et al., 2007a; Mary et Jahazi, 2007a; Preuss et al., 2002a; Preuss, Withers et Baxter, 2006a)
In alloys with low γ´ volume fraction, such as Inconel 718 or Waspaloy, γ´ completely dissolves in the vicinity of the weld line during friction welding and, does not reprecipitate during cooling (Figure 1.5) (Chamanfar et al., 2011a; Damodaram, Raman et Rao, 2013; Huang et al., 2007a; Mary et Jahazi, 2007a; Preuss et al., 2002a; Preuss, Withers et Baxter, 2006a). In these alloys, in the as-welded condition, the microhardness of the weld zone of the sample with prior solution treatment (ST) was found to be higher than that of its base material counterpart. The increase in hardness of the ST sample in the weld zone was attributed to grain refinement due to dynamic recrystallization. However, in the case of the sample with prior solution treatment followed by aging (STA) condition, the hardness of the weld zone was lower than that of the base material (Figure 1.6). This can be attributed to the dissolution of γ´ precipitates as the temperature reached in the weld zone was found to be above the γ´ solvus temperature (Damodaram, Raman et Rao, 2013).
Figure 1.5 TEM microstructure of a friction weld interface of Inconel 718
Figure 1.6 Microhardness profile obtained across the weld of Inconel 718
(Damodaram, Raman et Rao, 2013).
In contrast, in alloys with high γ´ volume fraction such as Astroloy and Udimet-720 Li and RR1000, close to the weld line, large amounts of dissolved γ´ reprecipitate during cooling. In these alloys, due to the high levels of Ti and Al, the driving force for reprecipitation during fast cooling is large. Preuss et al. (2002a) reported that at 1mm from the weld line only partial dissolution of γ´ has taken place during welding. Therefore, it can be assumed that the driving force for reprecipitation is larger at the weld line than 1mm from it. The high level of γ´ close to the weld line in these alloys is reflected in relatively high hardness values in this region (Figure 1.7) (Preuss, Withers et Baxter, 2006a).
Figure 1.7 Vickers hardness profiles of Inconel 718, Alloy 720Li and RR1000 inertia friction welds in the as-welded condition as a function of axial distance
from the weld line (z = 0) (Preuss, Withers et Baxter, 2006a). 1.3.1.2 Liquation and Microcracking during LFW
The necessary pre-conditions for the occurrence of liquation cracking include grain boundary liquation (a continuous film of liquid) and the existence of tensile stresses along the relatively weak wetted grain boundary. As a result, analysis of the microstructural changes during linear friction welding is really important. Ola et.al (2011a; 2011b; 2012) proposed a model to describe nonequilibrium dissolution behavior of the precipitates during rapid heating conditions. They showed that grain boundary liquation occurs during linear friction welding of IN 738 (Figure 1.8) as a result of nonequilibrium phase reaction between γ′ particles and the surrounding γ matrix. Using Gleeble testing, they observed interdendritic liquated areas at all temperatures above 1423 K (1150°C). This newly formed fine eutectic product consisted of a major phase that chemically appeared to be based on Ni5Hf intermetallic with a melting point around 1150°C. A similar type of resolidified fine eutectic microconstituent was also observed in TMAZ interdendritic regions of a LFWed joint. Microscopic examinations showed that the morphology and chemical composition of the liquated phase was similar to the Ni5Hf phase observed after Gleeble tests.