Transboundary Movement of Waste: Second-hand Markets and Illegal Shipments
29
0
0
Texte intégral
(2) CIRANO Le CIRANO est un organisme sans but lucratif constitué en vertu de la Loi des compagnies du Québec. Le financement de son infrastructure et de ses activités de recherche provient des cotisations de ses organisations-membres, d’une subvention d’infrastructure du Ministère du Développement économique et régional et de la Recherche, de même que des subventions et mandats obtenus par ses équipes de recherche. CIRANO is a private non-profit organization incorporated under the Québec Companies Act. Its infrastructure and research activities are funded through fees paid by member organizations, an infrastructure grant from the Ministère du Développement économique et régional et de la Recherche, and grants and research mandates obtained by its research teams. Les partenaires du CIRANO Partenaire majeur Ministère du Développement économique, de l’Innovation et de l’Exportation Partenaires corporatifs Autorité des marchés financiers Banque de développement du Canada Banque du Canada Banque Laurentienne du Canada Banque Nationale du Canada Banque Royale du Canada Banque Scotia Bell Canada BMO Groupe financier Caisse de dépôt et placement du Québec CSST Fédération des caisses Desjardins du Québec Financière Sun Life, Québec Gaz Métro Hydro-Québec Industrie Canada Investissements PSP Ministère des Finances du Québec Power Corporation du Canada Rio Tinto Alcan State Street Global Advisors Transat A.T. Ville de Montréal Partenaires universitaires École Polytechnique de Montréal HEC Montréal McGill University Université Concordia Université de Montréal Université de Sherbrooke Université du Québec Université du Québec à Montréal Université Laval Le CIRANO collabore avec de nombreux centres et chaires de recherche universitaires dont on peut consulter la liste sur son site web. Les cahiers de la série scientifique (CS) visent à rendre accessibles des résultats de recherche effectuée au CIRANO afin de susciter échanges et commentaires. Ces cahiers sont écrits dans le style des publications scientifiques. Les idées et les opinions émises sont sous l’unique responsabilité des auteurs et ne représentent pas nécessairement les positions du CIRANO ou de ses partenaires. This paper presents research carried out at CIRANO and aims at encouraging discussion and comment. The observations and viewpoints expressed are the sole responsibility of the authors. They do not necessarily represent positions of CIRANO or its partners.. ISSN 1198-8177. Partenaire financier.
(3) Transboundary Movement of Waste: Second-hand Markets and Illegal Shipments * Sophie Bernard†. Résumé / Abstract In a stylized model of international trade, firms in the North indirectly export second-hand products to a representative firm in the South to be reused as intermediate goods, with potential trade gains. The level of reusability of waste products is a crucial choice variable in the North. This is because, in the presence of imperfect international monitoring, non-reusable waste can be illegally mixed with reusable waste. I explore the driving forces for illegal waste movement, with a particular focus on local waste regulations such as the EU’s Directive on Waste Electrical and Electronic Equipment.. Under mild conditions, it is shown that increasingly stringent regulations in the North induce Northern firms to reduce product reusability. Consequently, the flow of non-reusable waste to the South increases, magnifying the pollution haven effect.. Mots clés : waste, second-hand products, environmental regulations, trade, green design, illegal market.. Codes JEL: F18, L10, O13, Q53, Q56. *. Research partly supported by the FQRSC (Fonds québécois de recherche sur la société et la culture) and Région Île-de-France. † Departement of Mathematics and Industrial Engineering, École Polytechnique Montréal, C.P. 6079, Succ.Centre-ville, Montréal (Qc), H3C 3A7, Canada. Tel.:+15143404711x5861, fax:+15143404173. Email address: sophie.bernard@polymtl.ca..
(4) 1. 1. Introduction. Using a North–South model, this paper analyzes the impact of extended producer responsibility (EPR) programs on the environment and illegal waste shipments when EPR programs may also a¤ect …rms’incentive for green design. The scarcity of traditional land…ll capacity combined with growing amounts of postconsumer waste has become a major concern for industrialized countries. Waste reuse has been proposed as a solution. Accordingly, governments have recently introduced new regulations, called extended producer responsibility (EPR) regulations, which make producers accountable for waste disposal costs and establish recycling and reuse objectives. The European Union’s directives on Waste Electrical and Electronic Equipment (WEEE) and End of Life Vehicle (ELV), introduced in 2005 and 2006, are examples. Waste moves naturally from developed to less developed countries. A driving force for these transboundary shipments is the di¤erence in treatment and disposal costs between the North and South, explained by both the disparity in local waste regulations and the labor intensity of waste reuse industries. In particular, EPR programs implemented in rich countries confer a comparative advantage on …rms in developing economies, where waste regulations are less stringent. The North–South movement of waste is also demand-driven. In developed countries, the demand for second-hand goods is often low due to technological obsolescence or regulations (e.g., technical inspections in many European countries that ensure that vehicles in poor condition must be taken o¤ the road). The wealth gap between industrialized and industrializing economies explains the greater demand in developing countries for many types of e-waste, used vehicles,1 and recycled materials [Janischweski et al. 2003, Beukering and Bouman 2001]. Two important sets of regulations govern transboundary waste movement. Both the Basel 1. Janischweski et al. (2003) showed that countries in East and West Africa import more second-hand vehicles than new ones. These cars are of a particularly poor quality, and are often more than 15 years old..
(5) 2 Convention and the EU regulations restrict waste shipments and disposal. Non-OECD countries often have low-cost, albeit environmentally inadequate, facilities. For instance, exported e-waste often ends up incinerated in open …res, an unsafe practice for both the environment and human health [EEA 2009]. Under the above-cited international regulations, exporting hazardous waste from OECD to non-OECD countries is prohibited.2 The hazardous content of e-waste and end-of-life vehicles justi…es trade restrictions in these markets. In order to minimize the cost of complying with EPR programs, …rms may undertake both legal and illegal3 waste shipments. In her investigation of this market, New York Times reporter Elisabeth Rosenthal (September 27, 2009) reported that, according to expert estimates, about 16% of exports are illegal. She also emphasized that the fewer restrictions on waste exported from the United States and Canada produce a larger ‡ow of waste that is legally exported to developing countries. Other sources say that illegal shipments reported by non-OECD countries amount to 22,000 tonnes per year on average, or 0.2% of all noti…ed waste [EEA 2009]. These illegal activities take di¤erent forms: transporting waste on the black market, mixing di¤erent types of waste, or declaring hazardous waste as non-hazardous. This study focuses on yet another illegal practice: classifying waste as second-hand goods. When products are classi…ed as second-hand goods, they are no longer governed by international waste regulations, and can be traded to developing countries. Yoshida and Terazono (2010) analyzed the reuse of second-hand TVs in the Philippines. Their survey of 113 Filipino consumers showed that around 40% of TVs exported from the EU were defective. They proposed that a systematic electrical testing would reduce by approximately half the shipment of second-hand EEE. These bads turned into goods constitute an economic incentive for misclassi…cation. For instance, it costs about £ 5 to recycle a ‘visibly undamaged’ PC monitor in the UK, whereas traders are willing to pay up to £ 3 on the international 2. Under the Basel Convention, the so-called Ban Amendment comes into force on a voluntary basis. Rati…cation by 17 additional parties is needed for the Amendment to enter into force. 3 The US imposes fewer restrictions on waste exports than Europe because it did not ratify the Basel Convention. Consequently, US waste shipments are generally legal..
(6) 3 market [Czarnomski and Webb 2006]. Authorities from developing countries can also turn a blind eye to these illegal markets. Reluctant to strengthen monitoring, they prefer to protect the imported waste business and the labor market it generates [Yardley, April 23, 2010]. Several used-good market characteristics testify to imperfect international monitoring. The …rst is that second-hand goods appear to be a one-size-…ts-all category for recyclable, remanufacturable, and second-hand products. Owing to this institutional ambiguity, authorities and enforcement agencies can misclassify waste as used goods [Fischer et al. 2008]. Such misclassi…cations have been observed for e-waste and used vehicles4 [Czarnomski et al. 2006 and Janischweski et al. 2003], as well as used clothes, car tires, and other types of waste [Fischer et al. 2008]. Another outcome of imperfect monitoring is that many used products are traded alongside new products, which makes it hard to keep track. One way to assess the scale of these markets is to compare prices. For instance, the average price for all television sets exported from Europe is 339e, but the price drops to 28e when they are exported to Nigeria, Ghana, or Egypt (where more than 1,000 used television sets arrive daily) [EEA 2009]. This lack of precision makes it di¢ cult to conduct an accurate market analysis on either waste or used goods [EEA 2009]. The US and India, as well as other countries, led the discussions during the Doha Round. They wanted the World Trade Organization (WTO) to undertake initiatives to regulate the movement of used products. Today, the WTO has only a draft version of the proposed legislation, which recommends banning the import of used products. Consequently, developed countries can envisage a shrinking market for their used products.5 However, with the 4 Czarnomski et al. (2006) observed that a signi…cant amount of what is considered WEEE in OECD countries is illegally exported to West Africa as second-hand goods. In addition, Janischweski et al. (2003) noted that transactions where vehicles exported in ‘top condition’ turn out to be ‘cars without an engine’ are so common that they call it the Lemon Rule. 5 Whereas some countries forbid the import of used goods, others apply prohibitive tari¤s. Uganda quali…es used goods as ‘sensitive,’ and applies an extra 55% tari¤ on top of the usual 25% external tari¤..
(7) 4 appropriate regulations, a liberalized trade in used goods would result in potential gains, as argued by Clerides (2008). The present paper examines the e¤ect of more stringent waste regulations, or higher disposal costs, in the presence of an international second-hand goods market. In a stylized North–South model, a representative …rm in the South can purchase second-hand products from a …rm in the North as intermediate goods. Due to imperfect monitoring, illegal shipments of non-reusable waste are mixed with the exported goods. The model explores the driving forces of illegal waste movement, with a focus on di¤erences in local disposal costs. The impact of improved international monitoring is also considered. In this model, …rms must adhere to an EPR program such as the WEEE directive. In order to comply with the WEEE directive, producers can join one of the producer responsibility organizations (PROs).6 PROs are non-pro…t, government-recognized consortia that collect and manage end-of-life products. The management and waste disposal costs are charged to producers according to the contract between the PRO and the member producers. Products are divided into categories (e.g., small appliances weighing less than 25 grams, mobile phones, PC monitors greater than 32 inches in size), and the price for each end-of-life product is the average management cost for its category. If a goods category bene…ts from export revenues, for instance in a second-hand market, the net management cost is reduced, along with the price charged to the producers. Members are either owners or stockholders of the PROs. Decisions on the classi…cation of waste as second-hand products are centralized at the PRO level. One rationale behind EPR programs is that by internalizing the cost of waste disposal, …rms will choose greener designs in order to improve reusability. Walls (2006) studied the (See www.allafrica.com, 12 February 2009). 6 For instance, in France, Eco-systèmes groups over 30 stockholders, including LG, Moulinex, Philips, and Samsung (see www.eco-systemes.com), while the European Recycling Platform was founded by Braun, Electrolux, HP, and Sony (see www.erp-recycling.org). The remaining two are Ecologic (see www.ecologicfrance.com) and Recylum (www.recylum.com). Recylum deals with used lamps only..
(8) 5 impact of EPR on product design. She found that collective take-back programs involving consortia such as PROs may not provide enough incentive to spur greener design. Although they might require closer monitoring, individual programs where producers are responsible for their own end-of-life products would be more e¤ective in this sense. Walls also reported the case of Braun, Electrolux, HP, and Sony, who founded their own PRO, whereby the four producers bene…t from scale economies while avoiding problems related to collective actions. The type of signed contract between producers and the PRO is a key determinant for green design. In France, prior to 2009, PROs did not di¤erentiate between di¤erent levels of reusability across products within each waste category. This type of contract provided little incentive for green design, because any additional revenue resulting from individual e¤orts toward greener design was redistributed to all the producers. Since 2009, PROs must encourage EEE producers to invest in green design in order to improve product recyclability, lifetime, and reusability [Grenelle 1 law, article 41, 2009]. Now, contracts propose a price schedule according to product di¤erentiation (green-designed versus non green-designed). However, in the EEE sector, product di¤erentiation can be costly. A third type of contract has been discussed, and might emerge in the near future. In this contract, producers would be encouraged to collude through the PRO in order to determine a standard level of reusability. This ‘legislated’ collusion evokes the 1993 National Cooperative Research and Production Act in the US, which promotes innovation and R&D. The present paper discusses the impact of EPR programs on green design, and more precisely, on the level of reusability. In the model, incentives for green design stem from either a legislated collusion under the PRO or the small number of …rms (as mentioned above by Walls in the case of Braun, Electrolux, HP, and Sony). The pollution haven hypothesis (PHH) stipulates that larger di¤erences in environmental regulations between two countries induce polluting industries to delocalize where the standards are weak. As predicted by this hypothesis, results show that in the absence of green-design incentives, a greater di¤erence in environmental standards between the North and South causes a greater.
(9) 6 ‡ow of waste toward the laxest country. When green-design incentives are introduced, the outcomes depend on the sign and amplitude of the incentives, which in turn depend on the initial di¤erence in standards. In particular, if there is a small initial di¤erence, then the tightening of the regulations in the North (i.e., the increased di¤erence in standards between the two countries) stimulates green design, reduces illegal shipments, and reduces pollution in the South, thereby contradicting the PHH. However, a large di¤erence in waste treatment costs between the South and North can induce …rms in the North to reduce reusability in response to more stringent environmental regulations. This counterintuitive behaviour exacerbates the pollution haven e¤ect. Increased international monitoring leads to similar results, depending on the …rms’ green-design response. The model underscores how more stringent environmental regulations or international monitoring that ignore the impact on green design can have adverse consequences on the environment and illegal shipments. The literature on EPR programs has grown substantially in recent years.7 For instance, Runkel (2003) studied the in‡uence of four instruments on product durability and welfare. Similarly to the current model, Runkel recognized the potential impact of EPR on green design. He also explored di¤erent competitive environments and showed that EPR programs applied under imperfect competition can lead to reduced welfare. Fleckinger and Glachant (2010) are concerned with the fact that these programs are designed precisely for producers to ful…ll their obligations as they see …t. They examined a duopoly of producers and compared scenarios where producers managed their waste on their own or colluded through a PRO. They concluded that this type of collusion could lead to suboptimal outcomes, justifying government intervention. The EPR literature has largely neglected the international dimension. One objective of this paper was therefore to explore the impact of EPR on trade in waste and used products. Few authors have studied the trade in waste and used products. From a theoretical perspective, Copeland (1991) studied international trade in waste disposal services. He found 7. In addition to Walls (2006), see for instance OECD (2004) and Ino (2007)..
(10) 7 that in the presence of local illegal waste disposal, trade restrictions may improve welfare. Kinnaman and Yokoo (2011) proposed a North–South model of trade in waste reuse. They found that Pareto optimality is reached when the di¤erence in e-waste taxation rates between the two countries is equal to the di¤erence in their respective external marginal cost of ewaste. Empirically, Bond (1983) developed a model based on di¤erences in factor prices and technologies to explain trade in used equipment between …rms. Frazer (2008) explained the decline in apparel production in Africa due to used-clothing donations,8 and Clerides (2008) described the gains from trade in used vehicles. Baggs (2009) and Kellenberg (2010) both attempted to explain the PHH by the trade pattern of waste. In particular, Kellenberg found that waste moves toward countries with less stringent regulations. The present paper adds two dimensions to this literature: illegal shipments due to imperfect monitoring, and incentives for green design.. 2. The Model. The problem is set in a basic model of international trade where a representative …rm in a developing country (the South) imports inputs (used products) from a representative …rm in a developed country (the North). New …nal goods are produced in quantity xN by a representative …rm in the North and they are consumed at home. The …rm faces a decreasing inverse demand for its new products: pN = where. xN ;. stands for the North’s market size. At the end of products lifetime, the …rm is. subjected to an EPR program managed through a PRO. For simplicity, the PRO’s activities are merged with the …rm’s objective function. 8. Similar to food aid, used-clothing imports harm local producers. Used-good imports as an obstacle to economic development is also discussed in detail by Janischweski et al. (2003)..
(11) 8 A proportion of the end-of-life products are classi…ed as exportable, and can be traded to the South as inputs to production. Under the EPR program, non-exported products must be disposed of in an eco-friendly manner, at a constant unit cost of disposal dN . The …rm in the South is representative of a market in perfect competition. On the international second-hand market, the …rm buys a basket of used products that were previously classi…ed as exportable. The …rm can either apply some transformation processes like cleaning, remanufacturing, or repairing, or it can act as an intermediary for shipping, handling, or reselling. One reusable good is required for the production of one output. On the local market, xS …nal goods are sold at price pS . The South can also adopt an EPR program, whereby the …rm is responsible for the unit waste disposal cost dS .. 2.1. International regulation and monitoring. Let q denote the proportion of goods xN that are reusable at the end of life. In Figure 1, Case 1 shows how, in the absence of international regulations (i.e., no monitoring), reusable and non-reusable products are classi…ed as exportable. Consequently, exports are a subset of all end-of-life products, w. xN . The purity of the exported basket. is the ratio of reusable. products in the basket of exported goods. In the absence of monitoring, purity is simply the level of reusability q. When an international regulation for waste is introduced, the share of non-reusable products should not be exported to the South. However, imperfect monitoring means that a fraction. 2 (0; 1) of these non-reusable goods is misclassi…ed. The actual fraction of used. goods classi…ed as exportable is q + (1 q=(q + (1. q) . Consequently, basket purity becomes:. q) ):. For a given level of reusability q, the set of exportable products is therefore smaller and purer.
(12) 9. Figure 1: Waste movement. as monitoring increases. This is shown in Figure 1 Case 2. In order to examine the PHH, it is assumed that the South’s environmental regulations for waste disposal are laxer than the North’s: dS. dN . Hereafter, D. dN. dS .. It is also assumed that the products have a natural rate of reusability. This means that in the absence of initial investment in green design, products can be reusable at a rate q0 2 [0; 1]. Through green design, the …rm in the North can increase its fraction of reusable products q at a unit production cost cN (q) such that c0N (q) = 0 for q and c00N (q). q0 , while c0N (q). 0. 0 for q > q0 .. In the South, the production costs re‡ect the sorting and transformation processes, which decrease with . Once sorted as reusable, goods require di¤erent degrees of intervention—.
(13) 10 from simple cleaning to a change in parts— and the marginal production cost increases with xS . These transformation costs take the form: cS (xs ; ) = x2s =2 .. 2.2. Market structure. The market structure is described by the following two-stage game. Local disposal costs, dS and dN , and the state of (or lack of) monitoring. are given.. In the …rst stage, the …rm in the North selects the level of reusability q, the initial production xN and the level of exports w. Because the …rm in the North is representative of a market in perfect competition, the price pN is taken as given when production xN is chosen. For the level of exports, however, the decision is centralized through the PRO such that the …rm acts like a monopolist. Two scenarios are explored for the choice of q: non-cooperation and collusion. In non-cooperation, the level of purity. is taken as given.. The representative …rm in the South is a price taker on the international market, whereas the …rm in the North is the leader. In the second stage, the level of imports as well as the quantity of outputs, w and xS , are determined in the South.. 3. The equilibrium. The pro…t functions for the …rm in the North and South are respectively. N. = pN xN. cN (q)xN + pw w. where w S. = pS xS. (q + (1. cS (xS ; ). (xN. q) )xN. w)dN (1). (pw + dS )w. where cS (xs ; ) = x2s =2 and xS. w. (2).
(14) 11 Equation 1 means that the …rm in the North cannot export more than the proportion of used goods classi…ed as exportable. It is assumed that the international market is su¢ ciently small so that this equation is not binding in equilibrium. The scenario of a corner solution, where the South imports all goods classi…ed as exportable, is not considered here.9 Equation (2) states that the …rm’s output in the South is limited by the amount of reusable inputs w. Using backward induction, the …nal stage is solved …rst. In equilibrium, all reusable inputs are transformed into outputs, and the constraint (2) is binding: xS =. w. The. representative …rm’s problem is: max w. S. = pS w. ( w)2 =2. (pw + dS )w:. The …rst-order condition leads to the following reaction demand function for imported goods: pw = pS. w. (3). dS :. The …rst stage in the game is the Northern …rm’s problem. Using equation (3), the problem becomes: max. w;xN ;q. N. = pN xN. cN (q)xN + (pS. With the di¤erence in disposal cost D max. w;xN ;q. N. = pN xN. cN (q)xN. w dN. dS )w. This implies that. xN dN + (pS |. is su¢ ciently large. Formally,. w)dN :. dS , this can be written as. w:. 9. (xN. w )w + Dw: {z }. (4). net bene…t of export. > (ps q + D) 2+2. (q+(1 q) )2 q. + cN (q) + dN ..
(15) 12 Using pN = w. =. xN =. xN , the …rst-order conditions lead to: pS. +D 2 cN (q ). (5) dN. (6). The export price is: pw =. pS. dN 2. dS. For analysis purposes, illegal shipments I, which is the non-reusable share of exports, takes the form: I. (1. )w. (7). Note that in the absence of green design, equation (5) shows the direct channel for the PHH. The di¤erence in regulations between the North and South D drives the export of reusable and non-reusable waste. This partially echoes Kinnaman and Yokoo’s (2011) …nding that Pareto optimality depends on the di¤erence in e-waste taxes between countries, and not tax levels..
(16) 13. 3.1 3.1.1. Non-cooperation and collusion Green design. The choice of reusability is set either in non-cooperation or collusion. Knowing that the level of purity. is taken as given in non-cooperation, the optimality conditions are. d N dq d N dq. =. c0N (q nc )xN. 0 , q nc = q0. =. @ c0N (q c )xN + @q. (. )2 4. (8) D2. !. =0. (9). where the superscripts nc and c denote the equilibrium in non-cooperation or collusion. Hence q = fq nc ; q c g.. It is assumed that the second-order condition for a maximum is. respected. Note that equation (9) again highlights the role of the di¤erence in disposal costs. Equations (8) and (9) say that the choice of reusability in the case of non-cooperation q nc is restricted to the natural rate of reusability q0 , whereas collusion leads to an investment in greener design q c . This is stated in the following proposition.. Proposition 1 Collusion, compared to non-cooperation, leads to higher reusability: q nc = q0 3.1.2. qc:. Illegal shipments and pollution. In equilibrium, the environmental damage functions take the following forms: QN = Q(dN )(xN. w ) (10). QS = Q(dS )w QW orld = Q(dN )xN + (Q(dS ). Q(dN ))w.
(17) 14 QN and QS stand for local pollution in the North and South and QW orld stands for global pollution. Stricter waste regulations reduce pollution, hence Q0 ( ). 0.. Proposition 2 Collusion, compared to non-cooperation, leads directly to higher purity, lower c production in the North, and lower exports, i.e., nc , xnc xcN and wnc wc . The N presence of lower exports at higher purity unambiguously leads to a reduction in illegal shipments: I nc. I c:. Collusion also results in reduced global pollution, and more particularly, reduced pollution in the South: Qnc S. QcS and Qnc W orld. QcW orld :. The impact on the level of pollution in the North is ambiguous. The results in proposition 2 suggest that although the impact on environmental quality in the North is ambiguous, global pollution is invariably reduced, justifying collusion as an environmental policy. Note that by internalizing the externality, collusion produces greater pro…ts, which means that industry in the North would collaborate with any environmental policy that promotes collusion. At the same time, the South bene…ts from fewer illegal shipments.. 4. Disposal costs and international monitoring. The following set of results presents what occurs when there is a change in disposal cost or international monitoring. First, the impact of a change in policy on green design is presented. According to equations (8) and (9), i.e. the optimality conditions for the level of reusability, it is straightforward to see that green design varies in the collusion case but remains unchanged in the non-cooperation case. Hence, this section compares the two cases by highlighting the.
(18) 15 importance of incentives for green design. The impacts on illegal shipments and pollution are discussed.. 4.1 4.1.1. Disposal costs and the Pollution Haven Hypothesis Green design. One of the rationales for EPR is that by internalizing the cost of waste disposal, …rms choose a higher level of reusability. The following presents what happens when the North applies stricter waste management regulations, and therefore higher disposal cost: We have: sign. dq c ddN. @2 N @q@dN. @2 N where @q@dN @ c 2D = c0N (q c ) + @q 4 c =. sign. Proposition 3 For all q c , there exists a unique. (11) > 0 such that. dq c R 0 () D Q : ddN In particular, for D = 0, dq c =ddN > 0. Note that. depends on the initial value of q c ,. determined by the equilibrium prior to the change in policy. Proof: We know that c0N (q) and @ =@q are positive. Therefore, equation (11) strictly decreases when D increases. Since dq c =ddN > 0 when D = 0, then dq c =ddN = 0 when D=. > 0.. When the South regulates as much as the North, i.e. D = 0, the level of reusability q increases unambiguously with the strength of local waste regulations dN . However, when the di¤erence between disposal costs is su¢ ciently large, more stringent waste regulations induce …rms to reduce green design..
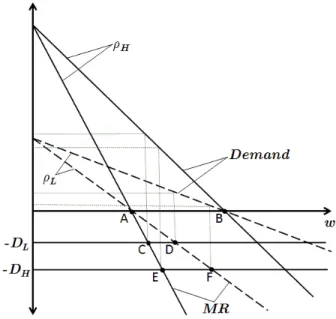
(19) 16 To better understand the intuition behind Proposition 3, let consider the maximization problem for the choice of exports (from equation (4)): max w. w. = (pS. w )w + Dw = p(w)w. M Cw:. This is a standard maximization problem for a monopolist, with the di¤erence that the marginal cost M C, which includes the savings in disposal cost in the North, is negative (i.e., MC =. D). The term p(w) is an adjusted inverse demand function. This is illustrated in. Figure 2, which presents four scenarios: combinations of low and high di¤erence in disposal costs (DL and DH ) and low and high purity ( demand curve is p(w) = pS pS. L,. dashed lines; and. H,. solid lines). The. w and the marginal revenue curve (M R) is p0 (w)w + p(w) =. 2w . For the four scenarios, the equilibrium is set at the intersection between the. marginal cost and the marginal revenue, i.e., M R = reduction in purity (e.g., a change from. H. to. L). D (points C to F). Note that a. leads to greater demand elasticity and. pivots the marginal revenue and demand curves to the left around points A and B. Therefore, below the horizontal axis, the demand shifts up. It can be seen that, in the case of a standard positive marginal cost, a reduction in purity invariably leads to a drop in both prices and quantities, unambiguously resulting in lower bene…t of export. However, when the marginal cost is negative, the drop in price is compensated by greater demand. Tightening regulations in the North makes the marginal cost more negative and exacerbates this e¤ect. Comparative static, d w p2 = S d 4. d2 w D2 D and = , 4 2 d dD 2 2. says that the marginal bene…t of reducing purity. increases with the di¤erence in disposal. cost D and becomes positive when D is su¢ ciently large. Referring to equation (9), the choice of reusability, or indirectly the choice of purity, is set where the marginal bene…t of.
(20) 17. Figure 2: E¤ect of a change in purity on the net bene…t of export. export is equal to the marginal cost of producing more reusable products. As D increases, reducing reusability becomes more attractive. In light of Proposition 3, the positive impact of EPR programs on green design holds when there is little di¤erence between Northern and Southern local regulations. With increasing disposal cost in the North, colluding …rms are more likely to consider the greater demand associated with lower purity instead of improving the level of reusability. Proposition 4 In equilibrium, increased disposal cost in the South invariably increases the level of reusability. sign. dq c @2 N @2 N @ c = sign where = ddS @q@dS @q@dS @q. 2D 4 c. 0:.
(21) 18 4.1.2. Illegal shipments and pollution. The impact of a change in disposal cost in the North dN on illegal shipments and pollution depends on the incentive for …rms in the North to adjust the level of product reusability. More particularly, it depends on the sign and the amplitude of this incentive. Using equations (5) to (10), and Proposition 3, we have: Proposition 5 The following table summarizes the impact of tighter regulations in the North on the level of illegal shipments, pollution in the North and South, and global pollution. Case dn1: in the absence of green design (as in the non-cooperation case, q is …xed), the change in disposal cost directly implies an increase in exports and a reduction in initial production. Case dn2: green design greatly improves purity such that exports decrease despite the higher disposal cost. Higher production and disposal costs reduce initial production. This occurs only if D < . Case dn3: the magnitude of the change in green design is small and the impact on exports and initial production is similar to Case dn1. Case dn4: a reduction in green design is su¢ ciently high for initial production to increase, despite the higher disposal cost. Lower purity and higher disposal cost increase exports. This occurs only if D > . The sign ? 0 denotes ambiguity. Case. dn1. dn2. dn3. dn4. q f ixed. dq =ddN > 0. dq =ddN ? 0. dq =ddN < 0. dw =ddN > 0. dw =ddN < 0. dw =ddN > 0. dw =ddN > 0. dxN =ddN < 0. dxN =ddN < 0. dxN =ddN < 0. dxN =ddN > 0. dI=ddN. >0. <0. ?0. >0. dQN =ddN. <0. ?0. <0. ?0. dQS =ddN. >0. <0. >0. >0. dQW orld =ddN. ?0. <0. ?0. ?0.
(22) 19 Case dn1 is in line with the PHH, because a greater di¤erence in environmental regulations between developed and less-developed countries results in a pollution (waste) ‡ow toward poor countries. This result changes when there are incentives for adjusting green design, as in cases dn2 to dn4. When the EPR is similar between the two countries, i.e., when D < , the …rm in the North, which internalizes the South’s disposal cost, does not bene…t from a large di¤erence between local and foreign disposal costs. Therefore, the …rm will increase the level of product reusability q, propose baskets with higher purity , and bene…t from higher prices on the export market. In Case dn2, illegal shipments, pollution in the South, and global pollution are reduced. Due to incentives for green design, a greater di¤erence in environmental regulations between the North and South reduces the pollution ‡ow toward the laxest country. This result contradicts the PHH. When the EPR di¤ers greatly between the two countries, i.e., when D > , the …rm in the North bene…ts from a large di¤erence between its local disposal cost and the internalized South’s cost. The …rm’s strategy will therefore be to export non-reusable goods, which are disposed of more cheaply in the South. The …rm in the North will reduce product reusability q and reduce the purity of exported baskets . This strategy lowers the price of exports pw and increases the demand for used goods. With higher exports and lower purity, illegal shipments I unambiguously increase. If purity were to remain high, the demand in the South would rapidly become saturated and the exports would remain too low relative to the increasing disposal cost in the North and the possibility of dumping non-reusable waste in the South. The change in green design magni…es the pollution haven e¤ect. Results in Proposition 5 show that only Case dn2 ensures a reduction in global pollution, which occurs only if tighter regulations stimulate green designs (i.e., D < ). This is also the only case that can lead to a simultaneous reduction in pollution in the North and South. Other scenarios, where pollution in the North unambiguously decreases, leave the impact on global pollution uncertain. Therefore, a change in disposal cost in the North that is.
(23) 20 driven by local environmentalists may not serve the interests of global environmentalists, and vice-versa. As D and dq =ddN change, the impacts on production, purity, and terms of trade vary. A well-designed regulation for waste management should therefore include …rms’responses in terms of product design. Ignoring changes in product design may lead to adverse environmental impacts. Using equations (5) to (10), and Proposition 4, we have: Proposition 6 The following table summarizes the impact of tighter regulations in the South on the level of illegal shipments, pollution in the North and South, and global pollution. Case ds1: in the absence of green design (as in the non-cooperation case, q is …xed), change in disposal cost directly reduces exports and leaves the initial production unchanged. Case ds2: an increase in disposal cost in the South invariably stimulates green design. Higher purity and disposal cost in the South reduce exports. Higher production cost reduces initial production. ds1. ds2. q f ixed. dq =ddS > 0. dw =ddS < 0. dw =ddS < 0. dxN =ddS = 0. dxN =ddS < 0. dI=ddS. <0. <0. dQN =ddS. >0. ?0. dQS =ddS. <0. <0. dQW orld =ddS. <0. <0. Tightening the environmental regulations in the South reduces illegal shipments as well as local and global pollution. If …rms in the North adopt greener design, they may help prevent rising pollution in the North..
(24) 21. 4.2 4.2.1. International monitoring Green design and purity. This section presents the impact of stronger international monitoring on the level of reusability. We have: sign. dq c @2 N = sign where d @q@. @2 N @2 c = @q@ @q@. (pS c )2 D2 4 c. !. @ c@ + @q @. c. (pS c )2 + D2 4 c. !. (12). :. The …rst term is the variation in the marginal revenue of exports due to a variation in the marginal e¤ect of the level of reusability q. Considering the optimality condition for the choice of q (equation 9), we know that (pS c )2. D2 is positive in equilibrium. The second. term in equation (12) is always negative. It represents the variation in the marginal revenue of exports due to a variation in the terms of trade. Proposition 7 There exists dq c R 0 =) d. c. > 0:5 such that. R. (13). The e¤ect of stronger international monitoring (a reduction in ) on reusability q c depends on the initial value of purity. c. prior to the change in policy.. Proof: Rearranging equation (12), we see that. dq c d. R0,. @2 c @q@. @ c@ @q @. c. 1. R. (pS (pS. c )2 +D 2 c )2. D2. .. The right-hand side is positive and decreasing in . For the speci…c form of , the left-hand side (let LHS =. @2 c @q@. @ c@ @q @. combination of q 2 (0; 1) and. c. 1. ) is constant for any given (q; ) obtained with any. 2 (0; 1), and it respects the following properties:. @2 c R 0 , LHS R 0 , R 0:5; and @q@ lim LHS = 1 and lim LHS = +1. !0. !1. (14).
(25) 22 Therefore,. exists and occurs at. > 0:5.. When purity is high, equation (14) becomes positive, which means that stronger international monitoring reduces the impact of green design on purity. When purity is su¢ ciently high, …rms in the North are incited to reduce the level of reusability. Most variables of interest in this model depend on purity . A change in international monitoring a¤ects purity directly as well as indirectly, through changes in green design. When an increase in international monitoring leads to a reduction in reusability, the two e¤ects work in opposite directions. Proposition 8 The total e¤ect of stronger international monitoring (a reduction in ) on purity. is positive if and only if d d. c. =. @ c dq c @ + @q d @. c. 0 (). dq c d. q c (1. qc). :. From propositions 7 and 8, if purity is initially small, then it increases with stronger international monitoring, i.e.,. c. <. , dq c =d. < 0 < q c (1. q c )= . If international. monitoring continues to strengthen, purity rises and becomes high when. c. > :. In some circumstances, stronger international monitoring will have the opposite e¤ect to what was intended. From Proposition 7, we know that this scenario occurs only when purity is initially high, i.e. dq c =d > q c (1. q c )= > 0 =). c. > . All else equal, stronger. international monitoring directly increases purity. A …rm that wishes to maintain a lower level of purity will therefore reduce its level of reusability. When purity is already high, the bene…t of reducing purity through q can be greater than the bene…t, through the terms of trade, of maintaining high purity. 4.2.2. Illegal shipments and pollution. Using equations (5) to (10), and propositions 7 and 8, we have:.
(26) 23 Proposition 9 The following table summarizes the impact of stronger international monitoring (a reduction in ) on illegal shipment, pollution in the North and South, and global pollution. Case. 1: in the absence of green design (as in the non-cooperation case, q is. …xed), stronger international monitoring directly improves purity, which lowers exports. Initial production is not a¤ected. Case 2: stronger international monitoring induces …rms to choose a higher level of reusability. This directly and indirectly improves purity and lowers < . Case. exports. Higher production cost reduces initial production. This occurs only if. 3: stronger international monitoring induces …rms to reduce reusability, whereas purity still increases. Higher purity reduces exports and lower production cost increases initial production. This occurs only if. > . Case 4: stronger international monitoring greatly reduces. the incentive for reusability such that it lowers purity. Lower purity shifts the demand upward, and exports increase. Lower production cost stimulates initial production. This occurs only if. > . Case. 1. 2. 3. 4. q f ixed. dq =d < 0. dq =d > 0. dq =d > 0. d =d < 0. d =d < 0. d =d < 0. d =d > 0. dw =d > 0. dw =d > 0. dw =d > 0. dw =d < 0. dxN =d = 0. dxN =d > 0. dxN =d < 0. dxN =d < 0. dI=d. >0. >0. >0. <0. dQN =d. <0. ?0. <0. ?0. dQS =d. >0. >0. >0. <0. dQW orld =d. >0. >0. ?0. <0. Proposition 9 says that stronger international monitoring generally reduces illegal shipments, and accordingly, the level of pollution in the South. However, under some conditions, stronger monitoring when purity is high induces …rms to downgrade green design, which.
(27) 24 diminishes purity (case 4). This intensi…es illegal shipment, pollution in the South, and global pollution. Only cases where purity is low, i.e., where. < , or where there is no incentive for green. design, ensure decreased global pollution as the result of stricter monitoring. The one who would like to strengthen monitoring in a purer economy, i.e., when. > , should be aware. of the adverse e¤ects on the level of reusability.. 5. Conclusion. This paper considered a North–South model whereby used durable goods in the North are imported by a …rm in the South as inputs to production. Imperfect international monitoring allows illegal waste to be mixed with reusable products. The Pollution Haven Hypothesis (PHH) was examined, with special attention given to the impact of incentives for green design. In the presence of large di¤erences in local waste regulations between the two countries, it appears that extended producer responsibility (EPR) programs, which make producers accountable for the cost of waste disposal, incite …rms to reduce reusability and open the way to illegal shipments of waste. This exacerbates the pollution haven e¤ect. Conversely, trade with countries that apply similar regulations would preserve the initial intention of these programs: more stringent regulations in the North stimulate green design, reduce illegal shipments, and reduce pollution in the South although the di¤erence in local regulations between the two countries increases. This contradicts the PHH. International monitoring also plays an important role. Stronger enforcement of international agreements generally leads to reduced illegal shipments of waste and increased levels of reusability. However, when the level of reusability is already high, stronger enforcement makes higher reusability less attractive. In some cases, lowering the level of reusability, compared to improved terms of trade, results in greater bene…ts. Producers with a high level.
(28) 25 of reusability would therefore respond to stronger international monitoring with adverse behaviours. To conclude, incentives for changes in green design should not be ignored, because the impact of environmental policies concerning the illegal market and pollution levels is sensitive to …rms’responses in terms of reusability level.. Acknowledgements Special thanks to Brian Copeland, Louis Hotte, Stan Winer, Hide-Fumi Yokoo, Matthieu Glachant and seminar participants at McGill University, 44th Annual Conference of the Canadian Economic Association, University Paris 1, CERDI, ENGREF Nancy, and the Toulouse School of Economics.. References Baggs, Jen (2009) ‘International trade in hazardous waste.’ Review of International Economics 17(1), 1–16 Beukering, Pieter J.H. Van, and Mathijs N. Bouman (2001) ‘Empirical evidence on recycling and trade of paper and lead in developed and developing countries.’World Development 29, 1717–1737 Bond, Eric W. (1983) ‘Trade in used equipment with heterogeneous …rms.’The Journal of Political Economy 91, 688–705 Clerides, Sofronis (2008) ‘Gains from trade in used goods: Evidence from automobiles.’ Journal of International Economics 76, 322–336 Copeland, Brian R. (1991) ‘International trade in waste products in the presence of illegal disposal.’Journal of Environmental Economics and Management 20, 143–162 Czarnomski, Sarah, and Barry Webb (2006) ‘IMPEL-TFS threat assessment project: The illegal shipment of waste among impel member states.’Technical Report, Environment Agency England and Wales, Jill Dando Institute of Crime Science, University College London..
(29) 26 EEA (2009) ‘Waste without borders in the EU? Transboundary shipments of waste.’Technical Report, European Environment Agency Fischer, Christian, Nanja Hedal, Rikke Carlsen, Karin Doujak, David Legg, Judith Oliva, Sara Lüdeking Sparvath, Matti Viisimaa, Thomas Weissenbach, and Mads Werge (2008) ‘Transboundary shipments of waste in the EU. developments 1995-2005 and possible drivers.’Technical Report, European Topic Centre on Resource and Waste Management, European Environment Agency Fleckinger, Pierre, and Matthieu Glachant (2010) ‘The organization of extended producer responsibility in waste policy with product di¤erentiation.’ Journal of Environmental Economics and Management 59, 57–66 Frazer, Garth (2008) ‘Used-clothing donations and apparel production in Africa.’The Economic Journal 118, 1764–1784 Ino, Hiroaki (2007) ‘Extended producer responsibility on oligopoly.’ Economic Bulletin 17(6), 1–9 Janischweski, Jörg, Mikael P. Henzler, and W. Kahlenborn (2003) ‘The export of secondhand goods and the transfer of technology.’Technical Report, The German Council for Sustainable Development Kellenberg, Derek (2010) ‘Trading waste.’Technical Report, University of Montana Kinnaman, Thomas, and Hide-Fumi Yokoo (2011) ‘The environmental consequences of global reuse.’American Economic Review 101, 71–76 OECD, ed. (2004) Economic aspects of extended producer responsibility Rosenthal, Elisabeth (September 27, 2009) ‘Smuggling Europe’s waste to poorer countries.’ The New York Times Runkel, Marco (2003) ‘Product durability and extended producer responsibility in solid waste management.’Environmental and Resource Economics 24, 161–182 Walls, Margaret (2006) ‘Extended producer responsibility and product design: Economic theory and selected case studies.’Resource for the Future Yardley, Jim (April 23, 2010) ‘Scrap metal rediation raises concerns in India.’The New York Times Yoshida, Aya, and Atsushi Terazono (2010) ‘Reuse of secondhand tvs exported from japan to the philippines.’Waste management 30, 1063–1072.
(30)
Figure

Documents relatifs
Trade, processing, transportation and tutai I i tig ~3~c~r4 left ha prly~tt~: agents. The main state htteth'Cl)t 10n in trade, remained on food security schemes through nee-capon
The TOBM was first developed by the Tokyo metropolitan government in
Notes: The figure depicts median prices of individual markets (gray lines), fundamental value (red straight line) and the average of median session prices (black line with diamonds)
The main challenges encountered during revision of the Regulations include: ensuring that only public health risks that are of international importance, including but not limited
The period provided in execution of Article 22 of the Constitution of the Organization for rejection or reservation shall be three months from the date of the notification by
In view, however, of the suggestion concerning procedure contained therein, the Legal Committee recommends that the Diredtor-General, when transmitting the regulations to
Mapping of such semantics from Mercury to Le- galRuleML is only partially possible because of Mercury’s bipartite structure (rulebook + vocabulary) following SBVR. Mapping is
This work represents a significant step using a closed cell chamber for the generation of photochemical Titan aerosol analogues in order to better constrain the nitrogen fixation
