Université de Montréal
Dodecyltrimethylammonium chloride adsorption at the
silica/water interface studied by Sum Frequency
Generation
par
Lady Lorena Torres Chivara
Département de chimie Faculté des arts et des sciences
Mémoire présenté à la Faculté des études supérieures et postdoctorales en vue de l’obtention du grade de maître ès sciences (M.Sc.)
en chimie
Décembre 2015
i
Résumé
La génération des fréquences somme (SFG), une technique spectroscopique spécifique aux interfaces, a été utilisée pour caractériser les changements de la structure macromoléculaire du surfactant cationique chlorure de dodécyltriméthylammonium (DTAC) à l’interface silice/eau dans une plage de pH variant entre 3 et 11. Les conditions expérimentales ont été choisies pour imiter les conditions les plus communes trouvées pendant les opérations de récupération assistée du pétrole. Particulièrement, la silice a été étudiée, car elle est un des composantes des surfaces minérales des réservoirs de grès, et l’adsorption du surfactant a été étudiée avec une force ionique pertinente pour les fluides de la fracturation hydraulique. Les spectres SFG ont présenté des pics détectables avec une amplitude croissante dans la région des étirements des groupes méthylène et méthyle lorsque le pH est diminué jusqu’à 3 ou augmenté jusqu’à 11, ce qui suggère des changements de la structure des agrégats de surfactant à l’interface silice/eau à une concentration de DTAC au-delà de la concentration micellaire critique. De plus, des changements dans l’intensité SFG ont été observés pour le spectre de l’eau quand la concentration de DTAC augmente de 0,2 à 50 mM dans les conditions acide, neutre et alcaline. À pH 3, près du point de charge zéro de la surface de silice, l’excès de charge positive en raison de l’adsorption du surfactant cationique crée un champ électrostatique qui oriente les molécules d’eau à l’interface. À pH 7 et 11, ce qui sont des valeurs au-dessus du point de charge zéro de la surface de silice, le champ électrostatique négatif à l’interface silice/eau diminue par un ordre de grandeur avec l’adsorption du surfactant comme résultat de la compensation de la charge négative à la surface par la charge positive du DTAC. Les
ii
résultats SFG ont été corrélés avec des mesures de l’angle de contact et de la tension interfaciale à pH 3, 7 et 11.
Mots clés : Spectroscopie nonlinéaire, surfactants d’alkylammonium, interfaces minéraux/eau, mouillabilité, tension interfaciale, fracturation hydraulique.
iii
Abstract
Sum Frequency Generation (SFG), an interface specific spectroscopic technique, was used to characterize the changes in the macromolecular structure of the cationic surfactant dodecyltrimethylammonium chloride (DTAC) at the silica/water interface at pH values ranging from 3 to 11. The experimental conditions were selected to mimic conditions common during enhanced oil recovery operations. In particular, silica was studied since it is one of the most abundant mineral components of sandstone reservoirs, and surfactant adsorption was studied at an ionic strength (100 mM NaCl) relevant to hydraulic fracturing fluids. SFG spectra showed detectable peaks with increasing amplitude in the methylene and methyl stretching region when the pH was lowered to 3 or increased to 11, suggesting changes in the surfactant aggregate structure at the silica/water interface at a DTAC concentration above the critical micelle concentration. In addition, changes in the SFG intensity were observed for the water spectrum when increasing the DTAC concentration from 0.2 to 50 mM under acidic, neutral or alkaline conditions. At pH 3, near the point of zero charge of the silica surface, the excess positive charge due to adsorption of the cationic surfactant creates an electrostatic field that orients water molecules at the interface. At pH 7 and 11, which are above the point of zero charge of the silica surface, the negative electrostatic field at the silica/water interface decreases in magnitude with surfactant adsorption due to compensation of the negative surface charge by the positively charged DTAC. The SFG results were correlated with contact angle and interfacial tension measurements at pH 3, 7 and 11.
iv
Keywords: Nonlinear Spectroscopy, Alkylammonium Surfactants, Mineral/Water Interfaces, Wettability, Interfacial Tension, Hydraulic Fracturing.
v
Table of contents
Résumé……….i
Abstract ………....iii
Table of contents ………...v
List of tables ………....vii
List of figures ………...……..viii
List of abbreviations ………...……...xi
Acknowledgements ………xiv
Chapter 1 Introduction and Literature Review ………...1
1.1 Cationic alkylammonium surfactants ………...4
1.2 Silica surface properties ………...5
1.3 Adsorption of cationic surfactants at the silica/water interface………8
1.4 Sum Frequency Generation ………11
Chapter 2 Article ………...………..14
2.1 Abstract………..16
2.2 Introduction ………...17
2.3 Experimental section……….21
2.3.1. Contact Angle and Interfacial Tension Measurements……….21
2.3.2. Materials and Reagents……….21
2.3.3. SFG Spectroscopy ………23
2.4 Results and discussion ………25
2.4.1. Contact Angle and Interfacial Tension Measurements……….25
vi
2.4.3. SFG Spectra of Water in the Presence of DTAC………..35
2.5 Conclusions ………42
2.6 Acknowledgments ………..46
2.7 Supporting information ………..47
Chapter 3 Additional experiments ………48
3.1 SFG spectrum of the polymer Poly(methyl methacrylate), PMMA, at the silica/air interface ………...…48
3.2 CH stretching resonances of the surfactant DTAC at the silica/D2O interface ………...50
3.3 SFG spectra of water in the presence of DTAC. Results at pH 3 and pH 11 without addition of salt ……….….55
Conclusion and perspectives ………..58
vii
List of tables
Table 2.1 Assignments for the CH stretching modes of adsorbed DTAC ………..32 Table 2.2 Parameters obtained from Figure 2.2 after fitting the spectra at pD 3 using Equation 2.4. The fittings and uncertainties (one standard deviation) were calculated using the software package IGOR Pro v6.3.4.0………...47
Table 2.3 Parameters obtained from Figure 2.2 after fitting the spectra at pD 11 using Equation 2.4. The fittings and uncertainties (one standard deviation) were calculated using the software package IGOR Prov 6.3.4.0………....47 Table 3.1 Assignments for the CH stretching modes of adsorbed DTAC on silica………...53
viii
List of figures
Figure 1.1 Molecular structure of dodecyltrimethylammonium chloride……….……..4 Figure 1.2 The four-region adsorption isotherm for ionic surfactants at charged surfaces………..…10 Figure 2.1 (a) Sessile contact angle measurements as a function of the bulk DTAC concentration with 100 mM NaCl on a quartz surface. (b) Interfacial tension at the solution/air
interface determined by the pendant drop
method……….……...27 Figure 2.2 SFG spectra in the CH stretching region for the surfactant DTAC adsorbed at the silica/D2O interface as a function of the pD. The conditions for the experimental results shown in each panel are the following: (a) 15 mM DTAC and pD 3−7 and (b) 15 mM DTAC and pD 7−11……….….….30 Figure 2.3 SFG spectra for DTAB-d25 and DTAC in the presence of 100 mM NaCl and at pD 11. The spectra were collected at the silica/ D2O interface……….….31 Figure 2.4 Amplitudes of the CH stretching symmetric modes and the corresponding ratios of the amplitudes (CH3/CH2). Data are plotted as a function of the pD. The amplitudes were obtained using eq 2.4 to fit the spectra in Figure 2.2. Fits were carried out for the spectral range between 2750 and 2890 cm−1. The data displayed and the corresponding conditions for each panel are the following: (a) amplitudes between pD 3 and pD 6, (b) amplitudes between pD 7 and pD 11, (c) ratios between pD 3 and pD 6, and (d) ratios between pD 7 and pD 11………..33
ix
Figure 2.5 SFG spectra in the CH and OH stretching regions for DTAC at three different pH values: (a) pH 7 without salt, (b) pH 7 with 100 mM NaCl, (c) pH 3 with 100 mM NaCl, and
(d) pH 11 with 100 mM
NaCl………..……….…36 Figure 2.6 SFG spectra in the CH stretching region for high surfactant concentrations in the presence of 100 mM NaCl at (a) pH 7, (b) pH 3, and (c) pH 11. The spectra were collected at the silica/H2O interface………...………...41 Figure 2.7 Proposed changes in the macromolecular structure of DTAC at the silica/water interface, which are induced by acidic or basic pH conditions……….……..……45 Figure 3.1 SFG spectra of PMMA at the PMMA/air interface, at the beginning (red circles) and at the end (black empty circles) of a set of DTAC experiments………..……….…….49 Figure 3.2 SFG spectra in the CH stretching region for the surfactant DTAC at the silica/D2O interface as a function of DTAC concentration. (a) DTAC with 100 mM NaCl at pD 3, (b) DTAC without the addition of salt at pD 11 and (c) DTAC with 100 mM NaCl at pD 11………...………...52 Figure 3.3 Normalized SFG Electric field corresponding to the symmetric methylene (a) and methyl (b) stretches as a function of surfactant concentration. Red circles are data at pD 3 containing 0.1 M NaCl; blue triangles are data at pD 11 without addition of salt and green
squares are data at pD 11 with 0.1 M
x
Figure 3.4 SFG spectra in the CH and OH stretching regions for DTAC at pH 3 (a) and pH 11 (b). The solutions tested were prepared without adding NaCl. The spectra presented in this
figure were collected at the silica/H2O
xi
List of abbreviations
⟨α(3)⟩ - third order polarizability
⟨α2⟩ - second order polarizability
° - contact angle unit
Aν – Intensity of the vibrational modes
CH2 – methylene groups
CH3 – methyl groups
CH3/CH2 – methyl to methylene amplitude
ratio
cm-1 – wavenumber unit
CMC – critical micelle concentration CO2 – carbon dioxide
CTAB – Cetyltrimethylammonium bromide
CTAC – Cetyltrimethylammonium chloride
d+- methylene symmetric stretch
d+FR – methylene symmetric stretch (Fermi
resonance)
D2O – deuterated water
DCl – Deuterated hydrochloric acid
DTAB – Dodecyltrimethylammonium bromide
DTAB-d25 - dodecyl-d25
-trimethylammonium bromide. The surfactant tail was deuterated.
DTAC - Dodecyltrimethylammonium chloride
EIR –Electric field generated by the infrared frequency
Eo – Electrostatic field
EOR – Enhanced oil recovery
EVIS –Electric field generated by the visible frequency
h – hour
HCl- hydrochloric acid
HPLC – High performance liquid chromatography
M- moles per liter min – minute
mM - millimoles per liter mTorr – millitorr
xii mV – millivolts
MW – molecular weight
N –number density of molecules NaCl – Sodium chloride
NaOD – Sodium deuterated hydroxide NaOH – Sodium hydroxide
nm- nanometer OH- - hydroxyl
pKa – logarithm of the acidity constant
PMMA - poly(methyl methacrylate)
PSFG – Sum frequency generation polarization
PZC – point of zero charge r+ - methyl symmetric stretch
r+FR – methyl symmetric stretch (Fermi
resonance)
r+HG - methyl symmetric stretch of the
headgroup
SFG - Sum frequency generation SHG - Second harmonic generation -SiO- - ionized silanol group
-SiOH – Silanol groups
-SiOH2+- protoned silanol group
TOC - total organic carbon
Γν - is the line with of the transition
χ(2)- second order susceptibility χ(2)NR – nonresonant susceptibility χ(2)R -resonant susceptibility χ(3) – third order susceptibility
XPS - X-ray photoelectron spectroscopy ωIR – Infrared frequency
ωSFG – Sum frequency generation frequency
ωVIS – Visible frequency
xiii
xiv
Acknowledgements
I express my sincere acknowledgement to my advisor, Professor Patrick Hayes, for all the support and the patience he dedicated during my Master study. His ethics, guidance and experience helped me to overcome the difficulties and he became a mentor and a model to follow in my professional life.
Special thanks to Prof. Paula Wood-Adams for providing us the access to Concordia University´s SFG system. To Profs. Jean-François Masson and Kevin Wilkinson for allowing me to use some of their equipment during my project. I must also thank the University of Montreal and especially the Faculté des Études Supérieures et Postdoctorales for the scholarship to conclude my studies.
Many thanks to the interns and students that I once worked with in my group, for their kind and generous help: Mathilde, Toufik, Amara, Mounia, Adriana, Philippe and Prettiny. I must also thank God for giving me the opportunity to realize my dreams and to give me the force to continue even in the moments of adversity. I would like to thank my family and friends, especially my parents, Luis Torres and Elisa Chivara and my sister Erika Torres, for their unconditional love and support; I would never have done it without them.
1
Chapter 1 Introduction and Literature Review
Surfactants are a unique group of chemicals able to modulate interfacial properties. The importance of surfactants in surface modification lies in their association and self-assembly properties conferred by the presence of specific functional groups that lead to amphiphilic characteristics. The geometry and the stability of the surfactant structures are driven by the balance of van der Waals, hydrophobic, hydrogen-bonding and electrostatic interactions. Due to these forces, surfactants exhibit the fluid-like behaviors associated with colloids, complex fluids, and soft (structured) materials (1). Complex fluids are related to multi-component soft materials with non-Newtonian rheological behavior such as lipid membranes, cell suspensions and in general biological systems. Soft materials are systems easily deformed by forces including polymers, colloids, foams, liquid crystals and gels (2). Specific conditions in the solution such as the presence and concentration of electrolyte, the pH, the solvent and the nature of the interfaces direct the formation of aggregates. Micelles, vesicles, bilayers, monolayers, cylinders and other morphologies can be formed as a consequence of the intermolecular forces mentioned here (1). These last structures can be the components of soft materials and soft materials at interfaces.
Due to the molecular structure of surfactants consisting of functional groups with low attraction for the solvent (i.e. lyophobic or hydrophobic in water solutions) and a group with high attraction for the solvent (i.e. lyophilic or hydrophilic in water), surfactants can be oriented at interfaces. The lyophobic groups are mainly composed of aliphatic and aromatic
2
chains of different length and unsaturation degree, which confers an affinity for non-polar solvents or phases. According to the charge on the lyophilic group of the surfactant structure, surfactants can be classified as anionic, cationic, nonionic or zwitterionic. Most lyophilic functional groups undergo acid-base reactions leading to positive, negative or neutral charge. The electrostatic interactions arising from these charges then play an important role in determining the orientation and distribution of surfactants along an interface and their impact on the free energies of the interfacial area (3).
The pH dependence of surfactant properties has been an important subject of research because of its influence on micelle formation, modulating other properties such as solubility, interfacial tension, and rheological behavior of the phase that contains them and more specifically the interfacial area. Most of the ionic surfactants, such as soaps composed of fatty acids and salts, contain functional groups that are pH dependent. At a certain pH value, a solution containing pH-sensitive surfactant might exhibit a binary surfactant mixture between the protonated and deprotonated forms of the surfactant. Even although, at certain pH conditions one of the ionized or protonated monomer surfactant forms should predominate, the micelles formed may contain important quantities of both forms of the surfactants. Maeda et al. studied the surfactant dodecyldimethylamine oxide with an electrolyte concentration of 0.1 M NaCl and at pH 3, and they found that 1% of the surfactant monomer was ionized while 10% of the molecules forming the micelles are ionized (4, 5).
Within the forces responsible of adsorption of cationic surfactants on negatively charged surfaces, the Coulombic attractions are one of the most relevant. The ionic pair, formed
3
between the surfactant ion and the charged groups at the surface, trends to screen the surface charge density (6). Therefore, ionization of the surface groups increases because of the adsorption of ionic surfactant when increasing the pH. Goloub et al. studied the adsorption of the cationic surfactants (dodecylpyridinium chloride and cetylpyridinium) on silica, in the presence of KCl as an electrolyte. According to those studies, specific interactions between the cationic surfactants and the surface diminish when the number of charged sites at the surface increases because of an increase in salt concentration and pH values. Those findings suggest that the hydrophobic interactions between the aliphatic chains and the surface play an important role, as well as during surfactant aggregation at the silica/water interface (6, 7).
Because of the surface activity and self-assembly properties of surfactants, they have been widely used in a variety of applications including pulp and paper production, the food industry, paints, lacquers and plastics, mining, flotation and petroleum production, textiles and fibers, cosmetics and pharmaceuticals, agrochemicals, the leather and fur industry, as well as in detergents and cleaners (8). Due to the extensive use of surfactants, their release into the environment is ubiquitous. The environmental fate of these compounds is then determined in part by their interactions with mineral surfaces and natural organic matter found in soils.
The discharge of surfactants into sewage-treatments plants and as a consequence their dispersion into the environment and surface water effluents and sludges is ubiquitous. The surfactant toxic effects are determined in part by the final concentration reached in the aquatic medium and the degradation capacity through microbial activity. However, the biodegradation process products might bioaccumulate and their long-term effects require further studies (9).
4
In addition, Olkowska et al. presented evidence of surfactant contamination in different ecosystems under the influence of anthropogenic activities and how atmospheric deposition can eventually enable the migration of anionic, nonionic and cationic surfactants into the environment. According to those results, in regions considered to have low human activity, high quantities of surfactants were measured through monitoring of depositions such as run-off water, atmospheric precipitation, dew, and snow (10).
1.1 Cationic alkylammonium surfactants
Quaternary alkylammonium salts are a common type of cationic surfactant and are usually synthesized from either fatty acid or petrochemical sources (11), the positive charge arises from the nitrogen atom containing four alkyl substituents. An important property of this type of surfactant is the existence of a positive electric charge, which remains under acidic, neutral and alkaline conditions (3). Dodecyltrimethylammonium chloride (DTAC) is an alkylammonium surfactant with an aliphatic saturated chain of 12 carbons and three methyl substituents linked to the nitrogen atom (Figure 1.1).
Figure 1.1 Molecular structure of dodecyltrimethylammonium chloride.
Previous studies have investigated the behavior of DTAC and its analogous bromide DTAB, in colloidal systems and the adsorption of cationic surfactants into environmental matrices (12, 13). Quaternary alkylammonium surfactants are often electrostatically attracted to natural
-5
surfaces and materials, such as clays and (oxy)hydroxides, which typically contain an intrinsic negative charge. As a consequence, and depending on the surfactant concentration in the medium, the hydrophobicity of mineral interfaces in the environment is modified by surfactant adsorption, which leads to not only the retention of surfactants in the soil but also impacts the mobility of other xenobiotic substances, such as the polycyclic aromatic hydrocarbons (14).
DTAC and DTAB surfactants are used in Enhanced Oil Recovery operations (EOR). Salehi et al. performed a mechanistic study to describe the wettability alteration by DTAB adsorption to oil-wet carbonate rocks. According to those results, the cationic surfactant forms ionic pairs with the acidic components of crude oil. Once the ion-pair forms, the crude oil components adsorbed at the rock surface are removed, exposing the originally water-wet carbonate rock. These wettability changes are described in terms of imbibition where a wetting fluid (water) displaces a non-wetting fluid (oil) on the electrically charged rock surfaces. Thereby, fluids containing the cationic surfactant DTAB increase the recovery efficiency in surface carbonate rocks, due to oil displacement increasing the oil concentration in the fluidic phase recovered at the end of a hydraulic fracturing operation (15, 16). Therefore, the surfactant adsorption at the mineral surfaces in EOR is equally important to better understand the wettability changes at solid/liquid interfaces.
1.2 Silica surface properties
Although some studies regarding adsorption phenomena have elucidated the thermodynamics of how a solute interacts with a substrate under certain specific conditions (i.e. in an aqueous media and in the presence of electrolytes), there is a lack of information concerning how
6
changes in solvent structure and surface charge might direct solute adsorption. Such is the case for the silica surface when it is in contact with an aqueous medium at different pH values (17).
As previously stated, the interaction of mineral surfaces with cationic surfactants is charge dependent, where the pH of the solution plays an important role not only in determining surfactant ionization but the surface charge of minerals as well. In this section some properties of the silica surface are discussed. Silica is one of the most abundant mineral oxides in nature (18) and more specifically in sandstone oil reservoirs (19), which are often a target of EOR operations.
The bulk silica structure is formed by siloxane units joined in a tetrahedral lattice. At the surface, the identity and distribution of the functional groups present depends on the conditions used to treat the surface such as the temperature, and when the silica is in solution, the pH and the concentration of electrolytes. Particularly, acid/base reactions at the silica/water interface are fundamentally important because the relative concentrations of the neutral silanol (-SiOH) and the ionized sites (-SiO- or SiOH2+) determine the net surface
charge, which influences the adsorption of other species such as metallic cations and cationic surfactants. Using second harmonic generation, a nonlinear optical technique sensitive to surface charge, Ong et al. determined the interfacial charge density at the silica/water interface for a range of pH values and obtained two pKa values for the silanol groups on the silica surface (20). According to this study, the first pKa was determined to be 4.5 and corresponded to 19% of the silanol sites whereas the second pKa was 8.5 and corresponded to the remaining 81% of the surface sites. Similarly, the experiments performed confirmed that the surface
7
potential is a function of pH with a maximum interfacial potential of 140 mV at pH 12 and in the presence of 0.5 M NaCl. On the other hand, at lower ionic strength the maximum surface potential was larger confirming that the presence of salt acts to screen the electrostatic field resulting from the negatively charged sites at the silica/water interface (20).
The presence of two pKa values for the silica surface is characteristic of a diprotic acid and those pKa values are associated with two different hydrogen bonding environments of the silanol sites (21). According to Ong et al., the isolated surface silanol groups correspond to the acidic pKa value (~ 4.5). The second pKa of 8.5 was attributed to silanols that are hydrogen bonded to neighbors (17, 22). In addition, Meties and co-workers have reported that 15 % of the silanol sites had a pKa of 5.5 whereas the remaining 85% have a pKa of 9.0, using potentiometric titrations measurements, which correlates with the results described previously by Ong et al (23).
The two pKa model proposed by Ong et al was based on experiments performed at high electrolyte concentration (0.5 M NaCl), but under low electrolyte concentration, the starting pH determines the number of the silanol sites observed. Darlington et al. established that at 0.01 M NaCl and starting at a pH value of 7, two detectable pKa values were observed at 3.8 ±0.1 and 8.6 ± 0.1. On the other hand, when starting the titration under alkaline conditions (pH 12), three pKa values were observed at 3.8 ± 0.3, 5.2 ± 0.5 and 9.6 ± 0.6. Furthermore, with a starting acidic pH value (pH 2) a slow SHG response was observed until a bulk pH of 4 and two pKa values of 5.3 ± 0.5 and 9.6 ± 0.6 were observed (21).
8
The pH value at which the net surface charge is equal to zero or the point of zero charge (PZC) of silica is between 2 and 4 (24). This means that at pH values lower than 2 the silica surface will be charged positively whereas at pH values higher than 4 the density of negatively charged sites is greater than the density of positively charged sites and thus the overall surface charge is negative (18). In this manner, the pH of the aqueous media determines the chemical nature of the substrate as well as the nature of the adsorbed compounds.
1.3 Adsorption of cationic surfactants at the silica/water interface
As mentioned above, the adsorption of charged species at the silica/water interface is pH dependent, because this parameter as well as the ionic strength of the solution will determine the electrostatic attraction between the surface sites and the charged adsorbates. Zhang and Somasundaran proposed a model to explain ionic surfactant adsorption on oppositely charged surfaces (25). It is named the Somasundaran-Fuerstenau model and it describes the interaction in four regions which are schematized in figure 1.2. The first region is characterized by the electrostatic adsorption of the charged head of the surfactant at the charged surface site, and this process is described by the Gouy-Chapman model, where the charge density is related with the electrostatic potential at the charged interface. In this region, the hydrocarbon chains of the surfactant do not have a preferential orientation and they might interact with hydrophobic sites at the surface. In the second region, when the surfactant concentration at the interface increases, the lateral interaction between the hydrocarbon chains increases leading to the formation of primary aggregates termed as hemimicelles (25). At this point of the isotherm, and because of the orientation of the hydrocarbon chains towards the bulk solution,
9
the surface is rendered hydrophobic or oil-wet. Evidence supporting this orientation of the hydrocarbon chains at this intermediate surfactant concentration has been presented by Hou et al. They performed contact angle and ζ potential experiments to study the adsorption of the cationic surfactant cetyltrimetylammonium bromide (CTAB) on a quartz surface at neutral pH. According to their results, there is an increase in the contact angle measurement resulting from a compact monolayer formed at the interface, which is accompanied by an increase in the ζ potential values (26).
In the third region of the Somasundaran-Fuerstenau adsorption isotherm, as the solution phase surfactant concentration increases, the adsorption mechanism is driven by the hydrophobic forces between the adjacent hydrocarbon chains rather than the electrostatic attraction between the head of the surfactant and the charged sites at the surface. At this surfactant concentration, the surface charge is near zero. Finally, in the fourth and last region of the isotherm, the surfactant monomer concentration in solution is approximately constant due to the monomer-micelle partitioning equilibrium and the adsorption density does not change because of the saturation of the surface with surfactant. The surfactant concentration at which the slope changes between the third and the fourth regions of the isotherm is approximately equal to the critical micelle concentration (CMC) of the surfactant. The CMC strongly depends on solution conditions such as the ionic strength, the pH, the temperature and the identity of the counter– ions present in the solution. When micelle formation takes place, the electrostatic repulsion between the charges on the surfactant molecules increases, but in the presence of electrolyte, the counter-ions decrease the repulsive interaction by screening the surfactant headgroup charge at the micelle surface allowing closer packing of the hydrocarbon chains. Velegol et al.
10
studied the effect of changing the identity of the counter-ion present in solution on surfactant interfacial structure by comparing CTAB with its analogous chloride CTAC. Atomic force microscopy images of CTAB and CTAC on silica showed that if the counter-ion is bromide and at a surfactant concentration 10 times the CMC, the aggregates are “worm-like” micelles adsorbed at the silica surface, whereas for CTAC at the same surfactant concentration the aggregates are circular projections (27). Hence the counter-ion clearly influences the size and the shape of the adsorbed aggregates.
Figure 1.2 The four-region Somasundaran-Fuerstenau adsorption isotherm for ionic surfactants at charged surfaces. Further description in the main text.
Correlating the four region adsorption isotherm for ionic surfactants and in particular the third and fourth regions with experimental evidence, Hou et al. found that the contact angle decreases gradually in these regions for CTAB adsorbed on silica. This is attributed to the formation of a compact bilayer in which the hydrocarbon chains are buried in the adlayer and are not in direct contact with water rendering the surface more hydrophilic. ζ potential
11
measurements performed on the same system increased dramatically becoming more positive as the second layer of the aggregate facing the bulk solution was formed (26).
1.4 Sum Frequency Generation
Vibrational Sum Frequency Generation is a nonlinear optical spectroscopic technique with an inherent specificity to noncentrosymmetric systems used commonly to study surfaces and interfaces. To produce the SFG signal, two high energy laser beams, one with a fixed visible frequency ωVIS and a tunable infrared beam ωIR, are combined in time and space to produce a third beam which has a frequency that is the sum of the incident frequencies (ωSFG = ωVIS + ωIR). At non-charged interfaces, the SFG intensity is proportional to the square of the surface nonlinear susceptibility χ(2) and the second order polarization PSFG.
𝐼𝑆𝐹𝐺 ∝ |𝑃𝑆𝐹𝐺|2 ∝ |𝑋
𝑁𝑅(2)+ ∑ 𝑋𝜈 𝑅,𝜈(2)| 2
𝐸𝑉𝐼𝑆𝐸𝐼𝑅 Eq.1.1 Where (2)NR and (2)R represent the nonresonant and resonant components or the second order susceptibility (2), and EVIS and EIR are the electric fields generated by the visible and the infrared frequencies respectively (28, 29). The second order resonant susceptibility, (2)R, is proportional to the number density of molecules, N, and the orientationally averaged polarizability <α2>. This last term is presented in angular brackets to indicate the average of the molecular orientations at the interface (30).
𝑅(2) = 𝑁〈𝛼〉 Eq. 1.2 Thus, the square root of the SFG intensity is proportional to the density of molecules at the interface. The second order resonant susceptibility can be modeled as follows
12 𝑅(2)𝛼 ∑ 𝐴𝜈
𝜔𝜈 − 𝜔𝐼𝑅− 𝑖𝛤𝑉
𝜈 Eq 1.3
Where Aν is the amplitude of the vibrational mode ν, ων is the resonant frequency, ωIR is the IR
frequency and Γν is the line width of the transition (29). As it was stated before, SFG will be
active only for molecules or vibrational modes without an inversion center, i.e. noncentrosymmetric systems. Previous studies of surfactant monolayers at interfaces (air/water (29), solid/water (31, 32), and oil/water (33)), have revealed that when the surfactant alkyl chains are in an all-trans conformation, they possess a local inversion center rendering the CH2 stretches SFG inactive. If the conformation of the surfactant chain is locally
noncentrosymmetric and forms what is known as a gauche defect, then the SFG vibrational modes become active. The ratio of the methylene and methyl stretches is therefore used as an indicator of the degree of conformational order in monolayers studied by SFG (29, 31, 34, 35).
At charged interfaces, there is a contribution from the third order polarization of the interface, which arises from the electrostatic field Eo.
𝑃𝑆𝐹𝐺𝛼 (2)𝐸𝑉𝐼𝑆𝐸𝐼𝑅+ (3)𝐸𝑉𝐼𝑆𝐸𝐼𝑅 ∫ 𝐸0 𝑑𝑧 𝐸𝑞. 1.4 ∞
0
The presence of this electrostatic field aligns the orientation of the water molecules in the interfacial region due to the strong permanent dipole in water, and accordingly the centrosymmetry of the interfacial region is reduced. Thus, this third order contribution to the SFG intensity increases when the interface is electrically charged, because the electrostatic field would align the interfacial water molecules resulting in a more significant contribution to the nonlinear polarization (29).
13
The study of molecular aggregation at interfaces is challenging in the sense that the techniques utilized should provide a sensitive and selective response that is able to differentiate the interfacial region from the bulk solution. Vibrational nonlinear spectroscopy techniques including Second Harmonic Generation (SHG) and SFG offer a powerful tool to describe interfacial phenomena due to their intrinsic specificity for noncentrosymmetric systems. One of the most important applications of surfactants lie in the petroleum industry where surfactants are used during the oil recovery process to change the wettability of mineral surfaces in sandstone reservoirs as well as the viscosity and permeability of the fluids containing the oil. The aim of this research project is to study the adsorption of a cationic surfactant, dodecyltrimethylammonium chloride (DTAC) at the silica/water interface with the spectroscopic technique Sum Frequency Generation over a range of pH varying from 3 to 11 and at a salt concentration pertinent to hydraulic fracturing fluids (100 mM NaCl).
14
Chapter 2 Article
The article presented in this chapter was submitted to publication on June 24th 2015 and published on September 23th 2015 in the Journal of Physical Chemistry C. The second author of this article, Mathilde Chaveau, was an intern during the summer of 2014. She developed the contact angle experiments as well as the interfacial tension measurements presented in the section 2.3.1. As first author, I performed the SFG experiments and wrote the article with the supervision of my research director Prof. Patrick L. Hayes. The article has been slightly modified in order to be compatible with the entire thesis.
DOI: 10.1021/acs.jpcc.5b06058
15
MACROMOLECULAR STRUCTURE OF DODECYLTRIMETHYLAMMONIUM CHLORIDE AT THE SILICA/WATER INTERFACE STUDIED BY SUM FREQUENCY GENERATION SPECTROSCOPY
L. Lorena Torres,† Mathilde Chauveau,‡ and Patrick L. Hayes*,†
†Department of Chemistry, Université de Montréal, 2900 Boulevard Édouard-Montpetit, Montreal, Quebec H3T 1J4, Canada.
‡Institute Universitaire de Technologie du Mans, Université du Maine, Avenue Olivier Messiaen, 72085 Le Mans, France.
16 2.1 ABSTRACT
Adsorption of the cationic surfactant dodecyltrimethylammonium chloride at the silica/water interface was studied using sum frequency generation (SFG) spectroscopy under high ionic strength (100 mM NaCl) and at pH values ranging from 3 to 11, which are conditions relevant to hydraulic fracturing in enhanced oil recovery operations. At surfactant concentrations above the critical micelle concentration, SFG spectra of the CH stretching region indicate a more noncentrosymmetric structure for the surfactant aggregate is formed at the interface under acidic or basic conditions compared to neutral conditions. The SFG spectra also indicate a change in the packing/ordering of the surfactant hydrophobic tails with pH as well. In addition, the observed changes in the SFG spectra of water upon the addition of surfactant vary depending on the pH. At pH 7 and 11, the SFG intensity decreases in the OH stretching region, indicating a decrease in the magnitude of the electrostatic potential at the interface when the cationic surfactant is adsorbed at the negatively charged silica/water interface. At pH 3, an increase in the SFG intensity in the OH stretching region is attributed to an increase in the electrostatic potential at the silica/water interface due to the adsorption of a positively charged surfactant at a pH value close to the point of zero charge for the silica surface. These results demonstrate how the pH can influence the macromolecular structure of surfactants at mineral/water interfaces through the corresponding changes in the interfacial charge density and interfacial potential. In particular, we discuss how an unequal density of surfactants on each side of the interfacial bilayer or the adsorbed micelles may exist under either acidic or basic pH conditions.
17 2.2 INTRODUCTION
Surface modification using surfactants is pertinent to numerous commercial products and industrial processes, including pharmaceuticals, mineral ore flotation, pesticides, domestic hygiene products, and enhanced oil recovery (36-39). In these examples, surfactants are used to modulate interfacial properties such as wetting and colloidal stability (40). Quaternary ammonium surfactants are cationic amphiphilic compounds in which the nitrogen atom is charged positively, and these cationic surfactants are commonly used as wetting agents in a variety of technologies, including in enhanced oil recovery where they are an additive in hydraulic fracturing fluids (41). Thus, understanding the interactions of quaternary ammonium surfactants with mineral/water interfaces is fundamentally important for the optimization of hydraulic fracturing fluids and other technologies. For example, if surfactants irreversibly bind to mineral/water interfaces and cannot be recovered during a hydraulic fracturing project, then the cost of the project may be prohibitive (42). In addition, if the chemicals used in hydraulic fracturing are released into the environment (43), then their fate will be determined, in part, by interactions with environmental interfaces (12, 44).
Silica is one of the most abundant minerals in the earth’s crust (18) and hydrocarbon reservoirs (19). When in contact with water, the silica surface has an intrinsic surface charge that depends on the bulk pH, with the surface silanol groups becoming negatively charged at pH values greater than the point of zero charge (PZC).
𝑆𝑖𝑂𝐻 + 𝐻2𝑂 ⇌ 𝑆𝑖𝑂−+ 𝐻
18
The PZC of the silica surface is generally located at pH values between 2 and 4 (24). According to nonresonant second harmonic generation studies of the silica/water interface performed by Ong et al., two pKa values (4.5 and 8.5) were found for the deprotonation of the silanol sites (20). The lower pKa value has been attributed to silanol groups associated with weakly hydrogen-bonded water, whereas the higher pKa value has been attributed to silanol groups associated with strongly hydrogen-bonded water (45). The relative surface concentration of these two sites depends on the electrolyte present in solution, but for NaCl, which is used in this study, the fraction of sites deprotonated at pH 7 is 20% (20, 45).
The influence of salt on the structure of water at mineral/water interfaces has been previously demonstrated in both experimental (46-48) and computational (49) studies. In general, the addition of salt leads to disruption of the hydrogen-bond network near the interface, and it also screens the static electric field from the charged silica surface. This screening leads to a shorter Debye length, which defines the depth of penetration of the static electric field into the adjacent aqueous solution. In the context of this study, the addition of salt also impacts the macromolecular structure of ionic surfactants by reducing the critical micelle concentration (CMC) via screening of the repulsion between the surfactant headgroups.
In the limiting case of very low surfactant concentrations, adsorption of a cationic surfactant on silica occurs due to the Coulombic attraction between the surfactant headgroups and the silica surface sites (31). As a consequence, the net surface charge will decrease and the hydrophobicity will increase. Once a certain concentration of surfactant is reached, aggregates
19
form (50). Different measurement techniques have been used to constrain the possible macromolecular structures of surfactant aggregates at solid/liquid interfaces, including atomic force microscopy (27) and neutron scattering (51). In addition, the nonlinear optical technique sum frequency generation (SFG) spectroscopy has emerged as an important method for characterizing surfactant adsorption due to its sensitivity to the symmetry of the surfactant aggregation (e.g., monolayer versus bilayer), and its surface specificity, which allows the vibrational spectrum of the interfacial species to be measured.
Although previous papers have described the macromolecular structure of cationic surfactants on silica at concentrations near the CMC,(27, 31) there is a lack of research investigating how the pH changes the aggregate structure in which techniques such as SFG are used to directly probe the surfactant at the solid/liquid interface. The pH is an important parameter in many different surfactant-containing technologies, including enhanced oil recovery (52), which potentially could alter the macromolecular structure of adsorbed surfactants through electrostatic interactions. Indeed, two previous studies of alkylammonium surfactant adsorption on silica, one at pH 11 and the other under neutral conditions (pH ≈ 5.5), exhibited very different SFG spectra in the C−H stretching region (31, 53). Under basic conditions, C−H resonances were observed, indicating the formation of asymmetric aggregates, whereas, under neutral conditions, no such resonances were observed, which indicates the formation of symmetric aggregates. While the pH and the corresponding differences in the silica surface charge are a plausible explanation for the observed differences, it is not possible to make a confident conclusion regarding the role of the pH because there are other differences between
20
the two studies that are confounding variables (i.e., the ionic strength and counterions present in solution).
To address this unresolved question, the adsorption of the alkylammonium surfactant dodecyltrimethylammonium chloride (DTAC) at the fused silica/water interface is systematically studied here over a range of pH values using SFG for the first time (to our knowledge). In addition, contact angle and interfacial tension measurements are used as a complement to the SFG experiments. Experiments are carried out at high ionic strength (0.1 M NaCl) because surfactant-containing hydraulic fracturing fluids often contain high concentrations of salt, and it has been well demonstrated by the papers discussed in the Introduction that the addition of salt can change the water structure in the interfacial region as well as influence surfactant aggregation. Furthermore, the addition of a background electrolyte minimizes the change in ionic strength when the pH is adjusted, allowing the effect of the pH to be better separated from the effect of the changing ionic strength.
Ultimately, the goal of this work is to better characterize the pH-dependent adsorption and macromolecular structure of surfactants at interfaces, which until now had not been systematically investigated using SFG spectroscopy. The interfacial macromolecular structure is fundamentally linked to the amount of surfactant adsorbed and the wettability of a surface, both of which are important to optimizing surfactant-based technologies (42, 54). In addition, the structure of water in the interfacial region is investigated, which has important implications for mineral reactivity, including dissolution and adsorption (44).
21 2.3 EXPERIMENTAL SECTION
2.3.1. Contact Angle and Interfacial Tension Measurements. A First Ten Angstroms (FTA 200) flexible video system was used to measure sessile contact angles on fused silica slides (Chemglass, CGQ-0640-01), as well as the interfacial tension via the pendant drop method. The slides were cleaned following the same procedure used for the fused silica windows analyzed in the SFG experiments, and this procedure is described in the next subsection. The CMC at different pH values and in the presence of 100 mM NaCl was determined from the interfacial tension measurements as discussed in section 2.4.1.
2.3.2. Materials and Reagents. The DTAC solutions (Sigma-Aldrich, 99.0+%) were prepared in Millipore water (18.2 MΩ cm at 25 °C, TOC (total organic carbon) ≤ 3 ppb) or D2O (CDN
Isotopes, 99.9 atom % D), and the pH or pD was adjusted with NaOH (Sigma-Aldrich, 99.99%), NaOD (Sigma-Aldrich, 40 wt % in D2O, 99.5 atom % D), HCl (EMD, Omni Trace),
and DCl (Sigma-Aldrich, 35 wt % in D2O, 99 atom % D) solutions. For the deuterated
surfactant experiments, DTAB-d25 (dodecyl-d25-trimethylammonium bromide; CDN Isotopes,
99.1 atom % D) was used. NaCl (Merck, 99.5%) was used to prepare the solutions with added salt. Prior to each experiment, an IR-grade fused silica window (ISP Optics, QI-W-38-3) and the slides for contact angle measurements were cleaned by being rinsed with Millipore water and then HPLC-grade methanol. The window and the slides were then dried at 100 °C for 2 h and plasma cleaned for 5 min at 400−800 mTorr of oxygen. It should be noted that there are some minor compositional differences between normal and IR-grade fused silica, most importantly the reduced concentration of hydroxyl ion in the IR-grade fused silica. However,
22
in the presence of water, both silica surfaces are generally expected to terminate in hydroxyl groups, which can be protonated or deprotonated (45, 55).
A thin film of PMMA (poly(methyl methacrylate); MW 35000, Acros Organics) was deposited onto an IR-grade fused silica window, and the SFG spectrum at the silica/air interface was collected before and after each DTAC experiment. The maximum of the SFG peak corresponding to the CH symmetric stretch of the methoxy group in the polymer, which is nominally located at 2955 cm−1, was used to calibrate the frequency. The same experimental geometry and alignment were used for this calibration and the DTAC studies (53, 56). The DTAC solutions were contained in a custom-built Teflon reservoir, and the IR-grade fused silica window was clamped on the open top of the reservoir and sealed with a Viton O ring. Before the DTAC experiments, the sample cell was rinsed three times with the solution containing the surfactant. Aqueous DTAC, or DTAB-d25, solutions were introduced into the
reservoir using a pipet and allowed to equilibrate for 20 min. All the experiments, including the SFG experiments, were carried out in duplicate to verify the reproducibility of the experiments.
The pH of each solution was adjusted with dilute solutions of NaOH and HCl or with their deuterated analogues, and the pH was measured with a pH meter (Orion Star A121, Thermo Scientific). The solutions were prepared and the pH was adjusted the day before the experiments were carried out to allow for equilibration with ambient CO2. For multiple
samples spanning the range of pH values used here, the pH value was verified after the samples were allowed to sit overnight in sealed bottles. In general, the change in pH was
23
negligible compared to the broad range of pH values used in these experiments and less than 0.5, indicating that CO2 dissolution did not substantially alter the pH of the samples.
2.3.3. SFG Spectroscopy. SFG spectroscopy is a nonlinear optical technique that allows the measurement of vibrational spectra with a high level of interfacial specificity. In the SFG experiment, two pulsed laser beams are overlapped on a sample, a visible beam with frequency ωvis and an infrared beam with tunable frequency ωIR, producing a third beam with a
frequency that is the sum of the incident frequencies (ωSFG = ωvis + ωIR). The vibrational
spectrum is measured by tuning the IR frequency and measuring the SFG intensity, which is enhanced when the IR frequency approaches the vibrational resonances of a molecule at the interface (35, 57). At an uncharged interface, the intensity of the emitted SFG light (ISFG) is
proportional to the second-order nonlinear susceptibility of the interface (χ(2)). However, for charged interfaces, such as the silica/water interface at pH values not equal to the PZC, the SFG intensity will also contain a contribution from the third-order susceptibility (χ(3)) (46, 47). The total SFG intensity can then be expressed as
𝐼𝑆𝐹𝐺 𝛼 |(2)𝐸𝑣𝑖𝑠𝐸𝐼𝑅+(3) 𝐸𝑣𝑖𝑠𝐸𝐼𝑅∫ 𝐸0∞ 0(𝑧)𝑑𝑧| 2
Eq. 2.2 where Evis and EIR are the visible and IR electric fields, E0 is the static electric field, and z is
the distance normal to the interface. Furthermore, the second- and third-order susceptibilities are proportional to the number of molecules at the interface (N) and to the second- and third-order polarizabilities (⟨α(2)⟩ and ⟨α(3)⟩). The angular brackets in the equation below indicate
that the polarizabilities are averaged over the molecular orientations (30):
24
Within the electric dipole approximation, ⟨α(2)⟩ is nonzero only in noncentrosymmetric and
ordered environments, whereas ⟨α(3)⟩ is nonzero in isotropic environments and increases in
magnitude in ordered noncentrosymmetric environments (47).
For the silica/water interface, only the interfacial region is noncentrosymmetric, and the second-order contribution is therefore inherently interface specific due to anisotropic forces that lead to polar alignment of molecules. With respect to the third-order contribution, in principle, the interface specificity of this contribution is defined by the penetration depth of E0
into the aqueous phase. The Debye length is a metric for this depth, and for the high ionic strengths used in this study (i.e., 100 mM NaCl), it is equal to ∼1 nm. Therefore, the SFG spectrum of the charged interface which arises from both the second- and third-order polarizations will be highly selective for the interfacial region.
As shown in the following equation, SFG spectra are often modeled using a constant nonresonant background and a serie of Lorentzian functions for the frequency-dependent resonant response (30). ISFG(ωIR) = |ANR+ ∑ A ω− ωIR− i | 2 Eq. 2.4 Here, ANR is the amplitude of the nonresonant contribution, Aν and ων represent the amplitude
and the frequency of the resonant mode ν, and Γν is a damping constant. While Eq 2.4 does not
explicitly account for the second- and third-order contributions to the SFG spectrum, the nonresonant and resonant terms could arise from the second- and/or third-order polarization.
25
The scanning SFG system (EKSLPA) consists of a PL2241 series picosecond laser that generates fundamental (1064 nm) and second harmonic (532 nm) beams that pump a PG501/ DFG parametric generator, which produces an IR beam that was tuned from 2700 to 3850 cm−1. The 532 nm and tunable IR lasers were directed through an IR-grade fused silica window and overlapped in time and space at the solid/liquid interface with incident angles of 49° and 55° from the surface normal (after refraction) for the visible and IR beams, respectively. The generated SFG signal is isolated using optical filters and a monochromator and is then detected by a photomultiplier tube. All SFG spectra are measured by monitoring the s-polarized SFG field generated by s-polarized visible light and p-polarized IR light. SFG spectra were collected with acquisition times ranging between 1 and 2 h per spectrum. The SFG data for each spectrum were normalized by dividing the SFG intensity at each wavelength by the product of the visible and infrared energies, which were monitored during the experiments using calibrated photodiodes and beam splitters.
2.4 RESULTS AND DISCUSSION
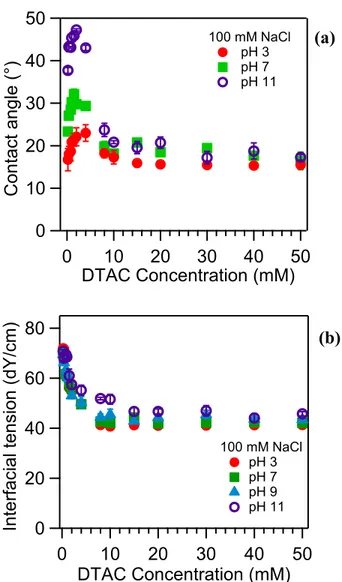
2.4.1. Contact Angle and Interfacial Tension Measurements. Figure 2.1a presents contact angle measurements on fused silica slides at pH 3, 7, and 11 with 100 mM NaCl. For all three pH values, at low surfactant concentration, the contact angle increases until a DTAC concentration of about 2 mM. According to Young’s equation (58), this trend indicates the adsorption of a hydrophobic monolayer of surfactant beyond the contact line, which decreases the interfacial tension at the silica/air interface, and/or the formation of hydrophobic domains at the silica/water interface, which increases the interfacial tension at this interface. Once the
26
maximum value for the contact angle is reached, the contact angle decreases to 15° asymptotically. This result is consistent with the formation of a bilayer (i.e., an extended planar bilayer or packed adsorbed micelles) at high surfactant concentrations, since much higher contact angles would be expected if the hydrophobic tail of the surfactant were exposed to the water (59).
Previous work on cetyltrimethylammonium bromide (CTAB)-an alkylammonium surfactant with a hydrophobic chain that is four carbons longer than that of DTAC-using ζ potential measurements as well as ellipsometry has suggested that at a certain concentration a surfactant monolayer forms at the silica/water interfaces due to electrostatically driven adsorption (26). The hydrophobic chains of the surfactant molecules in the monolayer are exposed to the aqueous phase, leading to the observed increase in the contact angle. When the concentration of surfactant continues to increase, a compact bilayer may be formed with the hydrophilic headgroup now pointed toward the aqueous phase, which leads to a decrease in the contact angle. However, this proposed explanation for the change in wettability does not agree with an earlier study that indicates CTAB only forms centrosymmetric macromolecular structures at the silica/water interface (31). The reasons for this difference are not entirely clear, although both studies agree that bilayers exist at high surface coverage. Ultimately, it is difficult to infer the structure at the solid/liquid interface using only the contact angle data presented here due to the well-known fact that the interfacial tensions for the solid/liquid and solid/air interfaces cannot be independently quantified. SFG measurements can help to resolve this uncertainty.
27
Differences in the contact angle at acidic, neutral, and basic pH are observed below approximately 10 mM DTAC. Surfactant adsorption is influenced by several different types of interactions such as surfactant−surface electrostatic attraction as well as surfactant−water hydrophobic interactions. At pH 3, which is near the PZC, surfactant adsorption on the silica surface will be less favorable due to the reduced electrostatic attraction. Increasing the pH leads to higher negative surface charge density, which likely results in increased surfactant
50 40 30 20 10 0 Con ta ct a n g le (°) 50 40 30 20 10 0 DTAC Concentration (mM) 100 mM NaCl pH 3 pH 7 pH 11 80 60 40 20 0 In te rfa cial t e n sion (dY /cm) 50 40 30 20 10 0 DTAC Concentration (mM) 100 mM NaCl pH 3 pH 7 pH 9 pH 11 (a) (b)
Figure 2.1 (a) Sessile contact angle measurements as a function of the bulk DTAC concentration with 100 mM NaCl on a quartz surface. (b) Interfacial tension at the solution/air interface determined by the pendant drop method.
28
adsorption due to the greater extent of surfactant− surface electrostatic interactions (60). Thus, at basic pH, the increased surfactant adsorption at the silica surface may be responsible for higher contact angles than observed at acidic and neutral pH values. However, at surfactant concentrations greater than 10 mM, the interface is saturated or nearly saturated with surfactant at all pH values, and thus, there is no change in contact angle with the pH. This reasoning is consistent with a previous optical reflectometry study on cetylpyridinium bromide that measured an increase in surfactant adsorption with increasing pH at low surface coverages but no change in the amount of adsorbed surfactant with increasing pH at high surface coverages (61).
Interfacial tension measurements were also performed on DTAC solutions with 100 mM NaCl at pH 3, 7, 9, and 11 (Figure 2.1b). For a given pH value, the CMC corresponds to the concentration at which the interfacial tension ceases to decrease with increasing surfactant concentration. Thus, the CMC at pH 3, 7, and 9 is 7 mM, whereas at pH 11 the CMC is 14 mM. To obtain these values, the data in Figure 2.1b were interpolated according to the method described by Rehfeld et al (62). The quaternary ammonium on the surfactant headgroup is positively charged regardless of the pH, and also the change in ionic strength with the pH is negligible due to the addition of 100 mM NaCl. Thus, the difference in the CMC at pH 11 relative to the more acidic pH values must be due to other factors. One possible explanation is the presence of OH− ions that adsorb to the surface of micelles and displace chloride ions. It is known that the identities of the counterions can influence the CMC of alkylammonium surfactants (27), although it is not possible to conclude definitively from the interfacial tension measurements that OH− adsorption is responsible for the change in CMC with the pH. Rather,
29
further experiments with a greater range of salt/OH− concentrations are needed using surfactant that has been recrystallized to remove trace impurities (e.g., amines which exhibit acid/base chemistry).
2.4.2. SFG Spectra of Adsorbed Surfactant. SFG experiments were carried out to characterize the interfacial vibrational spectrum of DTAC in the CH stretching region as a function of pD. These experiments for the CH stretching region were performed in D2O to
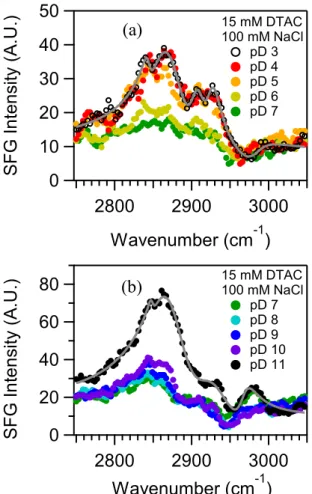
avoid overlapping between the CH and OH resonances of water. Figure 2.2 presents the SFG spectra collected at different pD values in the presence of 100 mM NaCl using 15 mM DTAC. The concentration of DTAC was selected to ensure that all experiments were performed at a concentration above the CMC and where the contact angles did not exhibit a dependence on the pH. The SFG spectra were collected starting at a pD of 7, and then the pD was either increased or decreased until a pD of 3 or 11 was obtained. In both cases, the CH resonances exhibit a minimum in relative intensity at pD 7, and the intensity increases as the DTAC solution becomes more acidic or more basic. A similar trend was also observed for experiments carried out at a DTAC concentration of 10 mM that will be included in a future paper that examines the SFG spectra as a function of the DTAC concentration. The increase in the SFG intensity with the addition of base is consistent with a study carried out by Tyrode et al (31) at near-neutral conditions where CH resonances were not observed for CTAB adsorbed at the silica/water interface in which the lack of peaks was attributed to the centrosymmetric structure of the aggregate, as well as a later study by Hayes et al (53) carried out at pH 11 that observed CH peaks in the SFG spectra for the same surfactant and interface. The SFG spectra
30
shown in Figure 2.2 indicate that the surfactant macromolecular structure at the silica/water interface becomes more noncentrosymmetric with the addition of acid or base.
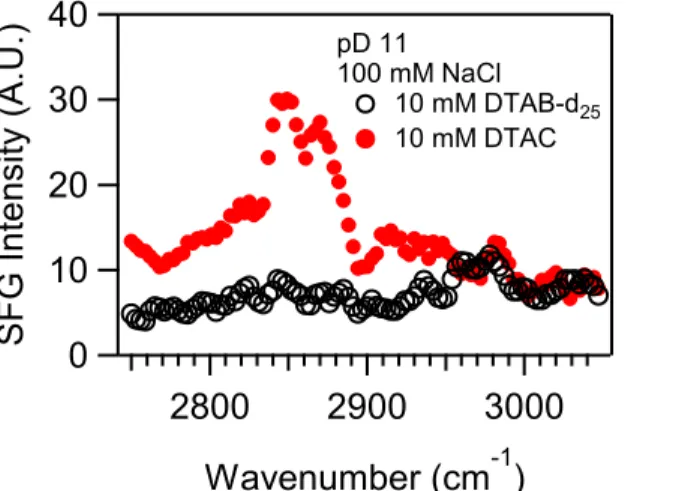
To analyze the SFG spectra in more detail, the peaks were assigned to CH stretching modes as summarized in Table 2.1 using the spectra at pD 3 and 11 that exhibited the best signal-to-noise ratios. The peak assignment was facilitated by comparing SFG spectra for DTAC and DTAB-d25 as shown in Figure 2.3. For DTAB-d25, which contains CH3 groups on the
50 40 30 20 10 0 S FG In te n sity (A. U.) 3000 2900 2800 Wavenumber (cm-1) 15 mM DTAC 100 mM NaCl pD 3 pD 4 pD 5 pD 6 pD 7 80 60 40 20 0 S FG In te n sity (A. U.) 3000 2900 2800 Wavenumber (cm-1) 15 mM DTAC 100 mM NaCl pD 7 pD 8 pD 9 pD 10 pD 11 (a) (b)
Figure 2.2 SFG spectra in the CH stretching region for the surfactant DTAC adsorbed at the silica/D2O interface as a function of the pD. The conditions for the experimental results shown in each panel are the following: (a) 15 mM DTAC and pD 3−7 and (b) 15 mM DTAC and pD 7−11. The solid lines indicate fits of eq 2.4 to the data using the peak assignments in Table 2.1 and the parameters summarized in Tables 2.2 and 2.3.
31
quaternary ammonium headgroup but a deuterated tail, only one very weak peak was observed at ∼2970 cm−1, which indicates that the peaks appearing at lower wavenumbers are due to the
methyl and methylene groups on the surfactant tail. For the DTAC spectra, the peaks observed
at 2967 cm−1 (pD 3) and 2982 cm−1 (pD 11) are thus attributed to the methyl symmetric stretch for the surfactant headgroup (31). Then the SFG peaks observed at ∼2845 and 2876 cm−1 are
assigned to the symmetric vibrational modes of the methylene and methyl groups of the surfactant tail, respectively. Continuing with the peak assignment, Fermi resonances of the symmetric stretches of the methylene and methyl groups of the tail were observed at 2907 and 2925 cm−1, respectively. The resonances found in the range between 2907 and 2982 cm−1 exhibit low intensities and low signal-to-noise ratios compared to the symmetric stretches, and therefore, the assignments of these resonances are relatively uncertain. In addition, whereas the methyl groups bonded directly to the nitrogen atom are spectroscopically resolved, there is no distinct peak for the methylene group adjacent to the nitrogen. The lack of distinct spectral features for this methylene could be due to the combination of both low SFG signals and small
40 30 20 10 0 S FG In te n sity (A. U.) 3000 2900 2800 Wavenumber (cm-1) pD 11 100 mM NaCl 10 mM DTAB-d25 10 mM DTAC
Figure 2.3 SFG spectra for DTAB-d25 and DTAC in the presence of 100 mM NaCl and at pD 11. The spectra were collected at the silica/ D2O interface. The weak peak at ∼2970 cm−1 in the spectrum of DTAB-d25 is attributed to the methyl asymmetric stretch for the surfactant headgroup.
32
shifts in the frequency of the vibrational resonances relative to the other methylene groups on the hydrophobic tail of the surfactant.
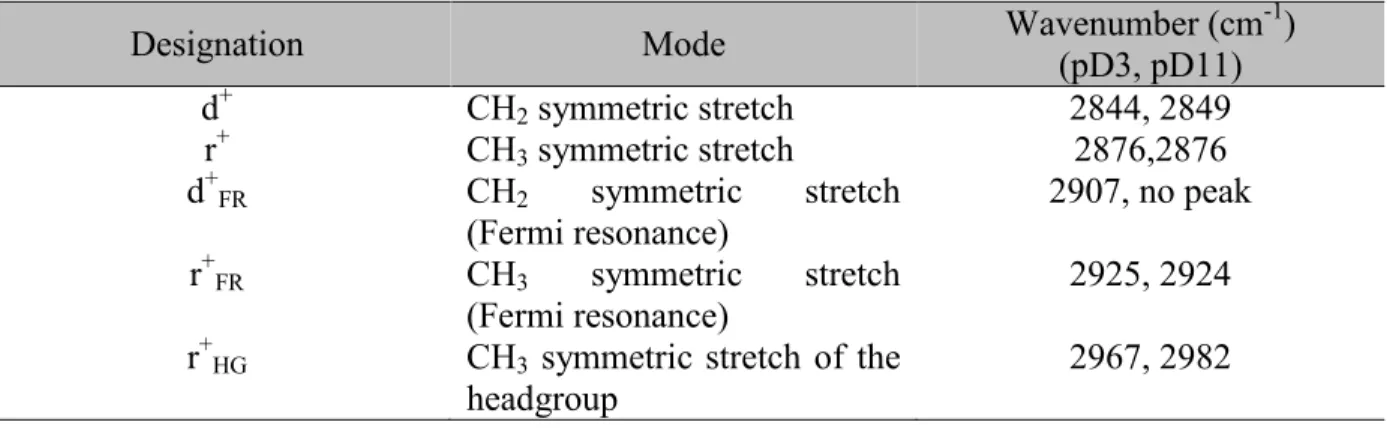
Table 2.1 Assignments for the CH Stretching modes of adsorbed DTAC (28, 31, 35, 53, 56). Designation Mode Wavenumber (cm(pD3, pD11) -1)
d+ CH2 symmetric stretch 2844, 2849 r+ CH3 symmetric stretch 2876,2876 d+FR CH2 symmetric stretch (Fermi resonance) 2907, no peak r+FR CH3 symmetric stretch (Fermi resonance) 2925, 2924 r+HG CH3 symmetric stretch of the
headgroup
2967, 2982
Focusing on the symmetric modes, the SFG spectra were fitted with Eq 2.4 in the range between 2750 and 2890 cm−1 to determine the amplitude of these modes. The results are presented in Figure 2.4. For the experiments from pD 7 to pD 11 (Figure 2.4b), the amplitudes for the methylene and methyl symmetric stretches increase with the pD, although the increase in the methyl symmetric stretch amplitude is within the estimated uncertainties of the fit. The observed trend is nevertheless consistent with an increasingly noncentrosymmetric macromolecular structure for the surfactant aggregate with respect to the surface plane (29, 31, 35, 63). Therefore, a possible explanation for the increase in the amplitude of the methylene and methyl stretches is an increasingly unequal density of surfactant molecules between the side of the bilayer (or adsorbed micelles) directed toward the aqueous phase and the side directed toward the silica.
33
It is known that when the surfactant is in an all-trans conformation at an interface, the more symmetric structure results in a weaker methylene intensity in the SFG spectrum compared to the case where the chains contain gauche defects. The difference in intensity is due to the oppositely oriented oscillators in the all-trans conformation leading to SFG contributions that destructively interfere. Therefore, the ratio of the methyl to methylene amplitudes can be used
0.1 0.0 S FG a m p litu d e (A. U.) 6 5 4 3 pD 15 mM DTAC 100 mM NaCl CH2 symmetric CH3 symmetric 0.2 0.1 0.0 S FG a m p litu d e (A. U.) 11 10 9 8 7 pD 15 mM DTAC 100 mM NaCl CH2 symmetric CH3 symmetric 3.0 2.0 1.0 0.0 CH 3 a m p / CH 2 a m p 6 5 4 3 pD 15 mM DTAC 100 mM NaCl 3.0 2.0 1.0 0.0 CH 3 a mp / CH 2 a mp 11 10 9 8 7 pD 15 mM DTAC 100 mM NaCl (a) (b) (c) (d)
Figure 2.4 Amplitudes of the CH stretching symmetric modes and the corresponding ratios of the amplitudes (CH3/CH2). Data are plotted as a function of the pD. The amplitudes were obtained using eq 2.4 to fit the spectra in Figure 2.2. Fits were carried out for the spectral range between 2750 and 2890 cm−1. The data displayed and the corresponding conditions for each panel are the following: (a) amplitudes between pD 3 and pD 6, (b) amplitudes between pD 7 and pD 11, (c) ratios between pD 3 and pD 6, and (d) ratios between pD 7 and pD 11. For panels a and c, the results at pH 7 are not presented because the signal-to-noise ratios of the CH resonances were not sufficient to accurately fit the data. Panels c and d are plotted on the same vertical scale to facilitate comparison of the results.