Serge-Étienne Parent and Alexandre Cabral *
1 Ph.D. candidate, Dept. Civil Eng., Univ. de Sherbrooke, Quebec, Canada E-mail: [email protected]
2 Professor, Dept. Civil Eng., Univ. de Sherbrooke, Sherbrooke, Quebec, Canada E-mail: [email protected]
* Author to whom all correspondence should be sent:
Département de génie civil, Faculté de génie, Université de Sherbrooke. 2500, boul. de l’Université, Sherbrooke, Québec, Canada J1K 2R1 Tel.: 819-821-7906; Fax: 819-821-7974
Parent, S-É and Cabral, A.R. (2006). Design of inclined covers with capillary barrier effect. Journal of Geotechnical and Geological Engineering 24:689-710.
Abstract. A design procedure is proposed to minimize water infiltration into landfills in optimizing the water diversion length of inclined covers with capillary barrier effect (CCBE). This design procedure aims at selecting materials and optimizing layer thickness. Selection among candidate materials is made based on their hydraulic conductivity
functions and on a threshold infiltration rate imposed on the designer. The capillary break layer (CBL; bottom layer) is characterized by a weak capillarity, while the moisture retention layer (MRL; upper layer) is characterized by a stronger capillarity. The thickness of the CBL corresponds to the height where suction reaches its maximum value for a given infiltration rate. This height can be calculated using the Kisch (1959) model. The optimal thickness of the MRL is determined by applying an adaptation of the Ross (1990) model. The results obtained using the proposed design procedure were compared to those obtained from numerical simulations performed using a finite element unsaturated seepage software. The procedure was applied for two cover systems; one where deinking by-products (DBP) were used as MRL and sand as CBL and another where sand was used as MRL and gravel as CBL. Using this procedure, it has been shown that an infiltration control system
composed of thin layers of sand over gravel is highly efficient in terms of diversion length and that its efficiency can be enhanced by placing a hydraulic barrier - such as a layer of DBP - above the MRL.
1 INTRODUCTION
Environmental problems related to waste management include leachate production from landfill facilities that contaminates soils and underground water. Capping closed landfills with low permeability covers have been current practice to limit water infiltrations through waste, hence to limit leachate production. In this purpose, covers with capillary barrier effect (CCBE) have been used as an alternative to classic cover designs (Barth and Wohnlich 1999, Stormont and Anderson 1999, von Der Hude et al. 1999). The capillary barrier effect is created when a fine textured soil is placed over a coarser one. The textural contrast between the upper layer material (called moisture retention layer, MRL) and the bottom layer material (called capillary break layer, CBL) controls vertical infiltration through the barrier by capillary forces.
Simple design procedures have been proposed to optimize layer thickness in flat or nearly flat CCBEs (e.g. Khire et al. 2000). In such cases, the CCBE functions as an
evapotranspirative cover. In the case of inclined covers - the object of this paper - the capillary barrier is designed to drain infiltrating waters downslope. When water infiltrates from the top of the MRL, it tends to accumulate downslope in the MRL, which prevents it from infiltrating into the CBL. However, when the capillary forces in the MRL can no longer hold any more water, any additional infiltration is transmitted to the CBL. This point happens at a critical distance from the top that can be estimated using a model proposed by Ross (1990).
In this paper, a procedure to design inclined capillary barriers is proposed to help to optimize material selection and layer thicknesses. The procedure, which is presented as a sequence of several steps, only requires the use of simple and common computer appli-cations, such as a spreadsheet and an appropriate compiler. The approach leads to a simple integrated model and a comprehensive approach allowing the development of new capillary barrier concepts.
The paper begins with a brief explanation of the phenomenology of the capillary barrier effect in one- and two-dimensional CCBEs and presents some models used to predict suction profiles across one-dimensional CCBEs. Using the latter concepts, different material combinations for the constitution of CCBEs were compared and a procedure is advanced to optimize material selection. The Ross (1990) model and results from numerical simulations using a finite element unsaturated seepage software were compared in order to calibrate the Ross (1990) model. Further numerical simulations were performed to
elaborate a framework that makes possible the optimization of layer thicknesses. Alternate designs were also investigated.
2 MATERIALS AND METHODS
The three main materials used in the present study were deinking by-products (DBP), Saint-Rosaire sand (SR-sand) and Clinton-gravel. DBP are produced in an early stage of the paper recycling process and have been used as alternative cover material for MSW facilities (e.g. Moo-Young and Zimmie 1996, Burnotte et al. 2000, Kamon et al. 2001) and as an
oxygen barrier for acid-generating mine wastes (Cabral et al. 1999b). The SR-sand and the Clinton-gravel are coarse-grained materials employed as capillary barrier components at the Saint-Rosaire (Canada) MSW facility (Parent 2003) and the Clinton mine waste site
(Cabral et al. 1999a), respectively. The water retention curve (WRC) and the hydraulic conductivity function (k-function) of DBP, SR-sand and Clinton-Gravel were determined by Parent (2003) and are shown in Figure 1.
The finite element software SEEP/W (Geo-slope 2002) was used to model unsaturated water seepage and pore pressure distribution across capillary barriers. This software has been used in many cover projects and the results obtained often show good agreement with field data (e.g. Choo and Yanful 2000). Hysteresis was not taken into account in any simulation. The solutions for the Kisch (1959) and the Ross (1990) models were obtained using the numerical computation software Matlab.
3 COVERS WITH CAPILLARY BARRIER EFFECT 3.1 Short review of previous studies
Covers with capillary barrier effect (CCBE) are landfill and mine tailings capping systems that exploit the capillarity phenomenon. They can be used as evapotranspirative covers for flat or nearly flat landfill covers (Nyhan et al. 1997, Khire et al. 2000), as lateral drains (Ross 1990, Kampf and Montenegro 1997) that limit percolation into the landfill, and as and oxygen barriers to limit the production of acid mine drainage (Nicholson et al. 1989, Cabral et al. 1999b, Bussiere et al. 2003). The efficiency of such covers have been
evaluated in the laboratory (Baker and Hillel 1990, Stormont and Anderson 1999, Tidwell et al. 2003, Tami et al. 2004), in the field (Aubertin 1997, Barth and Wohnlich 1999, von Der Hude et al. 1999) and by means of numerical simulations (Akindunni et al. 1991, Oldenburg and Pruess 1993, Webb 1997, Morris and Stormont 1999).
3.2 Suction profile in a one-dimensional capillary barrier
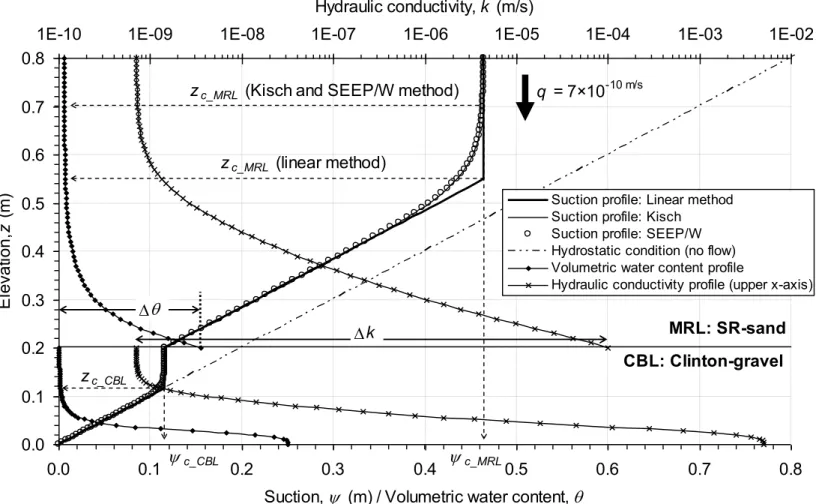
In porous materials, water percolates downward due to gravitational forces and is retained by capillary forces. In a capillary barrier, in addition to gravitational forces, water can be pulled down from the MRL into the CBL by the suction induced at the interface of the two layers. However, this will only occur when the suction level at the interface drops below the water entry value (suction corresponding to the residual water content in theWRC) of the CBL. Before this occurs, water will continue to accumulate in the MRL, leading to the water content profile presented in Figure 2.
The suction profile is key to the understanding of the capillary barrier effect. As a first step to explain how the suction profile develops in a capillary barrier, a one-dimensional
capillary barrier was examined (Figure 2). In hydrostatic conditions above the water table, i.e. where no flow crosses the capillary barrier, the pressure head decreases linearly (at 45°) with increasing height and the total head is null. If a vertical flow (or infiltration rate, q) is imposed to a sufficiently thick medium, the pressure head profile breaks away from the 45° line to become constant with height above zc (Figure 2).
Under steady-state infiltration conditions, the variation of suction with height can be predicted using the linear method (Bews et al. 1997) or the Kisch (1959) model. The linear method consists in the determination of the maximal suction value, c, existing in a porous
material submitted to an infiltration rate under a unit gradient, such that infiltration rate equals the hydraulic conductivity. This suction value can be determined graphically using the k-function, as shown in Figure 1, or with an iterative procedure to find the suction value corresponding to a specific hydraulic conductivity, (k). Once c has been determined, it is
supposed that suction increases linearly with elevation until it attains c (at elevation zc).
Above zc suction becomes constant.
In a capillary barrier, the suction at the lowest point of the MRL corresponds to the suction existing at the highest point of the CBL, in this case c_CBL. The maximal suction attained
in the MRL is c_MRL. Accordingly, the elevation from the base of the MRL where suction
becomes constant, zc_MRL, is calculated using Equation 1.
c MRL c CBL
w MRL c
z _ _ _ (1)
where w is the unit weight of water.
The linear method does not model the asymptotic behavior that is observed at elevations below zc, when suctions converge towards c (Akindunni et al. 1991). Alternatively, the
Kisch (1959) model can be used to determine suction profiles. Kisch (1959) combined Darcy’s law (q kdh dz), the Buckingham (1907) equation (h pz) and the k-function to describe the suction profile for a given q, as follows:
ψ dY Y k q ψ z 0 1 1 (2)where z is the elevation (m), is suction (m), q is the infiltration rate (m/s), k(Y) is the k-function (m/s) and Y is a dummy variable representing . The Kisch (1959) model can be solved using a finite element unsaturated seepage software or by means of any appropriate compiler, which give approximately the same results (Figure 2).
The suction profile across the capillary barrier permits to draw a hydraulic conductivity profile by means of the k-function (Figure 2). It can be observed that that a significant hydraulic contrast can occur between the MRL and the CBL materials (k in Figures 1 and 2). The low hydraulic conductivity of the CBL material causes this infiltrating water to move slowly downward.
3.3 Water diversion in CCBEs
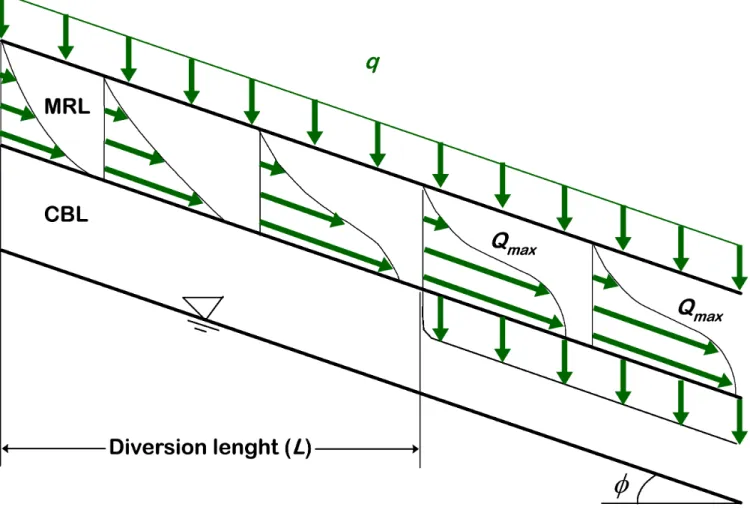
Water diversion is the two-dimensional phenomenon that describes the lateral drainage of water in the MRL of an inclined capillary barrier. If a vertical infiltration rate (lower than the saturated hydraulic conductivity of the MRL material) is applied uniformly along the top of the MRL, part of the infiltrating water will be retained in the MRL due to capillary forces whereas another part will drain laterally and accumulate downslope. The higher the hydraulic conductivity of the MRL, the easier it drains out the infiltrating water. According to Ross (1990), at a critical point along the interface, called breakthrough, capillary forces no longer retain the accumulated water and moisture starts to infiltrate into the CBL. This phenomenon is schematically represented in Figure 3. Oldenburg and Pruess (1993) and
Webb (1997), using numerical simulations, proposed that infiltration into the CBL might occur progressively and introduced the concept of partial breakthrough, which is coherent with the shape of the WRC, where water enters progressively into a sample when suction decreases.
The diversion capacity is the maximum flow that a capillary barrier can divert and the diversion length is the horizontal length from the top of the slope to the breakthrough. The diversion capacity and diversion length depend on the k-functions of the materials
composing the CBL and the MRL, the layer thicknesses, the infiltration rate and the slope of the interface. Ross (1990) proposed that at and beyond the diversion length, the capillary barrier system is at equilibrium, i.e. the hydraulic gradient and suction profiles, as well as the infiltration rate across the interface, remain constant.
3.4 The Ross (1990) model to determine water diversion length
In order to evaluate the diversion length of a capillary barrier, Ross (1990) made the following assumptions: (1) the water table lies far below the MRL-CBL interface; (2) both layers are very thick; (3) the interface is inclined and much longer than the diversion length; (4) a vertical infiltration rate is applied uniformly to the top of the MRL. Based on these assumptions, six steps are described hereafter to calculate the diversion length. Each computation step considers that the capillary barrier is at equilibrium in terms of pressure and hydraulic gradient profiles, i.e. that the diversion capacity has been completely reached.
Step 1: Estimate the suction profile in the MRL using the linear method. The Kisch (1959) model could also be used here, but its application lies beyond the scope of this paper. Step 2: Obtain the hydraulic conductivity profile in the MRL using the suction profile via the k-function.
Step3: Estimate the horizontal hydraulic gradient profile in the MRL. From the interface to zc_MRL, the horizontal hydraulic gradient is equal to the tangent of the capillary interface dip.
The horizontal hydraulic gradient is, in the scope of the current model, null above zc_MRL.
Step 4: Obtain the Darcian horizontal velocity profile in the MRL by applying Darcy's law, i.e. by multiplying the hydraulic conductivities by the horizontal hydraulic gradients along the profile.
Step 5: Calculate the horizontal flow in the MRL. The horizontal flow is the area under the curve defined by the horizontal velocity profile, given by Equation 3a.
zdz v Q c MRL MRL z z h
_ _ 0 max (3a)where Qmax is the diversion capacity (m²/s), vh(z) is the velocity profile as a function of
elevation, z0_MRL is the elevation of the base of the MRL and zc_MRL is the elevation where
the maximal suction that can be found in the MRL is attained, according to the linear model. According to step 1, elevation can be directly transformed into suction (Equation 3b).
v d Q c MRL CBL c h
_ _ max (3b)Equation 3c can be deducted via Darcy’s law.
i k d Q c MRL CBL c h
_ _ max (3c)where ih is the horizontal hydraulic gradient and k() is the function (m/s). The
k-function k() can be split into the product of a relative k-k-function and a constant and, in this case, ih is equal to the tangent of the slope. Accordingly, Equation 3d is obtained, which is
the general equation of the diversion capacity that constitutes the Ross (1990) model.
k d k Q c MRL CBL c r sat
_ _ tan max (3d)where is the dip of the slope, ksat is the saturated hydraulic conductivity of the porous
medium (m/s) and kr() is the relative permeability function..
Step 6: Calculate the diversion length (L) using Equation 4.
q Q
L max (4)
4 MATERIAL SELECTION FOR AN OPTIMAL DESIGN
A capillary barrier is designed based on the following parameters: (1) the dip and length of the slope; (2) the k-functions of the materials constituting it; and (3) the maximum
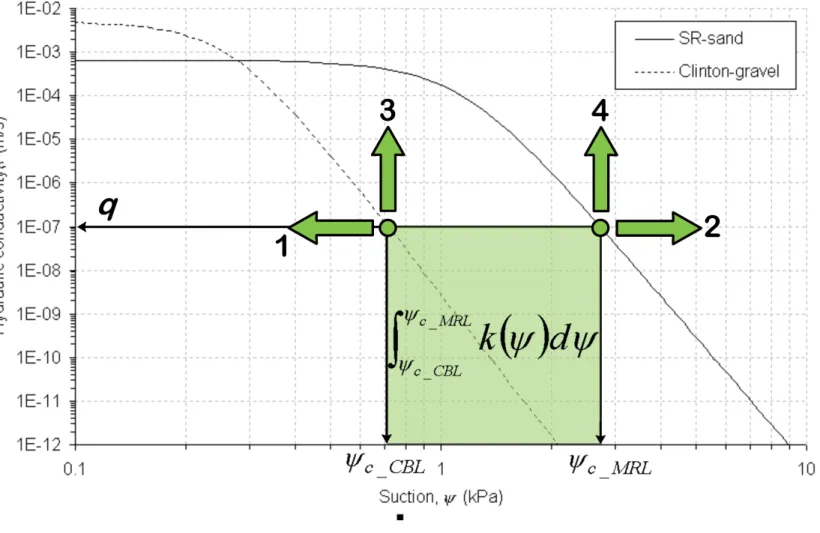
acceptable infiltration rate. According to Equations 3 and 4, the diversion length is
proportional to the area under the k-function of the material constituting the MRL, between the limits c_CBL and c_MRL. As shown in Figure 4, the area under the MRL k-function can
be maximized by selecting the most appropriate materials for the construction of a capillary barrier using the following four criteria (numbered 1 to 4 in Figure 4): (1) for an infiltration rate q, the maximal suction existing in the CBL (c_CBL) should be as low as possible; (2)
high as possible; (3) and (4) the hydraulic conductivities in the MRL corresponding to c_CBL and to c_MRL should be as high as possible. All in all, an ideal inclined capillary
barrier should include a CBL within which the capillarity forces are as weak as possible for the infiltration q, and a MRL capable to develop capillarity forces as strong as possible, for the same infiltration rate. In addition, the MRL must be as permeable as possible for suctions between c_CBL and c_MRL, so that water is effectively drained downslope.
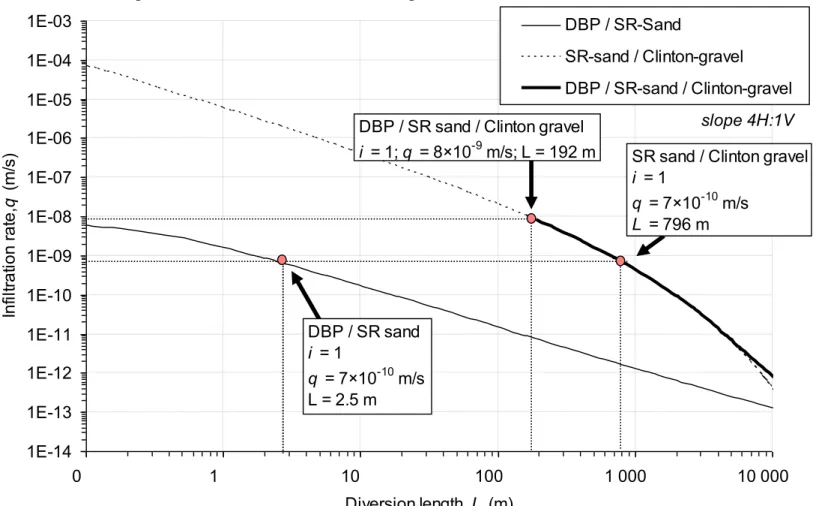
The Ross (1990) model was used to compare different combinations of materials for a capillary barrier. Figure 5 shows the relationship between diversion length and infiltration rate for capillary barriers where the conditions to apply the Ross (1990) model are met. The thin continuous line represents the behavior of a capillary barrier made of DPB over SR-sand, as the one installed at the Saint-Rosaire MSW facility (Parent 2003). The dotted line represents the behavior of a capillary barrier made of SR-sand over Clinton-gravel. For any infiltration rate, the capillary barrier made of SR-sand over Clinton-gravel diverts water over a longer distance than the DBP/SR-sand barrier. It is shown that the SR-sand/Clinton-gravel capillary barrier will divert water over 796 m, for an infiltration rate of 710-10 m/s, whereas the DPB/SR-sand capillary barrier diverts water only over 2.5 m.
5 COMPARISON BETWEEN THE ROSS (1990) MODEL AND NUMERICAL SIMULATIONS
Numerical simulations and the Ross (1990) model were compared in terms of infiltration through the interface of a capillary barrier composed of a DBP layer (MRL) overlying a
SR-sand layer (CBL). The layers were thick enough to avoid any possible influence of thickness on the results. The dip of the slope was 4H:1V (necessary to ensure the stability of the DBP cover at the Saint-Rosaire MSW facility). The boundary conditions used for the numerical simulations are: a water table condition (pressure head = 0) at the base of the CBL (as proposed by Ross (1990)), a uniform infiltration rate of 710-10 m/s at the top of the MRL, and infinite elements at the toe to assure continuity (unbounded mesh). The density of the mesh is 30 nodes/m² distributed uniformly. The entire mesh is presented in Figure 6.
The profiles obtained using numerical simulations are taken sufficiently far downslope, so that equilibrium is reached (as shown later in the paper, equilibrium occurs further
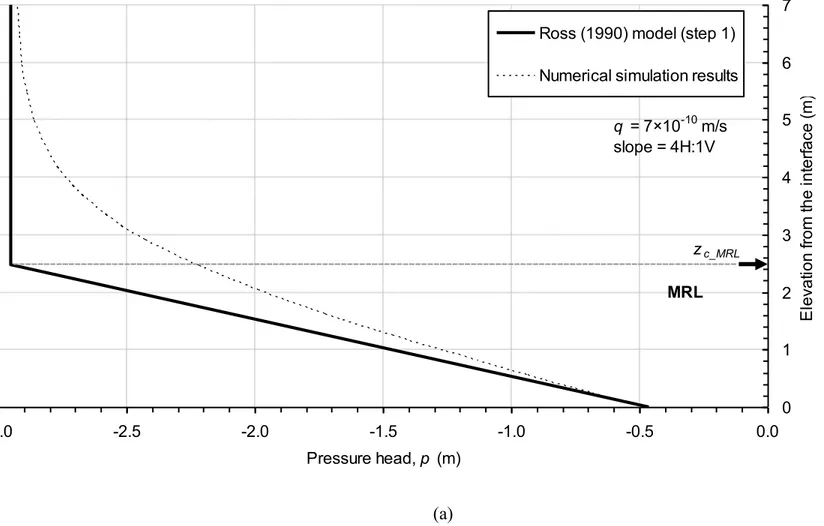
downslope than calculated using the Ross (1990) model). Estimation of the suction profile in step 1 is presented in Figure 7a, where it can be observed that suctions obtained using the linear method are greater than the values obtained numerically. As for the horizontal
hydraulic gradient (step 3), Figure 7b shows that there is a significant discrepancy between the estimated horizontal hydraulic gradient profiles obtained numerically and those
following the procedure in step 3. The latter overestimated the gradient for heights below
zc_MRL and considers ih=0 (i.e. no flow) for elevations above zc_MRL. The horizontal velocity
profiles (step 4; Figure 7c) showed a closer agreement with the numerical simulation up to a height equal to zc_MRL. Near the base of the MRL, overestimating the horizontal hydraulic
gradient leads to an overestimation of the horizontal flow velocity despite an overestimation of suctions in step 1.
The Ross (1990) model was solved with a Lobatto quadrature. Based on Equations 3d and 4, a diversion length of 2.5 m was calculated for the DBP/SR-sand capillary barrier system. The results from a numerical simulation using SEEP/W, presented in Figure 7d, show that the infiltration into the CBL occurs gradually, rather than in the binary (i.e. all-or-nothing) form obtained from the Ross (1990) model. Indeed, a capillary barrier leaks all along the interface, with infiltrations increasing in a sigmoïdal manner with distance (Figure 7d). As a consequence, the attainment of the maximal flow capacity obtained numerically occurs further downslope than when it is determined using the Ross (1990) model, which corroborates the results obtained by Webb (1997).
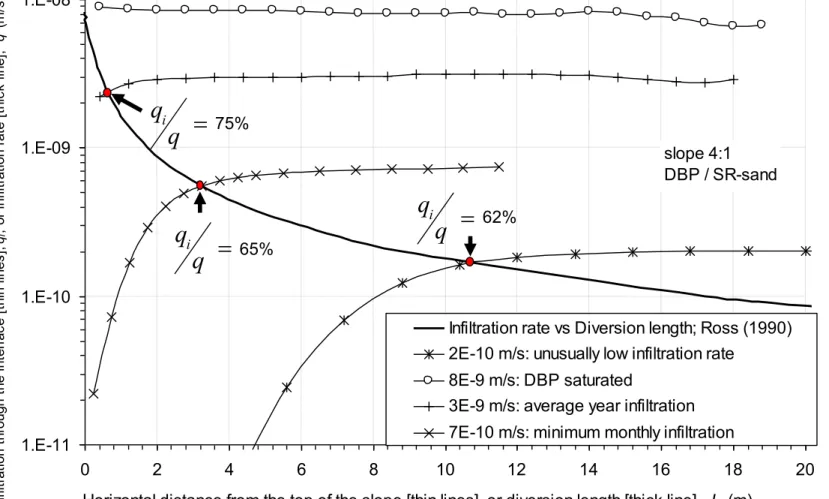
Figure 8 presents the relationship between diversion length and vertical infiltration into the CBL, as given by the Ross (1990) model (thick line), for a wide range of infiltration rates. The results of numerical simulations are also presented. As a result of mass conservation, the curves obtained by numerical simulation consistently cross the curve obtained using the Ross (1990) model (thick lines in Figures 7d and 8). It can be observed that the ratio
obtained at breakthrough (calculated using the Ross (1990) model) between the infiltration rate crossing the interface, qi (calculated using numerical simulations), and the infiltration
rate, q, increases systematically with infiltration rate.
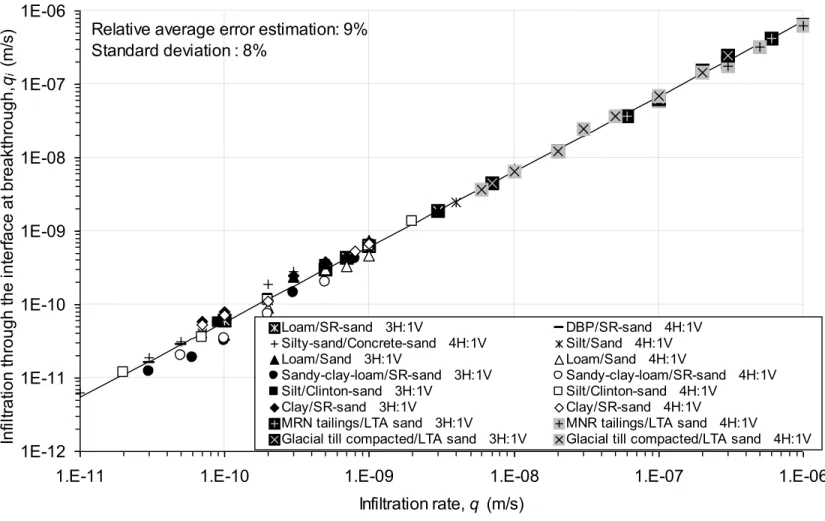
Several numerical simulations with different material combinations and various slopes were performed using SEEP/W in order to evaluate the relationship between q and qi at the
breakthrough calculated using the Ross (1990) model. This would permit to calibrate the Ross (1990) model with respect to numerical simulations. The van Genuchten (1980)
parameters of the materials used are shown in Table 1. The mesh and the boundary
conditions resemble those shown in Figure 6, with slope length and mesh density different from a material combination to another. The results of these simulations are presented in Figure 9. Curve fitting, made on a logarithmic scale, shows that, for the several materials tested, q and qi are related according to the following power function:
024 1 998 0. q .
qi (5)
For design purposes, the diversion length calculated using the Ross (1990) model can be used as a reference length from the top of the slope, where a fraction of q, i.e. qi, can be
predicted using Equation 5. According to this equation, the higher the value of q, the longer the diversion length, L. Although the relationship seems to be close to qi = q, a significant
discrepancy is found for low q values. For example, if q = 710-10 m/s, q
i = 4.210-10 m/s
(qi/q = 60%).
6 LAYER THICKNESS OPTIMISATION 6.1 Capillary break layer (CBL) optimisation
Numerical simulations were performed in order to evaluate the influence of CBL thickness on diversion length. An infiltration rate of 710-10 m/s was applied to a capillary barrier consisting of a SR-sand layer (CBL) overlain by a DBP layer (MRL). The slope is 4H:1V. The water table was placed at the base of the mesh. Despite the fact that a more realistic approach would be to place the water table below the base of the CBL (see discussion
below in this subsection and in the case study section), the adopted boundary condition would constitute the worst-case scenario in terms of water pressure at the interface.
Figure 10a presents the suction profiles at equilibrium for different CBL thicknesses, as obtained from the numerical simulations. It can be observed that for thicknesses lower than approximately 0.60 m, any reduction in CBL thickness leads to a significant reduction in the suction value at the interface.
Figure 10b presents further numerical simulations performed in order to evaluate the influence of CBL thickness on suction at the interface and on water diversion length. For sake of evaluation of different CBL thicknesses, the diversion length was considered to be reached when 65% of the infiltration rate crossed the CBL/MRL interface (Figure 7d). This ratio corresponds to the value obtained in Figure 8 (for q=710-10 m/s) and was used instead of the value obtained using Equation 5 (where qi/q=60%) in order to obtain greater
precision for the present analysis. For thicknesses lower than 0.45 m, the presence of the water table at the base of the CBL (lower boundary condition) caused an upward flow that eventually crossed the interface. This upward flow is due to high suction values at the top of the slope that sucks up water from the water table. Consequently, for thicknesses smaller than 0.45 m, the flow reversal made the diversion length impossible to be determined. As a consequence, the decrease in diversion length was extrapolated (dashed line in Figure 10b). It can also be observed in Figure 10b that below a critical thickness value (in this case, elevation zc_CBL above the water table), a small decrease in suction at the interface leads to a
drastic drop in diversion length. Above this critical value, the elevation above the water table beyond which suction no longer increases, zc_CBL, is considered attained and the
diversion length remains practically constant. The attainment of c_CBL at the CBL/MRL
interface leads to a maximal contrast between the hydraulic conductivities of the two materials, which, according to the Ross (1990) model (see also discussion about Figure 4 earlier in the paper), maximizes the diversion length.
As suggested by Kao et al. (2001), zc_CBL is the height where suction equals 99% of its
asymptotic value. The CBL optimal thicknesses (zc_CBL) in the DBP/SR-sand capillary
barrier estimated using the Kisch (1959) model and SEEP/W is 0.60 m. Although the use of the linear method leads to similar hydraulic conductivity profiles, when it is used within the Ross (1990) model, it underestimates zc as compared to the values calculated using the
Kisch (1959) model or SEEP/W. The zc eventually found using the linear method was 0.46
m. In the absence of a software capable of handling unsaturated seepage, the Kisch (1959) model should be preferred to the linear method.
As mentioned previously, a more realistic approach would be to consider the water table to lie below the base of the CBL. In this case, c_CBL would be attained at a lower elevation,
thus requiring a thinner CBL. If the CBL material is a finer material than the underlying material (daily cover), suction at the base of the CBL would lie between zero and the maximum suction that can be found in the daily cover. On the other hand, if the CBL material is coarser, the higher suction in the daily cover will not be transmitted into the
CBL, and suction will reach c_CBL at the interface between the CBL and the daily cover.
Consequently, in the latter case, hydraulic aspects do not prescript a specific CBL thickness.
6.2 Moisture retention layer optimization
If the CBL is properly designed, the Ross (1990) model can be used for MRL thickness optimization. According to this model, under equilibrium conditions, the diversion capacity is the area under the curve in the horizontal velocity vs. suction plot (Equation 3b). At equilibrium, the lower and upper integral limits are, respectively, the suction value at the interface of the capillary barrier, c_CBL, and the maximal suction attained in the MRL,
c_MRL.
Numerical simulations were performed using SEEP/W in order to obtain the horizontal velocity profiles for several MRL thicknesses. The infiltration rate considered was 710-10 m/s. The slope was 4H:1V and the CBL was sufficiently thick (thickness > zc_CBL). Figure
11a shows that, at equilibrium, the horizontal velocity profile is, for all practical purposes, not affected by the MRL thickness. Moreover, the Ross (1990) model closely agreed with numerical simulation results for MRL thicknesses lower than zc_MRL. Above zc_MRL, the Ross
(1990) model considers the horizontal hydraulic gradient to be null, so that no horizontal flow is considered. Since height can be translated directly into suction (linear method), for MRLs thinner than zc_MRL, the upper limit in Equation 3 is no longer c_MRL and should be
CBL c w MRL u th _ for thMRL < zc_MRL (6a) MRL c u _ for thMRL zc_MRL (6b)
where thMRL is thickness of the MRL. Substituting Equation 6 into Equation 3, a
relationship between MRL thickness and diversion length can be established using Equation 4.
In order to verify if this adaptation of the Ross (1990) model works for MRL thicknesses lower than zc_MRL, numerical simulations were performed using SEEP/W. The same
materials and boundary conditions considered in Figure 10 and Figure 11a were used. The diversion length was supposed to be reached when the ratio qi/q was equal to 65% (Figure
7d). In Figure 11b, calculations with the adapted Ross (1990) model show that the diversion length increases with MRL thickness in an exponential manner and levels off when c_MRL is attained. Results obtained using SEEP/W are rather similar, although the 2.5
m diversion length is reached asymptotically. For a MRL thickness of 2.5 m, a diversion length of 2.5 m is obtained using the Ross (1990) model, whereas for the same thickness, a diversion length of 2.2 m is obtained using SEEP/W (a 10% difference). The adapted Ross (1990) model slightly overestimates diversion length, which was expected because, as discussed previously, horizontal velocities are overestimated by the Ross (1990) model for thicknesses lower than zc_MRL (Figure 7c and Figure 11a).
7 CASE STUDY: APPLICATION OF THE PROPOSED PROCEDURE
In the present case study, the design requires a minimum diversion length of 25 m for a 4H:1V capillary barrier whose CBL and MRL are constructed using the Clinton-gravel and the SR-sand, respectively. The flow through the CCBE interface should not exceed 810-9 m/s.
The MRL thickness must be determined based on the targeted diversion length (i.e. for the required length and dip of slope) for the maximal infiltration rate (qi) acceptable to
percolate through the interface of the capillary barrier. With qi equal to 810-9 m/s, a q
equal to 1.210-8 m/s is obtained from Equation 5.
Based on Figure 5, a CCBE with thick layers will divert water over 151 m horizontally for
q=1.210-8 m/s, i.e. more than the 25 m needed at the site. Considering that the length of the slope was 25 m, the optimal thickness of the MRL for q=1.210-8 m/s is found to be 510-3 m using the adaptation of the Ross (1990) model. If a water table lies at the base of the CBL (worst-case scenario), the value of zc_CBL in the Clinton-gravel, calculated using
the Kisch (1959) model for q=1.210-8 m/s, is 0.11 m. Such thin layers are not feasible to install with conventional equipments, suggesting that in this case, geotechnical aspects will determine the thickness of the MRL. As proposed by Henry and Hotlz (2001) a thick geotextile could be installed as MRL. The design procedure demonstrates the great effectiveness of capillary barriers constructed with coarse-grained materials.
A capillary barrier including a 0.11 m thick CBL made of Clinton-gravel, a 510-3 m thick MRL made of SR-sand and a DBP hydraulic installed on a slope of 25 m long horizontally, inclined 4H:1V and submitted to a steady-state infiltration rate of q=1.210-8 m/s was simulated with SEEP/W. Two simulations were performed with different boundary conditions at the base of the CBL: the first with a water table (=0) and the second with a value of c_CBL. As shown in Figure 12, an upward flow is observed upslope for the first
simulation, due to the water table that acts as a source of water. The second simulation shows a behavior similar to the one observed in Figure 8 for DBP/SR-sand CCBEs. For both lower boundary conditions, the 810-9 m/s targeted flow is almost attained at the toe of the slope, where the qi calculated by SEEP/W equals 5.610-9 m/s for =0 at the base of
the CBL and 6.810-9 m/s for =c_CBL at the base of the CBL. Results show that the design procedure proposed in this manuscript is compatible with numerical simulation results. Indeed, even though the upward flow influences the shape of the qi versus
horizontal distance graph, the discrepancy between the first and the second simulations at a horizontal distance equal to L is minor.
The SR-sand/Clinton-gravel capillary barrier may be exposed to higher infiltration rates than the maximum 810-9 m/s that can percolate through the DBP/SR-sand barrier (which is equivalent to the ksat of DBP). Indeed, infiltration rates in excess of 110-7 m/s
(corresponding to intense rainfall) were obtained during simulations using the HELP model and data from the Saint-Rosaire MSW landfill (Parent 2003). In order to limit the
SR-sand/Clinton-gravel capillary barrier. This would lead to a double capillary barrier, a concept discussed by Pease and Stormont (1996). The thick continuous line in Figure 5 shows that, for a unit vertical hydraulic gradient, the DBP layer limits the infiltration rate into a capillary barrier made of SR-sand/Clinton-gravel to a value of approximately 810-9 m/s, for a diversion length of 192 m. In this case, contribution of the DBP layer to the diversion length is negligible.
8 MODEL LIMITATION
The procedure presented above allows for the optimization capillary barriers in terms of material selection and layer thickness in order to limit water infiltrations. The procedure does not require the use of numerical simulations. However, a few limitations have to be pointed out: (1) Although the empirical calibration to determine the infiltration through the interface at breakthrough (Equation 5) is quite precise for design purposes, it was obtained from a limited number of materials and should not be used indiscriminately. (2) The design procedure proposed in this paper is based on limiting the influx to a maximum target value. A more accurate design would be based on a cumulative flux crossing the CCBE interface. Such cumulative flux can be obtained using 2D unsaturated seepage software. (3) As proposed by Khire et al. (2000) for evapotranspirative capillary barriers, a water balance simulation software coupled with an unsaturated flow model - such as UNSAT-H or VADOSE/W - should be used to quantify layer thicknesses, particularly in the case where the lower boundary condition in the CBL is different from the one adopted in this study (pressure head = 0). Khire et al. (2000) also suggested taking into account other factors, such as climatic data, runoff, evapotranspiration, water and wind erosion or desiccation
cracking. (4) Kämpf and Holfelder (1999) suggested that a proper design should be tested in flumes, because coarse materials are susceptible to fingering (preferential flow) over a large range of infiltration rates. (5) The proposed approach for designing capillary barriers does not take into account geotechnical aspects, such as slope stability analysis, filtering of MRL material to prevent coggling of the CBL interface, as well as layering effects (due to heterogeneities associated with barrier construction), and constructional aspects.
9 CONCLUSIONS
A design procedure was proposed to optimize the water diversion length of covers with capillary barrier effect. Material selection was done based on their k-functions: for a given infiltration rate the suction at the top of the CBL must be as low as possible, whereas the maximum suction inside the MRL should be as high as possible. In addition, the hydraulic conductivities corresponding to the suctions at the bottom and at the top of the MRL must be as high as possible. In order to compare different material combination scenarios, the Ross (1990) model can be applied to establish a relationship between infiltration rate and diversion length.
The various steps of the Ross (1990) model were validated by comparing the results
obtained at each step with those from a finite element seepage software. It is shown that, for a given infiltration rate, slope and selection of materials, the capillary break layer (CBL) thickness needs to be designed so that the maximum possible suction value is attained at its top, i.e. that the point at which the suction no longer changes (zc_CBL) is attained. This can
be done by applying the Kisch (1959) model. However, the boundary condition imposed at the base of the CBL, which consisted in a water table, is of concern.
As far as the moisture retaining layer (MRL) is concerned, thickness determination is based on the ability of the material to drain water over the required distance (diversion length). This is done by applying the Ross (1990) model with a modification to the upper limit of the integral, which is set as a variable. In this way, a relationship between diversion length and MRL thickness can be defined. Thus, for a given diversion length, the thickness of the MRL can be obtained.
An example of application of the procedure to the design of an actual capillary barrier was presented. Optimization of the cover system showed the SR-sand over Clinton-gravel combination required a CBL thickness of only 0.11 m and a MRL thickness of only 510-3 m to divert water over 25 m. However, a sand-over-gravel combination may not prevent intense rainfall from infiltrating into the landfill. In this case, a hydraulic barrier constituted of DBP can be placed in order to limit infiltration to a maximum equal to the saturated hydraulic conductivity of DBP (810-9 m/s). The creation of another capillary break at the interface between the DBP and the SR-sand does not significantly influence the results in terms of diversion length and layer thicknesses because of the quite low diversion length determined for the DBP/SR-sand system.
Acknowledgments. The authors thank the reviewers of the present paper for their valuable contribution. Funding was provided by NSERC (Canada) through the Second Author’s Discovery Grant.
Abbreviations:
CBL: capillary break layer
CCBE: Cover with capillary barrier effect DBP: Deinking by-product
k-function: Hydraulic conductivity function
MRL: Moisture retention layer WRC: Water retention curve
References
Akindunni, F. F., R. W. Gillham, and R. V. Nicholson. 1991. Numerical simulations to investigate moisture-retention characteristics in the design of oxygen-limiting covers for reactive mine tailings. Pages 446-451 in. Canadian Geotechnical Journal. Aubertin, M., Bussière, B., Barbera, J-M., Chapuis, R.P., Monzon, M., Aachib, M. 1997.
Construction and instrumentation of in situ test plots to evaluate covers built with clean tailings. Pages 717-727 in F. i. c. o. A. R. Drainage, editor.
Baker, R. S., and D. Hillel. 1990. Laboratory tests of a theory of fingering during infiltration into layered soils. Soil Science of America Journal 54:20-30.
Barth, C., and S. Wohnlich. 1999. Proof of effectiveness of a capillary barrier as surface sealing of sanitary landfill. Pages 389-392 in 7th international waste management and landfill symposium, Sardina.
Bews, B. E., M. O'Kane, G. W. Wilson, and D. Williams. 1997. The design of a low flux cover system, including lysimeters, for acid generating waste rock in semi-arid environments. in. Proceedings of the Fourth International Conference on Acid Mine Drainage, Volume II.
Buckingham, E. 1907. Studies on the movement of soil moisture. Bureau of Soils, United States Department of Agriculture; 38, Washington, D.C.
Burnotte, F., G. Lefebvre, A. Cabral, C. Audet, and A. Veilleux. 2000. Use of deinking residues for the final cover of a MSW landfill. Pages 585-591 in 53e. Conférence canadienne de géotechnique, Montreal.
Bussiere, B., M. Aubertin, and R. Chapuis. 2000. The use of hydraulic breaks to limit desaturation of inclined capillary barriers. Pages 465-472 in 53rd Canadian Geotechnical Conference.
Bussiere, B., M. Aubertin, and R. P. Chapuis. 2003. The behavior of inclined covers used as oxygen barriers. Canadian Geotechnical Journal 40:512-535.
Cabral, A. R., G. Lefebvre, and F. Burnotte. 1999a. Caractérisation de la membrane de recouvrement de résidus de désencrage du site minier Clinton - Analyse finale de données recueillies jusqu'en décembre 1998. Université de Sherbrooke, Sherbrooke. Cabral, A. R., G. Lefebvre, F. Burnotte, C. T. Panarotto, and E. Pastore. 1999b. Use of pulp and paper residues as an alternative cover material to landfill and to acid generating tailings. Pages 56-70 in 2º Seminario de meio ambiante em industrias de processo, Sao Paulo, Brésil.
Choo, L. P., and E. K. Yanful. 2000. Water flow through cover soils using modeling and experimental methods. Journal of Geotechnical & Geoenvironmental Engineering 126:324-334.
Geo-slope. 2002. SEEP/W for finite element seepage analysis, version 5: User's guide. Geo-slope International Ltd., Calgary.
Henry, K. S., and R. D. Holtz. 2001. Geocomposite capillary barriers to reduce frost heave in soils. Canadian Geotechnical Journal 38:678-694.
Kamon, M., S. Inazumi, T. Takashi, and T. Inui. 2001. Waste sludge applicability and waste balance analysis of landfill cover system. Pages 31-38 in Proceedings of the first Korea-Japan joint seminar on geoenvironmental engineering.
Kampf, M., and T. Holfelder. 1999. Designing capillary barriers. Pages 381-388 in Seventh International Waste Management and Landfill Symposium. CISA, Environmental Sanitary Engineering Centre, Sardinia.
Kampf, M., and H. Montenegro. 1997. On the performance of capillary barriers as landfill cover. Hydrology and Earth Systems Sciences 4:925-929.
Kao, C., S. Bouarfa, and D. Zimmer. 2001. Steady state analysis of unsaturated flow above a shallow water-table aquifer drained by ditches. Journal of Hydrology 250:122-133.
Khire, M. V., C. H. Benson, and P. J. Bosscher. 2000. Capillary barriers: Design variables and water balance. Journal of Geotechnical & Geoenvironmental Engineering 126:695-708.
Kisch, M. 1959. The theory of seepage from clay-blanketed reservoirs. Géotechnique 9. Moo-Young, H. K., and T. F. Zimmie. 1996. Geotechnical properties of paper mill sludges
for use in landfill covers. Journal of Geotechnical Engineering 122:768-775. Morris, C. E., and J. C. Stormont. 1999. Parametric study of unsaturated drainage layers in
a capillary barrier. Journal of Geotechnical and Geoenvironmental Engineering 125:1057-1065.
Nicholson, R. V., M. Gillham, J. A. Cherry, and E. J. Reardon. 1989. Reduction of acid generation in mine tailings through the use of moisture-retaining cover layers as oxygen barriers. Canadian Geotechnical Journal 26:1-8.
Nyhan, J. W., T. G. Schofield, and R. H. Starmer. 1997. A Water Balance Study of Four Landfill Cover Designs Varying in Slope for Semiarid Regions. Journal of Environmental Quality 26:1385-1392.
Oldenburg, C. M., and K. Pruess. 1993. On numerical modelling of capillary barriers. Water Resources Research 29:1045-1056.
Parent, S.-É. 2003. Étude des couvertures avec effet de barrière capillaire: applications à l'utilisation des résidus de désencrage comme matériau de recouvrement de sites de résidus miniers et de lieux d'enfouissement sanitaire. Masters thesis. Université de Sherbrooke, Sherbrooke.
Pease, R. E., and J. C. Stormont. 1996. Increasing the Diversion Length of Capillary Barriers. in Joint Conference on the Environment, Albuquerque, New Mexico. Ross, B. 1990. The Diversion Capacity of Capillary Barriers. Water Resources Research
26:2625-2629.
Stormont, J. C., and C. E. Anderson. 1999. Capillary barrier effect from underlying coarser soil layer. Journal of Geotechnical and Geoenvironmental Engineering 125:641-648.
Tami, D., H. Rahardjo, E. C. Leong, and D. G. Fredlund. 2004. A Physical Model for Sloping Capillary Barriers. Geotechnical Testing Journal 27:1-16.
Tidwell, V. C., R. J. Glass, C. Chocas, G. Barker, and L. Orear. 2003. Visualization experiment to investigate capillary barrier performance in the context of a Yucca Mountain emplacement drift. Journal of contaminant hydrology 62-3:287-301. van Genuchten, M. T. 1980. A closed-form equation for predicting the hydraulic
conductivity of unsaturated soils. Soil Science Society of America Journal 44:892-898.
van Genuchten, M. T., F. J. Leij, and S. R. Yates. 1991. The RETC code for quantifying the hydraulic functions of unsaturated soils. EPA/600/2-91/065, U.S. Department of Agriculture, Agriculture Research Service.
von Der Hude, N., S. Melchior, and S. Möckel. 1999. Construction of a capillary barrier in the cover of the Breinermoor landfill. Pages 393-402 in Seventh International Waste Management and Landfill Symposium, Sardinia.
Webb, S. W. 1997. Generalization of Ross Tilted Capillary Barrier Diversion Formula for Different Two-Phase Characteristic Curves. Water Resources Research 33:1855-1859.
LIST OF TABLES
Table 1. Water retention characteristics of several materials used to determine the
relationship between qi and q and the empirical factor needed to determine zc using Kisch
LIST OF FIGURES
Figure 1. Hydraulic conductivity functions of the materials used in this paper.
Figure 2. Suction, volumetric water content and hydraulic conductivity profiles into a one-dimensional CCBE submitted to a vertical infiltration of 710-10 m/s
Figure 3. Schematic representation of water flow vectors in an inclined CCBE.
Figure 4. Hydraulic conductivity functions showing how to choose the best materials to constitute the CCBE for a given infiltration rate.
Figure 5. Diversion length for different infiltration rates, using different material combinations.
Figure 6. Mesh used for numerical simulations.
Figure 7. Comparison between the profiles in the MRL at equilibrium obtained using the Ross (1990) model and using a SEEP/W; (a) Step 1 (b) Step 3 (c) Step 4 (d) Comparison between the diversion length obtained applying Step 6 and using numerical simulations. Figure 8. Comparison between diversion lengths obtained applying step 6 and using numerical simulations for several infiltration rates.
Figure 9. Variation of the infiltration rate through the interface (qi) at the diversion length
calculated using the Ross (1990) model as a function of the infiltration rate (q) for numerous combinations of materials and slopes.
Figure 10. CBL optimisation: (a) Suction profile obtained using SEEP/W for capillary barriers with different SR-sand CBL thicknesses (b) Suctions at the interface of the capillary barrier and diversion lengths for different SR-sand thicknesses.
Figure 11. MRL optimisation: (a) Horizontal velocity profile in a capillary barrier for different MRL thicknesses (b) Comparison of the results from the adaptation of the Ross (1990) model and from numerical simulations for the determination of the optimal thickness of the MRL.
Figure 12. Numerical simulation results of the infiltration through the interface along the slope of the designed capillary barrier, applying the proposed procedure.
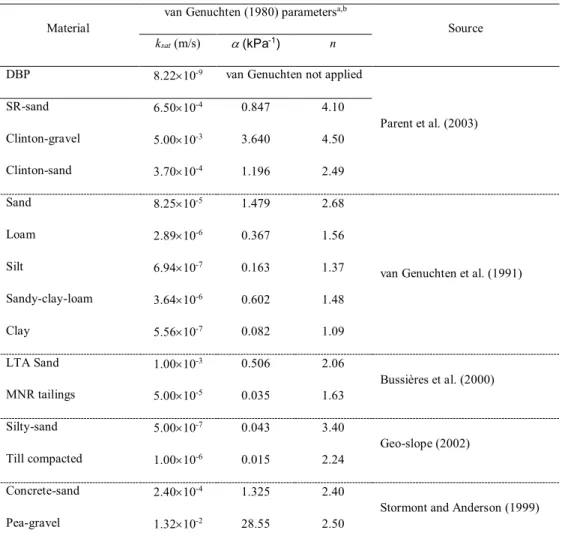
Table 1. Water retention characteristics of several materials used to
determine the relationship between qi and q and the empirical factor needed
to determine the height of the breaking point using Kisch (1959).
Material van Genuchten (1980) parameters
a,b
Source
ksat (m/s) (kPa-1) n
DBP 8.2210-9 van Genuchten not applied
Parent et al. (2003)
SR-sand 6.5010-4 0.847 4.10
Clinton-gravel 5.0010-3 3.640 4.50
Clinton-sand 3.7010-4 1.196 2.49
Sand 8.2510-5 1.479 2.68
van Genuchten et al. (1991)
Loam 2.8910-6 0.367 1.56 Silt 6.9410-7 0.163 1.37 Sandy-clay-loam 3.6410-6 0.602 1.48 Clay 5.5610-7 0.082 1.09 LTA Sand 1.0010-3 0.506 2.06 Bussières et al. (2000) MNR tailings 5.0010-5 0.035 1.63 Silty-sand 5.0010-7 0.043 3.40 Geo-slope (2002) Till compacted 1.0010-6 0.015 2.24 Concrete-sand 2.4010-4 1.325 2.40
Stormont and Anderson (1999)
Pea-gravel 1.3210-2 28.55 2.50
a van Genuchten (1980) parameters were determined using the RETC code (van Genuchten et al. 1991) b m = 1-1/n
Figure 1. Hydraulic conductivity functions of the materials used in this paper. 1E-14 1E-13 1E-12 1E-11 1E-10 1E-09 1E-08 1E-07 1E-06 1E-05 1E-04 1E-03 1E-02 0.01 0.1 1 10 100 1000 Suction, (kPa) H yd ra ul ic co nd uct ivi ty, k (m /s) Deinking by-products SR-sand Clinton-gravel [ 7X10⁻¹⁰ m/s ; 4.6 kPa ] [ 7X10⁻¹⁰ m/s ; 28,9 kPa ] kClinton-gravel_x c_CBL kSR-sand_x c_MRL k
Figure 2. Suction, volumetric water content and hydraulic conductivity profiles into a one-dimensional CCBE submitted to a vertical infiltration of 710-10 m/s 0.0 0.1 0.2 0.3 0.4 0.5 0.6 0.7 0.8 0.0 0.1 0.2 0.3 0.4 0.5 0.6 0.7 0.8
Suction, (m) / Volumetric water content,
E le va tio n, z (m )
1E-10 1E-09 1E-08 1E-07 1E-06 1E-05 1E-04 1E-03 1E-02 Hydraulic conductivity, k (m/s)
Suction profile: Linear method Suction profile: Kisch
Suction profile: SEEP/W Hydrostatic condition (no flow) Volumetric water content profile
Hydraulic conductivity profile (upper x-axis)
MRL: SR-sand CBL: Clinton-gravel
zc_MRL (linear method)
zc_CBL
c_CBL
zc_MRL (Kisch and SEEP/W method) q = 7×10⁻¹⁰ m/s
c_MRL
k
Figure 4. Hydraulic conductivity functions showing how to choose the best materials to constitute the CCBE for a given infiltration rate.
Figure 5. Diversion length for different infiltration rates, using different material combinations. 1E-14 1E-13 1E-12 1E-11 1E-10 1E-09 1E-08 1E-07 1E-06 1E-05 1E-04 1E-03 0 1 10 100 1 000 10 000 Diversion length, L (m) In fil tra tio n ra te , q (m /s) DBP / SR-Sand SR-sand / Clinton-gravel DBP / SR-sand / Clinton-gravel slope 4H:1V DBP / SR sand / Clinton gravel
i = 1; q = 8×10⁻⁹ m/s; L = 192 m SR sand / Clinton gravel i = 1 q = 7×10⁻¹⁰ m/s L = 796 m DBP / SR sand i = 1 q = 7×10⁻¹⁰ m/s L = 2.5 m
Figure 7. Comparison between the profiles in the MRL at equilibrium obtained using the Ross (1990) model and using a SEEP/W; (a) Step 1 (b) Step 3 (c) Step 4 (d) Comparison between the diversion length obtained applying Step 6 and using numerical simulations. 0 1 2 3 4 5 6 7 -3.0 -2.5 -2.0 -1.5 -1.0 -0.5 0.0 Pressure head, p (m) E le va tio n fro m th e in te rfa ce (m )
Ross (1990) model (step 1) Numerical simulation results
q = 7×10⁻¹⁰ m/s
slope = 4H:1V
MRL
zc_MRL
0 1 2 3 4 5 6 7 0.00 0.05 0.10 0.15 0.20 0.25
Horizontal hydraulic gradient, ih
E le va tio n fro m th e in te rfa ce (m )
Ross (1990) model (step 3) Numerical simulation results
MRL
q = 7×10⁻¹⁰ m/s slope = 4H:1V
0 1 2 3 4 5 6 7
0.0E+00 2.0E-10 4.0E-10 6.0E-10 8.0E-10 1.0E-09 1.2E-09 1.4E-09 1.6E-09 1.8E-09 Horizontal flow velocity (m/s)
E le va tio n fro m th e in te rfa ce (m )
Ross (1990) model (step 4) Numerical simulation results
MRL
q = 7×10⁻¹⁰ m/s slope = 4H:1V
1.E-11 1.E-10 1.E-09
0 1 2 3 4 5 6 7 8 9 10
Horizontal distance from the top of the slope (m)
In fil tra tio n th ro ug h th e in te rfa ce , qi (m /s) Using SEEP/W
Ross (1990) model (step 6) At breakthrough q = 7.0×10⁻¹⁰ m/s qi = 4.6×10⁻¹⁰ m/s 65%
q
q
i slope = 4H:1V (d)Figure 8. Comparison between diversion lengths obtained applying step 6 and using numerical simulations for several infiltration rates. 1.E-11 1.E-10 1.E-09 1.E-08 0 2 4 6 8 10 12 14 16 18 20 In fil tra tio n th ro ug h th e in te rfa ce [t hi n lin es ], qi , o r i nf ilt ra tio n ra te [t hi ck li ne ], q (m /s )
Infiltration rate vs Diversion length; Ross (1990) 2E-10 m/s: unusually low infiltration rate
8E-9 m/s: DBP saturated
3E-9 m/s: average year infiltration 7E-10 m/s: minimum monthly infiltration
slope 4:1 DBP / SR-sand 75%
q
q
i 65% 62%
q
q
i
q
q
iFigure 9. Variation of the infiltration rate through the interface (qi) at the diversion length calculated using the Ross (1990) model as a function of the infiltration rate (q) for numerous combinations of materials and slopes.
1E-12 1E-11 1E-10 1E-09 1E-08 1E-07 1E-06
1.E-11 1.E-10 1.E-09 1.E-08 1.E-07 1.E-06
Infiltration rate, q (m/s) In fil tra tio n th ro ug h th e in te rfa ce a t b re akt hr ou gh , qi (m /s) Loam/SR-sand 3H:1V DBP/SR-sand 4H:1V Silty-sand/Concrete-sand 4H:1V Silt/Sand 4H:1V Loam/Sand 3H:1V Loam/Sand 4H:1V Sandy-clay-loam/SR-sand 3H:1V Sandy-clay-loam/SR-sand 4H:1V Silt/Clinton-sand 3H:1V Silt/Clinton-sand 4H:1V Clay/SR-sand 3H:1V Clay/SR-sand 4H:1V
MRN tailings/LTA sand 3H:1V MNR tailings/LTA sand 4H:1V
Glacial till compacted/LTA sand 3H:1V Glacial till compacted/LTA sand 4H:1V
Relative average error estimation: 9% Standard deviation : 8%
Figure 10. CBL optimisation: (a) Suction profile obtained using SEEP/W for capillary barriers with different SR-sand CBL thicknesses (b) Suctions at the interface of the capillary barrier and diversion lengths for different SR-sand thicknesses.
-1.0 -0.8 -0.6 -0.4 -0.2 0.0 0.2 0.4 0.6 -8 -7 -6 -5 -4 -3 -2 -1 0 Pressure, p (kPa) D ist an ce fr om th e in te rfa ce (m ) 1 m 0.75 m 0.6 m 0.5 m 0.4 m 0.3 m MRL : Deinking by-product CBL : SR-Sand Thickness of the CBL L = 2.5 m L = 2.4 m L = 2.1 m L = 1.1 m L = 0.3 m q = 7×10⁻¹⁰ m/s slope 4H:1V (a)
0.0 0.5 1.0 1.5 2.0 2.5 0.0 0.2 0.4 0.6 0.8 1.0 Thickness of the CBL (m) D ive rsi on le ng th , L (m ) 0.0 0.5 1.0 1.5 2.0 2.5 3.0 3.5 4.0 4.5 5.0 S uct io n at th e in te rfa ce o f t he C C B E (kP a)
Diversion length versus thickness of the CBL - simulated with SEEP/W Extrapolation
Suction at the interface of the CCBE -from simulations with SEEP/W
axis
axis Maximal suction
and diversion length calculated using the Ross (1990) model
q = 7×10⁻¹⁰ m/s slope 4H:1V
zc_CBL=0.60m
Figure 11. MRL optimisation: (a) Horizontal velocity profile in a capillary barrier for different MRL thicknesses (b)
Comparison of the results from the adaptation of the Ross (1990) model and from numerical simulations for the determination of the optimal thickness of the MRL.
0 0.5 1 1.5 2 2.5 3 3.5 4 4.5 5
1E-11 1E-10 1E-09 1E-08
Horizontal water velocity, vh (m/s)
E le va tio n fro m th e in te rfa ce (m ) 5 m 4 m 3 m 2 m 1 m MRL thickness (simulations with SEEP/W)
velocity profile from the Ross [1990] model (step 4)
q = 7×10⁻¹⁰ m/s
0.0 0.5 1.0 1.5 2.0 2.5 3.0 0 1 2 3 4 5 6 7 Thickness of the MRL (m) D ive rsi on le ng th , L (m )
Results from SEEP/W
Ross [1990] model with variation of Diversion length calculated using the Ross (1990) model
u
q = 7×10⁻¹⁰ m/s slope = 4H:1V
Figure 12. Numerical simulation results of the infiltration through the interface along the slope of the designed capillary barrier, applying the proposed procedure.
1.E-11 1.E-10 1.E-09 1.E-08
0 5 10 15 20 25
Horizontal distance from the top of the slope (m)
In fil tra tio n th ro ug h th e in te rfa ce , qi , o r h yd ra ul ic co nd uct ivi ty (m /s) 8X10⁻⁹ m/s : maximum acceptable infiltration through the interface
upward flow
Flow through the interface: = 0 at the base of the CBL Flow through the
interface: = c_CBL