HAL Id: hal-02017231
https://hal-ifp.archives-ouvertes.fr/hal-02017231
Submitted on 13 Feb 2019
HAL is a multi-disciplinary open access archive for the deposit and dissemination of sci-entific research documents, whether they are pub-lished or not. The documents may come from teaching and research institutions in France or abroad, or from public or private research centers.
L’archive ouverte pluridisciplinaire HAL, est destinée au dépôt et à la diffusion de documents scientifiques de niveau recherche, publiés ou non, émanant des établissements d’enseignement et de recherche français ou étrangers, des laboratoires publics ou privés.
Fraction of Safaniya Crude Oil
T. Al Darouich, F. Béhar, C. Largeau, H. Budzinski
To cite this version:
T. Al Darouich, F. Béhar, C. Largeau, H. Budzinski. Separation and Characterisation of the C15-Aromatic Fraction of Safaniya Crude Oil. Oil & Gas Science and Technology - Revue d’IFP Ener-gies nouvelles, Institut Français du Pétrole, 2005, 60 (4), pp.681-695. �10.2516/ogst:2005048�. �hal-02017231�
Separation and Characterisation
of the C
15-
Aromatic Fraction
of Safaniya Crude Oil
T. Al Darouich
1,2, F. Béhar
1, C. Largeau
2and H. Budzinski
31 Institut français du pétrole, 1 et 4, avenue de Bois-Préau, 92852 Rueil-Malmaison Cedex - France 2 Laboratoire de chimie bioorganique et organique physique, UMR CNRS 7573, ENSCP,
11, rue Pierre-et-Marie-Curie, 75231 Paris Cedex 05 - France
3 Laboratoire de Photophysique et photochimie moléculaire, université de Bordeaux 1, URA 348 CNRS, 351, cours de la Libération, 33400 Talence - France
e-mail: tammam.al-darouich@ifp.fr - francoise.behar@ifp.fr - claude-largeau@enscp.jussieu.fr - h.budzinski@lptc.u-bordeaux1.fr
Résumé — Séparation et caractérisation de la fraction aromatique C15-de l’huile brute Safaniya —
L’objectif de ce travail est d’isoler et de caractériser la fraction aromatique légère de l’huile Safaniya, huile brute conventionnelle non biodégradée de type II, pour étudier la stabilité thermique des fractions aromatiques légères des huiles brutes. Une distillation fractionnée nous a permis d’obtenir la coupe < 250°C correspondant aux composés C15-. Cette coupe contient des hydrocarbures saturés et aromatiques. Les études cinétiques sur la stabilité thermique des aromatiques exigent de travailler avec une fraction aromatique sans traces de produits saturés et de disposer d’informations détaillées sur sa composition. Nous avons donc, tout d’abord, développé une méthode permettant de réaliser une nette séparation de ces deux familles. La chromatographie en phase liquide sur colonne de silice activée a ainsi été optimisée pour obtenir une fraction aromatique complète et pure, en quantités suffisantes pour les études de caractérisation et toutes les études cinétiques ultérieures. Puis, la chromatographie en phase liquide haute performance préparative (PHPLC) a été employée, sur une aliquote, pour fractionner les composés aromatiques en fonction du nombre de noyaux aromatiques en monoaromatiques, indènes, diaromatiques et biphényles. Une caractérisation moléculaire détaillée des sous-fractions ainsi obtenues a été réalisée par chromatographie en phase gazeuse couplée à la spectrométrie de masse (CG/SM). Les constituants aromatiques ont été ensuite quantifiés individuellement par GC-FID. Ces composés sont le benzène, les C1-C7benzènes, le naphtalène, les C1-C2naphtalènes, l’indane, les C1-C4indanes, l’indène, les C1-C2 indènes, les C1-C3 tétralines et les composés aromatiques soufrés (m et éthyl-benzothiophènes). La connaissance détaillée ainsi obtenue, sur la composition des différentes classes et leur abondance relative dans les aromatiques C15-totaux, permettra de suivre leur évolution lors des études de craquage thermique ultérieures.
Abstract — Separation and Characterisation of the C15-Aromatic Fraction of Safaniya Crude Oil —
The purpose of this work is to isolate and characterise the light fraction of Safaniya, a conventional non-biodegraded type II crude oil. This fraction is devoted to perform a kinetic study on the thermal stability of the light aromatic fraction of crude oil. The light cut <250°C, corresponding to the C15-components, was obtained by fractionated distillation. This cut contains saturated and aromatic hydrocarbons. Kinetic studies on the thermal stability of aromatics require to separate the aromatic fraction without any trace of saturated compounds and derive detailed information on its composition. We have therefore
INTRODUCTION
Oil in reservoirs undergoes thermal alteration leading to lighter oil, gas and pyrobitumen. Obtaining detailed infor-mation on such alteration is of prime importance, in relation with petroleum exploration and with the prediction of oil and gas quantity and quality. The thermal evolution of reservoir oil is controlled by the kinetics of cracking reactions (Tissot and Welte, 1984). These reactions, naturally occurring at low temperature and for geological time scale, can be simulated by laboratory pyrolysis experiments at high temperature for short time (Tissot and Welte, 1984; Ungerer, 1990; Béhar et al., 1991, among others). Contrary to alkanes, the cracking of the aromatic hydrocarbons of oil and the reaction mechanisms involved are still far from been clearly understood and have been examined more recently. In our work on the stability of the aromatic compounds of crude oils we aim to predict such stability through a model derived from laboratory pyrolyses, using a molecularly well char-acterised aromatic fraction isolated from a selected standard crude oil.
The first objective of this work is to perform preparative isolation of the light aromatic fraction of a crude oil for future kinetic studies by closed pyrolysis in gold tubes. The second objective is to determine the molecular composition of the isolated aromatic fraction. Indeed, detailed qualitative and quantitative knowledge is required for the kinetic studies where aromatic constituents will be lumped in different classes according to their estimated thermal stability.
Crude oils are often separated in groups SARA (saturated, aromatic, resins and asphaltenes) by different chroma-tographic techniques. Fractionation is based on difference in solubility and polarity. Normal phase planar chroma-tography, which includes preparative plate chromatography and thin layer chromatography (TLC), has been used for a long time to separate hydrocarbons into group types using silica gel as stationary phase and different solvents (Huc
et al., 1976). The limitation of this technique is that it
separates small quantities and cannot be used for volatile fraction separation. Nevertheless it remains a rapid technique
to separate heavy fractions. Recent developments of high performance thin layer chromatography (HPTLC) have permitted to investigate its analytical capacities for quantitative determination of hydrocarbon types when coupled with scanning densiometric detection (Membrado
et al., 2002; Matt et al., 2002, 2003) or with flame ionisation
detection (TLC-FID) (Sharma et al., 1998; Kamin´ski et al., 2003).
The more widely used technique to separate crude oils into groups is liquid chromatography (LC). This procedure is often called SARA analysis. Oil is first topped at 210°C; asphaltenes are then precipitated in n-heptane at 100°C under reflux for 10 min. After filtration and solvent evaporation, the maltenes (deasphalted oil) are fractionated by LC. Different chromatographic configurations exist; low-pressure chroma-tography is carried out on open columns, automated techniques comprise medium pressure liquid chromatography (MPLC) and high performance liquid chromatography (HPLC) (Radke et al., 1980, 1984). Activated silica gel is generally used as stationary phase and separation is achieved by sequential elutions with different solvents. The saturated hydrocarbons are not adsorbed and can thus be eluted using a paraffinic solvent or petroleum ether. Thereafter, aromatic compounds are desorbed. Finally, resins are recovered by polar mobile phase, preferentially by retro elution. The same concept is widely found in the literature but elution schemes are different and each variation in the procedure may influence required separation time and fraction overlapping. Saturated, aromatics and resins are respectively eluted with one of the following sequences: n-hexane, n-hexane, DCM/ methanol (50/50) (Radke et al., 1980); n-hexane, n-hexane, trichloromethane (Aske et al., 2001); n-pentane, toluene, toluene/methanol (90/10) (Vazquez and Mansoori, 2000); petroleum ether, DCM, DCM/ethanol (50:50) (Li et al., 1998).
Total aromatic fraction can be also separated into different sub-fractions (mono-, di-, tri- and polyaromatics) on an alumina column or on a bonded silica column. This additional fractionation can be carried out on an isolated aromatic fraction or be integrated in the SARA analysis. Svebor et al.
developed a method permitting to achieve a clear-cut separation of these two families. Liquid phase chromatography on activated silica gel column was thus optimised for separating a complete and pure aromatic fraction, in large enough amounts for characterisation and all subsequent kinetic studies. Thereafter, Preparative High Performance Liquid Chromatography (PHPLC) of an aliquot was used to separate the aromatic compounds according to aromatic ring number into monoaromatics, indenes, diaromatics and biphenyls. Detailed molecular characterisation of the aromatic sub-fractions thus obtained was achieved by Gas Chromatography coupled to Mass Spectrometry (GC/MS). Then, individual aromatic compounds were quantified by GC-FID. These compounds are benzene, C1-C7 benzenes, naphthalene, C1-C2naphthalenes, indane, C1-C4 indanes, indene, C1-C2 indenes, C1-C3 tetralins and and sulphur-containing aromatics (methyl- and ethylbenzothiophenes). The detailed knowledge thus derived on the composition of different class and its relative abundance in the total C15 -aromatics will allow following its temporal evolution during subsequent pyrolysis experiments.
(1999) optimised the preparative separation on a dual silica gel-neutral alumina column: saturated hydrocarbons were eluted with hexane, monoaromatics with hexane/benzene (24:1), diaromatics with hexane/benzene (22:3), poly-aromatics with benzene and resins with benzene/ether/ methanol (1:1:3). Jiang et al. (2000) demonstrated that the modified SARA analysis proposed by Li et al. (1992), using neutral alumina, is inadequate to separate saturated and monoaromatic hydrocarbons.
Radke et al. (1984) split total aromatic fractions by HPLC into four sub-fractions using an alumina column and a stepwise gradient of DCM in n-hexane. Li et al. (1998) separated aromatic fractions on an alumina column into monoaromatics, diaromatics, polyaromatics I and
polyaromatics II by eluting respectively with DCM/ petroleum ether (2:98), DCM/petroleum ether (10:90), DCM and DCM/methanol (50:50). Budzinski (1993) separated the aromatic fraction by HPLC on a NH2-bonded silica column.
In the present study we aimed at fractionating a light cut which contains only saturated and aromatic fractions. Considering the above mentioned procedures we have searched to optimise the preparative separation of saturates and aromatics using lightest solvents (n-pentane/DCM) as in Béhar et al. (1989) since solvent evaporation without any loss of volatile compounds is required. Other solvents utilized in the literature may be inadequate because their elimination alters severely the composition of the charge and
Fractionated distillation
Preparative sat.-aro. column fractionation
Solvent elimination from aromatic fraction
by rotary evaporation and distillation Preparative HPLC fractionation of pure aromatic fraction Volatile compounds analysis by carburane GC of pentane-soluble oil Volatile compounds analysis by carburane Analysis by GC-MS and GC-FID Sat.-aro. fractionation on mini-column 250- saturated fraction Saturated and aromatic
fractions analysis by GC-FID
GC-MS analysis of sub-fractions: molecular
identification
GC-FID analysis of sub-fractions: individual compound quantification 250- cut
250- aromatic fraction Safaniya crude oil
Figure 1
some of them such as benzene and toluene are present in the light cut. Thereafter, the isolated aromatic fraction was separated into monoaromatics and diaromatics by preparative HPLC using the same solvents (n-pentane/DCM) and NH2 -bonded silica column as in Budzinski (1993).
Accordingly, our research strategy is as follows:
– Selection of a standard crude oil and characterisation of its highly volatile fraction. Distillation to obtain a light cut in a range (up to C14) such that identification and quantification of all of its aromatic constituents should be feasible. – Isolation of the aromatics in large amounts through
separation of this cut into saturated and aromatic components.
– Detailed qualitative and quantitative characterisation of an aliquot of this aromatic fraction at a molecular level using a combination of GC, GC/MS and HPLC analyses. Figure 1 shows the corresponding analytical flow chart.
Analytical techniques used in this paper are GC, GC/MS and HPLC. Theses complementary techniques have per-mitted to achieve a satisfactory characterisation of the light aromatic fraction. Meanwhile, very recent developments in multidimensional techniques such as LC×GC, GC×GC or GC×GC/MS can offer a powerful tool for complex sample analysis and increase identification and quantification capability. For instance, comprehensive two-dimensional GC applicability in petroleum sample analyses have recently been investigated (Frysinger and Gaines 1999; Beens et al., 2000; Van Deursen et al., 2000; McCurry and Quimby, 2003; Vendeuvre et al., 2004). Nevertheless the complexity of the GC×GC might delay its entrance to the GC mainstream (Hinshaw 2004).
1 SAMPLE
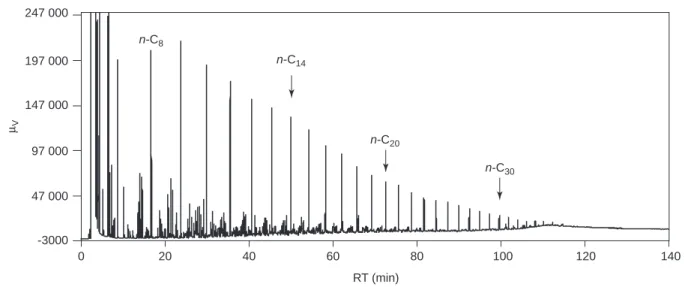
A conventional crude oil of the Middle East (Safaniya, Saudi Arabia) was selected, since this is a non-biodegraded type II oil of marine origin, therefore representative of the largest fields actually in production. This oil was available in a large amounts (1000 l) enabling storage under good conditions. Crude oil was diluted in pentane (oil/pentane ratio: 1/200 v/v), a solvent that efficiently dissolves saturated and aromatic hydrocarbons, and analysed by gas chroma-tography. A Varian 3800 gas chromatograph was used. The programmable temperature vaporising (PTV) injector was programmed from 20 to 320°C at a heating rate of 200°C/min. A HP5 phenyl/methyl polysiloxane capillary column (60 m length, 0.25 mm ID, 0.25 µm film thickness) was used. Helium was used as carrier gas with a flow rate of 2 ml/min at the column outlet. CO2was used as a cryogenic gas to maintain the oven at 20°C for 10 min, before heating to 320°C at a rate of 3°C/min and holding this temperature for 30 min. The flame ionisation detector (FID) was heated at 320°C. Flame conditions were air: 300 ml/min, H2: 30 ml/min and nitrogen was employed as a make-up gas with a flow rate of 25µl/min. Analysis time was 140 min. A volume of 1µl was injected with a 5 µl syringe.
Figure 2 shows the chromatogram obtained for this crude oil, which reflects its complexity. One can distinguish
n-paraffin peaks up to n-C35, which characterises a non-biodegrade oil and a large number of other types of compounds coelute giving a non resolved baseline.
A dedicated gas chromatographic method (IFP 9420) was carried out to identify and quantify the lightest compounds
247 000 -3000 47 000 97 000 147 000 197 000 0 20 µV 40 60 80 RT (min) 100 120 140 n-C14 n-C20 n-C30 n-C8 Figure 2
using a specific database from the Carburane®‚ software
developed at the IFP. This software enables chromatographic data processing to provide detailed analysis of compounds from several types of petroleum samples such as light saturated and aromatic compounds of crude oil (C3-C20) (Durand et al., 1989). The GC method is performed using a column, a dedicated device for backflushing the pre-column in order to vent out heavy fractions and a high-resolution capillary analytical column where the separation of solutes is carried out. Crude oils are injected after dilution in carbon disulphide CS2(50:50 v/v), because the response factor of this solvent is very weak with FID detection. An internal standard is added to the samples before analysis: 2,4,4-trimethyl-1-pentene (1% by weight). The C18+fraction is eliminated from the pre-column by a back flush programmed at 95 min.
The presence of soluble gaseous compounds (propane,
n-butane and isobutane) and of highly volatile compounds
like n-pentane (Fig. 3) confirms that the crude oil sample was stored under proper conditions. The sum of these compounds represents c.a. 2% (wt) of the crude oil (Table 1). The lightest aromatic compounds are benzene and toluene and their relative abundance in the crude oil is B/T = 0.255 (wt/wt).
In order to separate the light components, fractionated distillation of the crude oil was carried out and gave 4 distillation cuts (250-°C, 250-375°C, 375-550°C and 550+°C). A total of 3.5 kg was distilled using two columns. Up to 375°C an automatic distillation procedure was carried out using an adiabatic-true boiling point column (100 cm
×25 mm) packed with multiknits using the ASTM D2892
TABLE 1
Detailed analysis of the soluble gaseous compounds and of the highly volatile compounds in Safaniya crude oil
Compound Wt% n-propane 0.04 iso-butane 0.04 n-butane 0.24 iso-pentane 0.30 n-pentane 0.57 2,2-dimethylbutane 0.01 cyclopentane 0.04 2,3-dimethylbutane 0.06 2-methylpentane 0.36 3-methylpentane 0.31 Sum 1.97
standard method. Operation pressure was atmospheric pressure up to 150°C, then 100 mmHg up to 250°C, and 2 mmHg up to 375°C. Distillation up to 550°C was carried out using a non packed Postill column (40 cm×25 mm) using the ASTM D5236 standard method. This distillation was carried out under vacuum (0.3 mmHg). The Safaniya oil exhibits a high content of 250- distillate (ca. 24%). This cut corresponds to the C15-range that comprises compounds of all the saturated and aromatic families present in conventional oils. The 250- cut thus recovered was analysed by GC (not shown), under the same conditions as above. Comparison with the chromatogram of the whole oil indicated that no significant loss of the lightest hydrocarbons 450 000 400 000 350 000 300 000 250 000 200 000 150 000 100 000 50 000 0 µV n -propane iso -butane n -butane iso -pentane n -pentane n -hexane n -heptane Benzene Toluene Solvent CS 2 Cyclopentane + 2,3-dimethylbutane 2-methylpentane 3-methylpentane Figure 3
occurred upon distillation. The virtually complete recovery obtained upon this fractionated distillation (250-°C: 24.2%, 250-375°C: 19.0%, 375-550°C: 24.9% and 550+°C: 31.9%) also showed that no significant loss of the lightest com-ponents took place. The soluble gaseous and highly volatile compounds were quantified in the 250- cut by the IFP 9420 method and their abundance was 7.8% (wt). This value is consistent with their abundance in the whole crude oil (c.a. 2%, Table 1) as this cut represents 24.2% of the total oil. 2 AROMATIC FRACTION ISOLATION
BY LIQUID PHASE CHROMATOGRAPHY
2.1 Separation of Saturated and Aromatic Fractions on Mini-Column
As observed for all conventional oils, the 250- distillation cut of Safaniya is a mixture of saturated and aromatic hydro-carbons. An analytical protocol to separate the saturated and aromatic fractions of crude oils by liquid phase chroma-tography, using silica gel mini-columns was reported by Béhar et al. (1989). The mini-column is a Pasteur pipette filled with 1 g of silica gel (silica gel 60 Merck Ref. 107734, granulometry 0.063-0.200 mm), washed beforehand with dichloromethane (DCM). The silica gel (300 g) is heated in a boiling flask with DCM (500 ml) under reflux at 50°C for 1 h, then filtered and rinsed with DCM and activated at 140°C under vacuum for 1 h. The charge loaded onto the mini-column is 0.5 to 1 ml of a solution of the crude oil in pentane (2-20 mg/ml). Two elutions successively give the saturated fraction (2.5 ml of pentane) and the aromatic fraction (2.5 ml of a 85/15 (v/v) pentane/DCM mixture). In the initial analytical protocol the eluates were concentrated and quantified by GC using external calibration with different concentrations of a standard deparaffinated oil cut. In order to minimise the uncertainties in fraction quantification, this protocol was modified by adding two internal standards to the solution before fractionation: a saturated hydrocarbon and an aromatic hydrocarbon. Long-chain n-alkanes are well eluted by this chromatographic
system; n-pentacosane was thus used as standard for the saturated fraction as it was employed in different parts of this study. Aromatic internal standard choice was limited, as heavier aromatic compounds could not be completely eluted using the selected mobile phase. Naphthalene was therefore used although it is present in the charge. Its original concentration was calculated by performing one additional fractionation without internal standard and taken into account the relative abundance thus determined in the quantification. Accordingly, the first eluate corresponded to the saturated fraction + n-pentacosane and the second one to the aromatic fraction + naphthalene. The internal standards (20 mg each) were added to 100 ml of the 250- cut solution in pentane (15 mg/ml). The added naphthalene/original naphthalene ratio was then 17. Aliquots of 1 ml of this spiked solution were fractionated on mini-columns and the two successive elutions were carried out drop wise. Eluates were concentrated to 1 ml and their purity (lack of aromatics in the saturate fraction and vice versa) checked out by GC/MS. In addition, experiments were carried out in order to quantify saturated and aromatic fractions by GC-FID without concentration
(Fig. 4).
The GC (conditions as in Section 1) was calibrated for saturated and aromatic compounds using n-pentacosane and naphthalene, respectively. Relative response factor of naphthalene compared to n-pentacosane was calculated (RRF naph/n-C25 = 1.09). Aromatic compound response is higher than for saturated compounds as the former are richer in carbon and the intensity of the FID signal depends on compound combustion. Each fraction was quantified using its internal standard. The integration of the chromatograms was carried out by the Galaxy®‚ software that allows slice
integration after subtracting the signal corresponding to the blank (the solvent) from that of the sample.
Quantitative analysis was performed, without concen-tration of the eluates, nevertheless the most volatile saturated compounds were partially lost upon fractionation and the remaining part is not quantifiable as it coelutes with the solvent. The recovered C6-C14compounds thus represent 90.3% of the initial cut (Table 2). The lost plus non
TABLE 2
Proportions of the saturated and aromatic fractions in Safaniya 250- cut
IFP 9420 method Isolated fractions
Fraction C3-C14compounds (%) C6-C14compounds (%) C6-C14compounds (%)
Abundance (*) Relative proportions Abundance (*) Relative proportions
Saturated 84.1 76.3 82.8 77.0 85.3
Aromatic 15.9 15.9 17.2 13.3 14.7
Sum 100 92.2 100 90.3 100
quantifiable compounds therefore represent 9.7% of the 250-cut, which is consistent with the proportion of the soluble gaseous and highly volatile compounds determined before fractionation (7.8%).
The relative abundance of the isolated C6-C14 saturated and aromatic fractions is 85.3% and 14.7%, respectively
(Table 2). These results were compared to those obtained by
the direct analysis without fractionation (IFP 9420 method) which are somewhat different from the above ones (17.2% for the aromatic fraction instead of 14.7%). This is probably due to the occurrence of some coelutions of saturated and aromatic compounds when analysis is done without prior fractionation.
2.2 Preparative Isolation of the Aromatic Fraction To isolate the aromatic fraction in large amounts, it was necessary to adapt the liquid phase chromatography fractionation to preparative dimensions. To this end, we used a 70 cm length×2 cm internal diameter column equipped with a Teflon tap and a glass-frit disc. The column was filled
with 80 g of silica gel washed with DCM and activated at 140°C as previously indicated. Several fractionation expersiments were performed to determine optimal conditions, i.e. complete separation of the saturated and aromatic fractions for a maximum load and a minimum quantity of solvent. For this purpose various elution patterns (number of eluates recovered, volume and composition of the mobile phase used for each of these eluates) were tested for different loads. The eluates were analysed by GC and GC/MS and compared to the saturated and aromatic fractions obtained by mini-column separation. The best conditions thus obtained were: a 3.5 ml (ca. 2.6 g) load of the 250- cut, a first elution with 100 ml of pentane affording the total saturated fraction, a second intermediate elution with 50 ml of 85/15 (v/v) pentane/DCM mixture and final elution with 250 ml of the same pentane/ DCM mixture affording the total aromatic fraction. Figure 5 shows the GC traces of the three eluates thus obtained. As illustrated in this Figure, a clear-cut separation was achieved between the saturated and aromatic components. Indeed, no products were detected, even in trace amounts, in the intermediate fraction. The purity of the
n-C7 n-C10 n-C14 n-C25 IS Aromatic fraction Saturated fraction IS naphthalene Benzene 0 10 20 30 40 50 RT (min) 60 70 80 90 100 Figure 4
Chromatogram of the saturated and aromatic fractions of Safaniya 250- cut separated on mini-column (GC-FID on HP5 capillary column-conditions as in Section 1).
saturated and aromatic fractions was further ascertained by GC/MS analyses after concentration (solutions volume was reduced to 50 ml by rotary evaporation). For this we used selective ion detection (SID) to search for:
– the characteristic ions of the saturated compounds (m/z = 57, 71, 85) in the aromatic fraction;
– the characteristic ions of the aromatic compounds, with focus on the alkylaromatics, (m/z = 78, 91, 105, 119, 133) in the saturated fraction. The absence of these ions in the two cases confirms the complete recovery of the aromatic fraction and its purity.
The above conditions were used to isolate enough aromatic fraction (ca. 10 g) to carry out detailed character-isation and especially all the pyrolysis experiments planned for the kinetic studies. About 400 mg of aromatics, in 250 ml of pentane/DCM, are obtained for one separation exper-iment. Twenty-eight runs were therefore carried out, affording a total volume of seven litres of aromatic eluates. Complete elimination of pentane/DCM is required for the subsequent studies. Alteration of the composition of the aromatic fraction, through selective removal of the lightest aromatics along with the solvent, must be strictly avoided during that removal. To this end, the elimination of the solvent was achieved in two steps: ca. 80% was eliminated by rotary evaporation under mild conditions: 37°C under
atmospheric pressure. The remaining solvent was eliminated by distillation. The distillation apparatus was made of the following components: 500 ml boiling flask, a vertical Vigreux column (40 cm length, 25 mm diameter) and a condenser. Vapour temperature was measured at the top of the column. The boiling points of pentane and DCM are only 36 and 40°C, respectively, while that of benzene, the most volatile constituent of the aromatic fraction is 80°C. Due to this gap, a pure unaltered aromatic fraction could be isolated. The lack of trace amounts of residual pentane and DCM was checked by GC by diluting an aliquot of the aromatic fraction in CS2 before re-analysis by GC. Benzene/toluene ratio is 0.248 whereas it was 0.255 in the crude oil which confirms that benzene loss is negligible. In order to prevent any alteration of the aromatic fraction upon storage, especially by oxygen and light, it was stored under nitrogen in hermetic sealing and opaque vials in a glove box with a nitrogen atmosphere.
3 CHARACTERISATION
OF THE AROMATIC FRACTION
Detailed characterisation of the 250- aromatic fraction was achieved by qualitative and quantitative analyses, using
10.00 20.00 30.00 40.00 50.00 60.00 (min) 0.0E + 00 8.0E + 05 µV µV µV 6.0E + 05 4.0E + 05 2.0E + 05 0.0E + 00 8.0E + 05 6.0E + 05 4.0E + 05 2.0E + 05 0.0E + 00 5.0E + 05 1.0E + 06 1.5.0E + 06 2.0E + 06 2.5.0E + 06 (1) 100 ml pentane (2) 50 ml pentane/DMC (85/15) (3) 250 ml pentane/DMC (85/15) Benzene n-C7 n-C14 10.00 20.00 30.00 40.00 50.00 60.00 (min) 10.00 c) b) a) 20.00 30.00 40.00 50.00 60.00 (min) Figure 5
Chromatograms of the three eluates (a: saturated fraction; b: intermediate fraction; c: aromatic fraction) obtained by optimised preparative separation of Safaniya 250- cut.
GC/MS and GC-FID, respectively. The objective was to identify and quantify all the individual constituents of the fraction. Preparative High Performance Liquid Chromatography (PHPLC) was performed to facilitate GC/MS and GC analyses.
3.1 PHPLC Fractionation
Aromatic compounds can be fractionated according to aromatic ring number by normal phase HPLC as indicated in the Introduction. To perform this fractionation, on an aliquot of the C15-aromatic fraction of Safaniya, we used a semi-preparative Varian Dynamax column (250 mm length, 10 mm internal diameter) with dynamic axial compression. The column was filled with Microsorb amino (NH2-bonded silica) stationary phase, particle size 5µm and pore size 100 Å. A guard cartridge packed with the same stationary phase was used as a pre-column. The mobile phase was pentane from 0 to 24 min, then a 90/10 (v/v) pentane/DCM mixture in isocratic mode from 24 to 55 min. Flow rate was set at 2 ml/min from 0 to 17 min, and then increased to 4 ml/min for the end of the run. A UV-visible detector (wavelength 254 nm) was employed. A volume of 200 µl of the aromatic fraction solution (20 mg/ml pentane) was injected and the obtained chromatogram is shown on Figure 6. The eluate was collected at the detector outlet and four sub-fractions were separately recovered: F1 (0-11.8 min), F2 (11.8-13.7 min), F3 (13.7-15.2 min) and F4 (15.2-20 min). These sub-fractions were analysed by GC/MS for molecular identification and by GC-FID for quantification.
Figure 6
Chromatogram obtained by LC of the aromatic fraction of Safaniya 250- cut.
The objective of this separation was to separate mono-aromatics and dimono-aromatics and HPLC permitted to fulfil this
purpose. The intermediate sub-fraction (F2: indenes) has not been mentioned in literature, it was here isolated to ensure clear-cut fractionation. Overlapping of this fraction with the two principles peaks (F1 and F3) is negligible since its total percentage is < 0.2% (wt).
3.2 Molecular Identification by GC/MS
Sub-fraction solutions obtained by PHPLC were con-centrated (to 500 µl) and detailed GC/MS analyses were performed in order to identify all their constituents. A HP 6890 gas chromatograph was used with a PTV injector in splitless mode. The injector was initially set at 50°C, then heated to 250°C at a rate of 120°C/min and kept at 250°C. A HP5 phenyl/methyl polysiloxane capillary column (30 m length, 0.25 mm ID, 0.25 µm film thickness) was used. The oven was held at 50 C for 15 min then heated to 250C at 3°C/min and kept at this temperature for 30 min. Helium was used as carrier gas and the column head pressure was set at 11 psi. The injected volume was 1µl. The GC was coupled to a mass spectrometer equipped with an ionisation source (electronic impact mode, ionisation energy 70 eV) heated at 230°C. The analyser was a quadrupole heated at 150°C. The detector was an electron multiplier (EM). “Full scan” mode was used for detection (50-500 amu mass range at a rate of 1 scan/s, detector resolution 1000). Peak by peak identification was performed using the NIST spectrum library.
The first sub-fraction isolated by PHPLC (Figs. 7a, 7b) is composed of monoaromatics: benzene, toluene, xylenes, a number of C2-C7 alkylbenzenes, indane, methyl- and C2- to C4-indanes, methyl- and C2- to C3-tetralins. Indene, along with methyl- and ethylindenes were identified in trace amounts in the second sub-fraction. The third sub-fraction
(Fig. 8) contains the diaromatic compounds: naphthalene,
methylnaphthalenes, numerous C2-naphthalenes and trace amounts of sulphur-containing aromatics: chiefly C2 -benzothiophenes. Trace amounts of biphenyls were identified in the fourth sub-fraction. Differentiation between some isomers was not possible using GC/MS as they have the same mass spectrum. Comparison with literature was done when possible, for instance Pérez-Parajón et al. (2004) for methylbenzenes and Budzinski (1993) for methyl-naphthalenes.
3.3 Quantitative Analysis by GC-FID
HPLC sub-fractions were analysed by GC-FID in order to determine the percentage of each compound, after addition of an internal standard (n-pentacosane 100µg/ml). A Varian 3800 gas chromatograph was used with the HP5 column using the same conditions as above (Section 1). The PTV injector (high performance liner in cold on-column mode) of this chromatograph affords improved quantitative results -1 5 10 15 20 25 30 35 40 RT (min) 5 7 9 11 13 15 17 19 Absorbance F1 monoaromatics F3 diaromatics + aro.-S F2 indenes F4 biphenyls
39.6 40.1 40.6 41.1 41.6 RT (min) RT (min) RT (min) 42.1 34.5 35.5 19 21 23 25 27 29 31 33 17 15 36.5 37.5 38.5 39.5 42.6 43.1 43.6 137 000 344 000 294 000 244 000 194 000 144 000 94 000 44 000 -6000 117 000 97 000 77 000 57 000 37 000 17 000 -3000 117 000 97 000 77 000 57 000 37 000 17 000 -3000 + Figure 7a
without discrimination between compounds due to differ-ences in molecular weight. Individual peaks were integrated using Galaxy®software. Concentrations were then calculated
by comparison with the internal standard and corrected by the relative response factors. Mixtures of seven repre-sentative pure reference compounds were analysed under the same conditions in order to calculate their relative response factors in comparison to the internal standard (n-C25). Responses of the different aromatic compounds were higher compared to the saturated compound and varied in a restricted range (1.07 ± 0.02). The detailed quantitative data thus obtained are reported in the Appendix.
CONCLUSION
Column chromatography fractionation was scaled up to separate the saturated and aromatic components of the C 15-distillation cut (< 250°C) of Safaniya crude oil. Large enough amounts of the complete and pure aromatic fraction of this crude oil were thus isolated for characterisation and future kinetic studies. Saturated and aromatic fractions proportions for the C6-C14compounds (85.3% sat./14.7% aro.) were compared to those obtained by the IFP 9420 method (82.8% sat./17.2% aro.) a method permitting simultaneous analysis of saturated and aromatic fractions. The latter method is
44.3 44.8 45.3 45.8 46.3 46.8 47.3 48.6 43.8 47.6 49.6 50.6 51.6 52.6 RT (min) RT (min) 79 000 9000 -1000 19 000 29 000 39 000 49 000 59 000 69 000 79 000 69 000 59 000 49 000 39 000 29 000 19 000 9000 -1000 C6 C6 C6 C6 C6 C7 C6 Figure 7b
especially convenient to quantify highly volatile compound and global family proportions.
Detailed qualitative and quantitative analysis of Safaniya aromatics were performed, using GC/MS and GC-FID, respectively, on the sub-fractions (monoaromatics, indenes, diaromatics and biphenyls) separated by PHPLC of an aliquot. All individual compounds (C0-C7benzenes and C0 -C2 naphthalenes, C0-C4 indanes, C0-C2 indenes, C1-C3 tetralins and C1-C2benzothiophenes) were thus identified and quantified. Kinetic studies, aimed at simulating the thermal
degradation of the C15-aromatic components of crude oils under geological conditions, will be based on the detailed information thus obtained on Safaniya aromatics and will use the analytical protocol developed in the present work.
ACKNOWLEDGEMENTS
We thank P. Paul for fractionated distillation, C. Leblond and G. Caillet for technical assistance and J. Bellocq for her help
50 51 52 53 54 55 56 40 45 50 55 60 65 RT (min) RT (min) 78 000 68 000 58 000 48 000 38 000 28 000 18 000 8000 -2000 -1000 4000 9000 14 000 19 000 24 000 29 000 34 000 39 000 S S S + + Figure 8
in HPLC fractionation. Valuable comments of reviewers are gratefully acknowledged.
REFERENCES
Aske, N., Hallevik, H. and Sjöblom, J. (2001) Determination of Saturated, Aromatic, Resin and Asphaltenic (SARA) Components in Crude Oils by Means of Infrared and Near-Infrared Spectroscopy. Energy & Fuel, 15, 1304-1312.
Beens, J., Blomberg, J. and Schoenmakers, P.J. (2000) Proper Tuning of Two-Dimensional Gas Chromatography (GC×GC) to Optimize the Separation of Complex Oil Fractions. J. High
Resolut. Chromatogr., 23, 182-188.
Béhar, F., Leblond, C. and Saint-Paul, C. (1989) Analyse quanti-tative des effluents de pyrolyse en milieu ouvert et fermé. Revue
de l’Institut français du pétrole, 44, 3, 387-411.
Béhar, F., Kressmann, S., Rudkiewicz, J.L. and Vandenbroucke, M. (1991) Experimental Simulation in a Confined System and Kinetic Modelling of Kerogen and Oil Cracking. Org. Geochem.,
19, 1-3, 173-189.
Budzinski, H (1993) Les composés aromatiques alkylés dans les échantillons pétroliers : aspects physico-chimiques et thermo-dynamiques. Thèse, université Bordeaux I.
Durand, J.P., Barreau, A. and Fafet, A. (1989) Direct and Automatic Capillary GC Analysis for Molecular Weight Determination and Distribution in Crude Oil and Condensate up to C20. J. High Resolut. Chromatogr., 12, 230-234.
Frysinger, G.S. and Gaines, R.B. (1999) Comprehensive Two-Dimensional Gas Chromatography with Mass Spectrometric Detection (GC×GC/MS). J. High Resolut. Chromatogr., 22, 251-255.
Hinshaw, J.V. (2004) Comprehensive Two-Dimensional Gas Chromatography. LC-GC Eur., 17, 2, 2-7.
Huc, A.Y., Roucaché, J., Bernon, M., Caillet, G. and Da Silva, M. (1976) Application de la chromatographie en couche mince à l’étude quantitative des extraits de roche et des huiles. Revue de
l’Institut français du pétrole, 31,1, 67-98.
Jiang, C., Li, M. and Van Duin, A.C.T. (2000) Inadequate Separation of Saturate and Monoaromatic Hydrocarbons in Crude Oils and Rock Extracts by Alumina Column Chromatography.
Org. Geochem., 31, 751-756.
Kamin´ski, M., Gudebska, J. Górecki, T. and Kartanowicz, R. (2003) Optimized Conditions for Hydrocarbon Group Type Analysis of Base Oils by Thin-Layer Chromatography. J.
Chromatogr. A, 991, 255-266.
Li, M., Larter, S.R., Stoddart, S. And Bjorøy, M. (1992) Practical Liquid Chromatography Separation Schemes for Pyrrolic and Pyridinic Nitrogen Heterocyclic Fractions from Crude Oils Suitable for Rapid Characterisation of Geological Samples. Anal.
Chem., 64, 1337-1344.
Li, Y., Deng, X. and Yu W. (1998) Groupe-type Analysis of Heavy Petroleum Fractions by Preparative Liquid Chroma-tography and Synchronous Fluorescence Spectrometry: Analyses of Aromatics by Ring Number of Liaohe Vacuum Gas Oil, Coker Gas Oil and Heavy Cycle Oil. Fuel, 77, 4, 277-284.
Matt, M., Galvez, E.M., Cebolla, V.L., Membrado, L., Vella, J. and Gruber, R. (2002) Planar Chromatography for the Hydrocarbon Group Type Analysis of Petroleum Middle Distillates and Coal-Derived products. Fuel Process. Tech.,
77-78, 245-253.
Matt, M., Galvez, E.M., Cebolla, V.L., Membrado, L., Bacaud, R. and Pessayre, S. (2003) Improved Separation and Quantitative Determination of Hydrocarbon Types in Gas Oil by Normal Phase High-Performance TLC with UV and Fluorescence Screening Densiometry. J. Sep. Sci., 26, 1665-1674.
McCurry, J.D. and Quimby, B.D. (2003) Two-Dimensional Gas Chromatography Analysis of Components in Fuel and Fuel Additives Using Simplified Heart-Cutting GC System. J.
Chromatogr. Sci., 41, 524-527.
Membrado, L., Cebolla, V.L., Matt, Galvez, E.M., Domingo, M.P., Vela, J. and Beregovtsova, N. (2002) Hydrocarbon Group-Types Analysis by Thin Layer Chromatography and Screening Densiometry. J. Planar Chrromatogr.-Modern TLC., 15, 268-273. Pérez-Parajón, J.M., Santiuste, J.M. and Takács, J.M. (2004) Prediction of the Retention Indices of Benzene and Methyl-benzenes Based on their Retention Data-Physico Chemical Proprties Relationship. Chromatographia, 60, 199-206.
Radke, M., Willsch, H., and Welte, D.H. (1980) Preparative Hydrocarbon Groupe Type Determination by Automated Medium Pressure Liquid Chromatography. Anal. Chem., 52, 406-411. Radke, M., Willsch, H., Garrigues, P., Sury, R. and Ewald, M. (1984) Identification of Dimethyl- and Ethylphenanthrenes in HPLC Fractions of Rock and Coal Extracts by Capillary Gas Chromatography and High Resolution Spectrofluorometry at 15 K. Chromatographia, 19, 355-361.
Svebor, G., Blazvek, J. and Nemer, M.F. (1999) Optimization of the Preparative Separation of Petroleum Maltenes by Liquid Adsorption Chromatography. J. Chromatogr. A, 847, 323-330. Sharma, B.K., Sarowha, S.L.S., Bhagat, S.D., Tiwari, R.K., Gupta, S.K. and Venkataramani, P.S. (1998) Hydrocarbon Group Type Analysis of Petroleum Heavy Fractions Using TLC-FID Techniques. Fresenius J. Anal. Chem., 360, 539-544.
Tissot, B. and Welte, D.H. (1984) Petroleum Formation and
Occurrence, 2nd edition, Springer Verlag Berlin.
Ungerer, P. (1990) State of the Art of Research in Kinetic Model-ling of Oil Formation and Expulsion. Org. Geochem., 16, 1-25. Van Deursen, M., Beens, J., Reijenga, J., Lipman, P. and Cramers, C. (2000) Groupe-Type Identification of Oil Samples Using Comprehensive Two-Dimensional Gas Chromatography Coupled to Time-of-Flight Mass Spectrometer (GC×GC-TOF).
J. High Resolut. Chromatogr., 23, 507-510.
Vazquez, D. and Mansoori, G.A. (2000) Identification and Measurement of Petroleum Precipitates. J. Petrol. Sci. & Eng.,
26, 1-4, 49-56.
Vendeuvre, C., Bertoncini, F., Duval, L., Duplan, J.L., Thiébaut, D. and Hennion, M.C. (2004) Comparison of Conventional Gas Chromatograph and Comprehensive Two-Dimensional Gas Chromatography for the Detailed Analysis of Petrochemical Samples. J. Chromatogr. A, 1056, 155-162.
Final manuscript received in March 2005
Copyright © 2005, Institut français du pétrole
Permission to make digital or hard copies of part or all of this work for personal or classroom use is granted without fee provided that copies are not made or distributed for profit or commercial advantage and that copies bear this notice and the full citation on the first page. Copyrights for components of this work owned by others than IFP must be honored. Abstracting with credit is permitted. To copy otherwise, to republish, to post on servers, or to redistribute to lists, requires prior specific permission and/or a fee: Request permission from Documentation, Institut français du pétrole, fax. +33 1 47 52 70 78, or revueogst@ifp.fr.
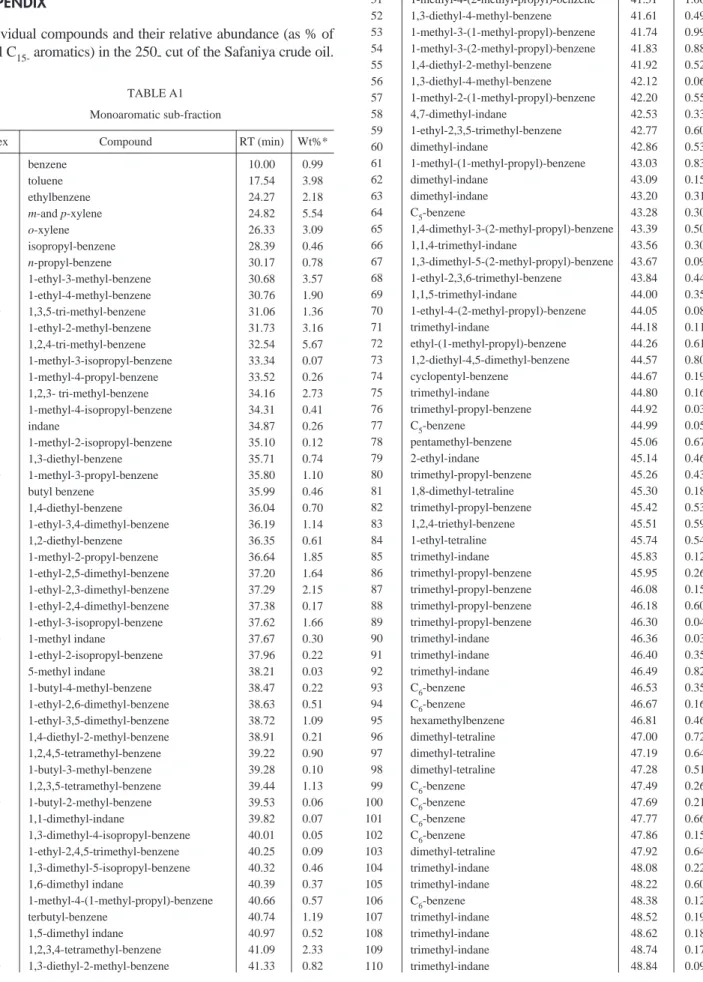
APPENDIX
Individual compounds and their relative abundance (as % of total C15-aromatics) in the 250- cut of the Safaniya crude oil.
TABLE A1 Monoaromatic sub-fraction
Index Compound RT (min) Wt%*
1 benzene 10.00 0.99 2 toluene 17.54 3.98 3 ethylbenzene 24.27 2.18 4 m-and p-xylene 24.82 5.54 5 o-xylene 26.33 3.09 6 isopropyl-benzene 28.39 0.46 7 n-propyl-benzene 30.17 0.78 8 1-ethyl-3-methyl-benzene 30.68 3.57 9 1-ethyl-4-methyl-benzene 30.76 1.90 10 1,3,5-tri-methyl-benzene 31.06 1.36 11 1-ethyl-2-methyl-benzene 31.73 3.16 12 1,2,4-tri-methyl-benzene 32.54 5.67 13 1-methyl-3-isopropyl-benzene 33.34 0.07 14 1-methyl-4-propyl-benzene 33.52 0.26 15 1,2,3- tri-methyl-benzene 34.16 2.73 16 1-methyl-4-isopropyl-benzene 34.31 0.41 17 indane 34.87 0.26 18 1-methyl-2-isopropyl-benzene 35.10 0.12 19 1,3-diethyl-benzene 35.71 0.74 20 1-methyl-3-propyl-benzene 35.80 1.10 21 butyl benzene 35.99 0.46 22 1,4-diethyl-benzene 36.04 0.70 23 1-ethyl-3,4-dimethyl-benzene 36.19 1.14 24 1,2-diethyl-benzene 36.35 0.61 25 1-methyl-2-propyl-benzene 36.64 1.85 26 1-ethyl-2,5-dimethyl-benzene 37.20 1.64 27 1-ethyl-2,3-dimethyl-benzene 37.29 2.15 28 1-ethyl-2,4-dimethyl-benzene 37.38 0.17 29 1-ethyl-3-isopropyl-benzene 37.62 1.66 30 1-methyl indane 37.67 0.30 31 1-ethyl-2-isopropyl-benzene 37.96 0.22 32 5-methyl indane 38.21 0.03 33 1-butyl-4-methyl-benzene 38.47 0.22 34 1-ethyl-2,6-dimethyl-benzene 38.63 0.51 35 1-ethyl-3,5-dimethyl-benzene 38.72 1.09 36 1,4-diethyl-2-methyl-benzene 38.91 0.21 37 1,2,4,5-tetramethyl-benzene 39.22 0.90 38 1-butyl-3-methyl-benzene 39.28 0.10 39 1,2,3,5-tetramethyl-benzene 39.44 1.13 40 1-butyl-2-methyl-benzene 39.53 0.06 41 1,1-dimethyl-indane 39.82 0.07 42 1,3-dimethyl-4-isopropyl-benzene 40.01 0.05 43 1-ethyl-2,4,5-trimethyl-benzene 40.25 0.09 44 1,3-dimethyl-5-isopropyl-benzene 40.32 0.46 45 1,6-dimethyl indane 40.39 0.37 46 1-methyl-4-(1-methyl-propyl)-benzene 40.66 0.57 47 terbutyl-benzene 40.74 1.19 48 1,5-dimethyl indane 40.97 0.52 49 1,2,3,4-tetramethyl-benzene 41.09 2.33 50 1,3-diethyl-2-methyl-benzene 41.33 0.82 51 1-methyl-4-(2-methyl-propyl)-benzene 41.51 1.06 52 1,3-diethyl-4-methyl-benzene 41.61 0.49 53 1-methyl-3-(1-methyl-propyl)-benzene 41.74 0.99 54 1-methyl-3-(2-methyl-propyl)-benzene 41.83 0.88 55 1,4-diethyl-2-methyl-benzene 41.92 0.52 56 1,3-diethyl-4-methyl-benzene 42.12 0.06 57 1-methyl-2-(1-methyl-propyl)-benzene 42.20 0.55 58 4,7-dimethyl-indane 42.53 0.33 59 1-ethyl-2,3,5-trimethyl-benzene 42.77 0.60 60 dimethyl-indane 42.86 0.53 61 1-methyl-(1-methyl-propyl)-benzene 43.03 0.83 62 dimethyl-indane 43.09 0.15 63 dimethyl-indane 43.20 0.31 64 C5-benzene 43.28 0.30 65 1,4-dimethyl-3-(2-methyl-propyl)-benzene 43.39 0.50 66 1,1,4-trimethyl-indane 43.56 0.30 67 1,3-dimethyl-5-(2-methyl-propyl)-benzene 43.67 0.09 68 1-ethyl-2,3,6-trimethyl-benzene 43.84 0.44 69 1,1,5-trimethyl-indane 44.00 0.35 70 1-ethyl-4-(2-methyl-propyl)-benzene 44.05 0.08 71 trimethyl-indane 44.18 0.11 72 ethyl-(1-methyl-propyl)-benzene 44.26 0.61 73 1,2-diethyl-4,5-dimethyl-benzene 44.57 0.80 74 cyclopentyl-benzene 44.67 0.19 75 trimethyl-indane 44.80 0.16 76 trimethyl-propyl-benzene 44.92 0.03 77 C5-benzene 44.99 0.05 78 pentamethyl-benzene 45.06 0.67 79 2-ethyl-indane 45.14 0.46 80 trimethyl-propyl-benzene 45.26 0.43 81 1,8-dimethyl-tetraline 45.30 0.18 82 trimethyl-propyl-benzene 45.42 0.53 83 1,2,4-triethyl-benzene 45.51 0.59 84 1-ethyl-tetraline 45.74 0.54 85 trimethyl-indane 45.83 0.12 86 trimethyl-propyl-benzene 45.95 0.26 87 trimethyl-propyl-benzene 46.08 0.15 88 trimethyl-propyl-benzene 46.18 0.60 89 trimethyl-propyl-benzene 46.30 0.04 90 trimethyl-indane 46.36 0.03 91 trimethyl-indane 46.40 0.35 92 trimethyl-indane 46.49 0.82 93 C6-benzene 46.53 0.35 94 C6-benzene 46.67 0.16 95 hexamethylbenzene 46.81 0.46 96 dimethyl-tetraline 47.00 0.72 97 dimethyl-tetraline 47.19 0.64 98 dimethyl-tetraline 47.28 0.51 99 C6-benzene 47.49 0.26 100 C6-benzene 47.69 0.21 101 C6-benzene 47.77 0.66 102 C6-benzene 47.86 0.15 103 dimethyl-tetraline 47.92 0.64 104 trimethyl-indane 48.08 0.22 105 trimethyl-indane 48.22 0.60 106 C6-benzene 48.38 0.12 107 trimethyl-indane 48.52 0.19 108 trimethyl-indane 48.62 0.18 109 trimethyl-indane 48.74 0.17 110 trimethyl-indane 48.84 0.09
111 C6-benzene 48.98 0.97 112 ethyl-tetraline 49.04 0.23 113 dimethyl-tetraline 49.18 0.42 114 dimethyl-tetraline 49.35 0.37 115 dimethyl-tetraline 49.48 0.34 116 C6-benzene 49.63 0.31 117 trimethyl-tetraline 49.69 0.14 118 trimethyl-tetraline 49.90 0.70 119 trimethyl-tetraline 50.02 0.13 120 C6-benzene 50.10 0.27 121 trimethyl-tetraline 50.20 0.28 122 trimethyl-tetraline 50.40 0.27 123 trimethyl-tetraline 50.44 0.17 125 C6-benzene 50.56 0.30 126 trimethyl-tetraline 50.69 0.67 127 C7-benzene 50.84 0.10 128 C7-benzene 51.09 0.52 129 trimethyl-tetraline 51.26 0.18 130 trimethyl-tetraline 51.45 0.35 131 trimethyl-tetraline 51.60 0.22 132 trimethyl-tetraline 51.73 0.24 133 trimethyl-tetraline 51.88 0.08 134 trimethyl-tetraline 51.94 0.05 135 trimethyl-tetraline 52.01 0.11 136 trimethyl-tetraline 52.18 0.44 137 trimethyl-tetraline 52.44 0.28 138 trimethyl-tetraline 52.55 0.13 TABLE A2
Diaromatic and aro-S sub-fraction
Index Compound RT (min) Wt%*
1 naphthalene 42.55 0.58 2 2-methyl naphthalene 47.82 1.31 3 1-methyl naphthalene 48.59 1.23 4 2,5-dimethyl-benzothiophene 51.97 0.05 5 2-ethyl-naphthalene 52.21 0.20 6 1-ethyl-naphthalene 52.37 0.10
7 2,6- & 2,7-dimethyl naphthalene 52.68 0.39
8 2,7-dimethyl-benzothiophene 53.02 0.09
9 1,3-dimethyl naphthalene 53.30 0.35
10 1,6-dimethyl naphthalene 53.44 0.26
11 2-ethyl-benzothiophene 53.64 0.13
12 1,4- & 2,3-dimethyl naphthalene 54.13 0.06
13 1,5-dimethyl naphthalene 54.27 0.06 14 1,2-dimethyl naphthalene 54.77 0.03 15 propyl-naphthalene 56.13 0.01 16 isopropyl-naphthalene 56.51 0.01 17 isopropyl-naphthalene 56.82 0.01 18 trimethyl naphthalene 57.02 0.01 19 trimethyl naphthalene 57.50 0.01
* Wt%: weight abundance in the 250- aromatic fraction. Proportions were calculated by GC-FID. Integration was carried out using peak area values in comparison to internal standard with relative response factors correction.