HAL Id: hal-02435169
https://hal-cnrs.archives-ouvertes.fr/hal-02435169
Submitted on 10 Jan 2020HAL is a multi-disciplinary open access
archive for the deposit and dissemination of sci-entific research documents, whether they are pub-lished or not. The documents may come from teaching and research institutions in France or abroad, or from public or private research centers.
L’archive ouverte pluridisciplinaire HAL, est destinée au dépôt et à la diffusion de documents scientifiques de niveau recherche, publiés ou non, émanant des établissements d’enseignement et de recherche français ou étrangers, des laboratoires publics ou privés.
Distinguish Paleo-from Present-Day Permeable Fracture
Zones? Joint Interpretation of SWIR Spectroscopy and
Geophysical Logs in the Geothermal Wells of Northern
Alsace
Carole Glaas, Jeanne Vidal, Patricia Patrier, Jean-François Girard, Daniel
Beaufort, Sabine Petit, Albert Genter
To cite this version:
Carole Glaas, Jeanne Vidal, Patricia Patrier, Jean-François Girard, Daniel Beaufort, et al.. How Do Secondary Minerals in Granite Help Distinguish Paleo-from Present-Day Permeable Fracture Zones? Joint Interpretation of SWIR Spectroscopy and Geophysical Logs in the Geothermal Wells of Northern Alsace. Geofluids, Wiley, 2019, 2019, �10.1155/2019/8231816�. �hal-02435169�
Research Article
How Do Secondary Minerals in Granite Help Distinguish
Paleo- from Present-Day Permeable Fracture Zones? Joint
Interpretation of SWIR Spectroscopy and Geophysical Logs in
the Geothermal Wells of Northern Alsace
Carole Glaas ,
1,2,3Jeanne Vidal ,
2,4Patricia Patrier,
3Jean-François Girard,
1Daniel Beaufort,
3Sabine Petit,
3and Albert Genter
21UMR 7516 IPGS, University of Strasbourg, CNRS, 5 Rue René Descartes, 67084 Strasbourg Cedex, France 2ES-Géothermie, Bat Le Belem 5 Rue de Lisbonne, 67300 Schiltigheim, France
3UMR 7285 IC2MP, HydrASA, University of Poitiers, CNRS, Bat B8 Rue Albert Turpain, TSA51106, F-86073 Poitiers Cedex 9, France 4FCFM, Department of Geology, Andean Geothermal Center of Excellence (CEGA), University of Chile, Plaza Ercilla 803,
Santiago, Chile
Correspondence should be addressed to Carole Glaas; carole.glaas@es.fr
Received 17 May 2019; Revised 11 September 2019; Accepted 24 September 2019; Published 11 December 2019 Guest Editor: Tanguy Robert
Copyright © 2019 Carole Glaas et al. This is an open access article distributed under the Creative Commons Attribution License, which permits unrestricted use, distribution, and reproduction in any medium, provided the original work is properly cited. The investigation of permeable hydrothermally altered and fractured zones and their distribution is a key issue for the understanding of fluid circulation in granitic rocks, on which the success of geothermal projects relies. Based on the use of short-wave infrared (SWIR) spectroscopy applied to rock cuttings coupled with interpretation of geophysical logs, we propose an investigation of the clay signature of fault and fracture zones (FZ) inside the granitic basement. This methodology was applied to two geothermal wells: GRT-2 from the Rittershoffen and GPK-1 from the Soultz-sous-Forêts (Soultz) geothermal sites, both located in the Upper Rhine Graben (URG). A total of 1430 SWIR spectra were acquired and analysed. Variations in the 2200 nm absorption band area are correlated with hydrothermal alteration grades. The 2200 nm absorption band area is found to reflect the illite quantity and its variations in the granitic basement. Low, stable values are observed in the unaltered granite facies, showing good reproducibility of the method, whereas scattered high values are associated with high hydrothermal alteration and FZs. Variations in the 2200 nm absorption band area were correlated with the gamma ray and electrical resistivity logs. This procedure allowed us to confirm that illite mainly controls the resistivity response except inside the permeable FZs, where the resistivity response is controlled by the geothermal brine. Thus, the architecture of these permeable FZs was described precisely by using a combination of the 2200 nm absorption band area data and the electrical resistivity log. Moreover, by correlation with other geophysical logs (temperature (T), porosity, and density), paleo-permeable and currently permeable FZs
inside the reservoir were distinguished. The correlation of SWIR spectroscopy with electrical resistivity logs appears to be a robust tool for geothermal exploration in granitic reservoirs in the URG.
1. Introduction
The mid-Carboniferous granitic basement of the Upper Rhine Graben (URG) has been affected by several extensional and compressional tectonic phases that developed a multi-scale fracture network during the Tertiary [1, 2]. Today, the network hosts hydrothermal circulations and acts as the
main pathway through which the natural brine sustains wide convection cells [3–5]. More than 30 years of geothermal research in the pilot geothermal project of Soultz-sous-Forêts (Soultz) (Alsace, France) led to a 3D knowledge of those multiscale fault and fracture networks [6, 7]. Fault and fracture networks will be designated by the general term “FZ” in this paper. Their internal complexity in terms of
architecture and associated permeability is a key question that must be answered when granitic rocks are used as hydro-geological reservoirs, for nuclear waste disposal, or as deep geothermal systems (Figure 1) [4, 8–12]. In the URG, the current targets for geothermal projects are hydrothermal fractured reservoirs in granitic rocks lying under a thick sed-imentary cover [13]. Benefitting from lessons learned during the Soultz project and gained on several deep geothermal wells in Northern Alsace, we decided to avoid drilling subver-tical wells in nearly versubver-tical fracture systems to maximize the intersection of permeable FZs. Accordingly, a new drilling approach consisting of targeting deviated well trajectories crosscutting highly dipped FZs in the granitic basement was developed. However, these FZs can act either as permeable conduits and as paleo-permeable barriers for natural fluid transport (Figure 1). Therefore, due to primary mineral dissolution and/or secondary mineral precipitation related to fluid-rock interaction, the resulting permeability of FZs can increase or even decrease, increasing the challenge of obtaining successful geothermal wells [14–18].
This paper aims to develop a method to both characterize the hydrothermal alteration and evaluate the degree of
per-meability of the granitic reservoir intersected by geothermal wells in the context of the URG. Hydrothermal alteration of the buried granitic basement in the URG wells is systemati-cally expressed by an illitization process [6, 7, 13, 19, 20]. Routinely used for the mining industry, short-wave infrared (SWIR) spectroscopy is an innovative method for geothermal systems [21]. Here, SWIR spectroscopy was used to detect illitic minerals (illite and illite-rich illite/smectite mixed layers) in the studied geothermal wells. However, the use of SWIR spectroscopy alone does not permit differentiation of whether this high illitization is the clay signature of perme-able FZs contributing to the well’s productivity or injectivity, or a signature of paleo-permeable FZs that are now sealed by secondary minerals. To distinguish paleo-permeable from currently permeable FZs, we propose an innovative method based on the correlation between SWIR signature, geophysi-cal logs (T, gases, porosity, density, gamma ray, and electrical resistivity), and cuttings observations.
After describing the SWIR method and the several geophysical logs used in this study, the SWIR results will be presented for two geothermal wells drilled in Rittershoffen (GRT-2) and Soultz (GPK-1), respectively, and the specific
decametric metric
Drusy quartz vein Geothermal brine
Illite Hydrothermally altered granite Unaltered granite Paleopermeable illitized zone Present-day permeable illitized zone (porous) Paleopermeable quartz vein (fully sealed) Present-day permeable quartz vein (channeling) a b c
Figure 1: Complexity of a FZ after Caine et al. [71]. We can differentiate three zones: (a) the fault core, which can be a pathway for fluid if illite
and quartz veins are not totally sealing the zone, (b) the damage zone, which can be sealed or opened with fractures that are acting asfluid
signatures and architectures of the FZs will be detailed. In the next step, the geophysical logs and SWIR results will be cor-related and used to differentiate paleo- and present-day per-meable zones. Finally, we will discuss the applicability of the SWIR method and its implications for the understanding of the mineralogy and the distribution of illitization at the well scale.
2. Geological Setting
2.1. Soultz and Rittershoffen Sites. In 2019, two deep geother-mal plants exploiting deep fractured granite are operating in France. These plants produce a total of 24 MWth for indus-trial use at Rittershoffen and 1.7 MWe for the electrical grid at Soultz. Both sites are located in the URG approximately 40 km north of Strasbourg and target the hydrothermally altered granitic basement as a geothermal reservoir (Figure 2(a)).
The Soultz GPK-1 well was drilled vertically from 0 to approximately 2000 m measured depth (MD) in 1987 and was then deepened almost vertically to 3590 m MD in 1992 (Figure 2(b)). It crosses the Cenozoic and Mesozoic sedimen-tary covers before reaching the top of the Paleozoic granitic basement at 1376 m MD. The drilling of this well in 1987 was conducted according to an old geothermal concept, involving the creation of an artificial heat exchanger by
hydraulic stimulation created by vertical wells [22–25]. The well was hydraulically stimulated several times to enhance the connection between the well and the reservoir [26, 27]. The FZs in the granitic basement are mainly oriented N160-170°E and subvertical, and most of them dip more steeply than 65°eastward or westward [14]. On drilling, nat-ural very saline brines were encountered in fractured and altered zones bearing secondary minerals of hydrothermal origin [28]. Five main permeable FZs ranging from 20 to 40 m in apparent thickness are intersected at 1645, 1814, 2000, 2818, and 3495 m MD. In 2004, the Soultz site was composed offive deep wells that in fact revealed numerous permeable FZs [28].
The Rittershoffen project was initiated in 2008, and its target was the Rittershoffen normal fault, which is crossed by two deep wells, GRT-1 and GRT-2. The production well GRT-2 was drilled subvertically from 0 to 2480 m MD cross-ing the sedimentary cover to the top basement and was highly deviated (40°to the north) down to 3196 m MD cross-ing the granitic basement (Figure 2(b)). The target was to crosscut the main local fault as long as possible. This normal fault, which is located approximately 15 km east of the west-ern Rhenish border fault, is oriented N5°E based on subsur-face geological data [29, 30]. The GRT-2 well is therefore slightly deviated but tangent to the local fault over its approx-imately 400 m apparent length (Figure 2(b)). The GRT-2 well
85 ° 8 0° 75° 70° 65° GRT-2 GPK-1 Rittershoffen SsF S o u thz fa ul t Ri tt er sho ff en fa ul t N 1 km Western R henish fa ult A B Kutzenha usen fa ult FRANCE GERMANY SWITZERLAND (a) 0 2 3 1 A B GPK-1 GRT-2 SsF Rittershoffen NW SE
Cenozoic and Jurassic sediments Triassic and Permian sediments Hercynian basement Faults Geothermal wells Interpreted faults km (b)
Figure 2: (a) Structural map of the top of the granitic basement from the GeOrg geoportal with the well trajectories (green), the thermal
anomalies [3], and the Soultz (SsF) and Rittershoffen localizations. (b) Geological cross section through the GPK-1 and GRT-2 wells
crossing the URG sedimentary cover and granitic basement; the well trajectory of the GRT-2 well is a NW-SE projection on the cross section, from the last 3D seismic campaign [72].
revealed a high productivity index of 4 L/s/bar without any stimulation; thus, a hydrothermal concept could be imple-mented [13, 31]. Achieved in 2016, this Rittershoffen project proved to be a great success, with an operational plant pro-ducing a flow rate of 70 L/s at surface T of 168°C [32]. In the granitic section of the open hole of the GRT-2 well, four main permeable FZs ranging from 15 to 40 m in apparent thickness were intersected at 2533, 2770, 2950, and 3052 m MD [31, 33, 34].
Observations conducted on continuous and high-quality coring of the EPS-1 well from Soultz highlighted a multiscale fracture network [35]. Small-scale fractures with no evidence of displacement are filled with carbon-ates, chlorite, iron oxides, epidote, and sulphides, and faults visible at the core scale are filled with drusy quartz (euhedral quartz crystals as coatings on or infillings in fractures), carbonates, barite, and clay minerals. In the case of the Rittershoffen wells, for which no core was available, only the largest faults could be identified (small-scale fractures were hardly identified) because only cuttings and acoustic image logs were available.
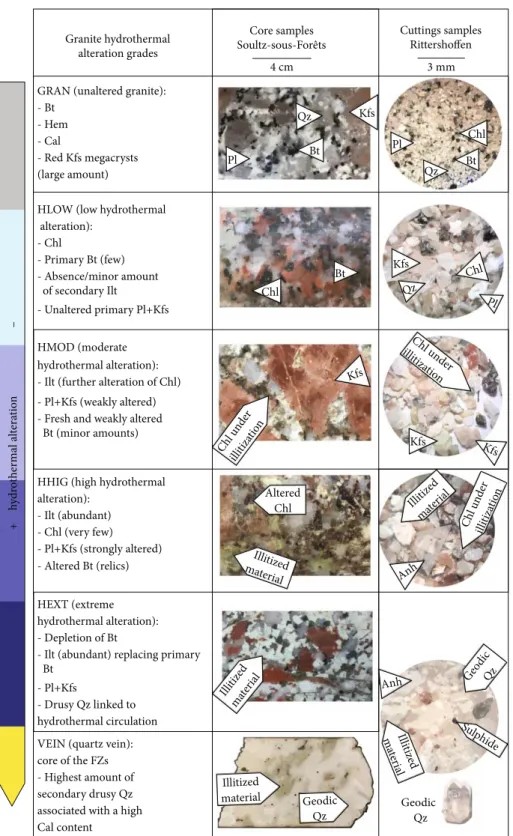
2.2. Alterations of the Granitic Basement. During the cooling of the crystalline pluton, the granite underwent a pervasive alteration that presents the petrographic and mineralogical features of the propylitic facies. Today, it exhibits several grades of hydrothermal alteration that are also related tofluid circulation [36, 37]. The unaltered crystalline granitic base-ment at Rittershoffen and Soultz is composed of primary muscovite, biotite, K-feldspar, plagioclase, and quartz [37, 38]. This primary mineralogy is affected by hydrother-mal alteration, and specific mineralogical associations reflect the various alteration grades encountered. According to pre-vious studies of the Soultz geothermal wells, the hydrother-mal alteration grades in the granite are well known from core observations [16, 17, 37, 39–41]. In this study, the core mineralogy and hydrothermal alteration grades were crossre-ferenced with the minerals observed in the cuttings using a binocular magnifier, although the texture information and the mineral assemblage were not reflected in the cuttings (Figure 3). The mineralogy of the cuttings was determined through a semiquantitative approach using a three-class scale [18, 33]. The hydrothermal alteration grades—low (HLOW), moderate (HMOD), high (HHIG), and extreme (HEXT)—are described in Figure 3 [42–46]. The granitic facies identified in the cuttings include two types of gran-ite, “unaltered” granite (GRAN), affected by a propylitic alteration related to the cooling of the pluton [14, 47], and the presence of locally reddish granite (RED), contain-ing a large number of red K-feldspar megacrysts that have been oxidized through intense exposure to weathering fluids. The presence of illite in the granitic basement as a major signature of hydrothermal alteration was con-firmed by complementary laboratory analyses. In previous studies of the GRT-2 well, X-ray diffraction (XRD) was performed on the <5 μm fraction of selected cuttings; in this way, three groups of illitic minerals (well-crystallized illite, poorly crystallized illite, and illite-rich illite/smectite mixed layers) were identified [18]. The chemical
composi-tions of the clay minerals were obtained using a scanning electron microscope (SEM) coupled with energy-dispersive X-ray spectroscopy (EDS). This study showed that perme-able FZs were associated with the occurrence of poorly crystallized illite and illite/smectite mixed layers that crystallized during hydrothermal circulation [18]. XRD measurements of the GPK-1 well’s cuttings were also per-formed in this study; the results showed the presence of illite in fractured and altered zones as well as the presence of chlorite and biotite in HLOW and GRAN.
3. Materials and Methods
3.1. SWIR Spectroscopy Method
3.1.1. Materials. The cuttings (chip samples) collected during the drilling of the wells were first washed using sieves and then dried on-site in an oven at 80°C for 40 minutes, by the mud logger unit. In the case of the GRT-2 well, the cuttings were sampled every 3 m in depth in the studied 8 1/2″ drilled section. Thus, one bag of cuttings represents approximately 0.1 m3of rock. For the GPK-1 well, the cuttings were sampled every 1 m in depth; thus in the 9 5/8″ drilled section from 1400 to 2850 m MD, one bag of cuttings represents approxi-mately 0.04 m3of rock, and in the 7 5/8″ drilled section from 2850 to 3590 m MD, one bag of cuttings represents approxi-mately 0.025 m3of rock. The sampling included in this study encompasses all the facies described in the foregoing section (Figure 3). The average grain size of the cuttings chips in each sample varies between 0.5 and 2 mm. The chip size can be highly influenced by drilling tool wear. For this reason and because the chip size of the cuttings influences the SWIR intensity (the higher the chip size, the higher the SWIR inten-sity), the changes of drilling tool are also presented in this work.
3.1.2. Measurement Conditions. The SWIR spectral domain extends from 1000 to 2500 nm. If the wavelength of the infra-red radiation is close to the vibrational energy of the eigen-mode of the molecule, it causes vibration of some bonds and the infrared radiation energy is absorbed. This is con-veyed by absorption bands on the infrared spectrum acquired at the corresponding wavelength in the midinfrared (MIR) domain. In the SWIR domain, we can observe the harmonics and the combinations of these absorption bands [48]. In total, 240 cuttings samples from the GRT-2 well and 1190 cuttings samples from the GPK-1 well were analysed. The SWIR measurements were performed at the same time for each well; thus, the acquisition conditions (hygrometry of the room, ambient temperature) are homogeneous for each well. Because very few expandable clay minerals are present in the granite, even when it has been hydrothermally altered, the SWIR data are not very sensitive to the hygrometry parameter. This is confirmed by the reproducibility of the low values of the 2200 nm absorption band area in the unal-tered granite for all the geothermal wells studied in the URG. The spectrometer used is a TerraSpec 4 Standard Res Mineral Analyzer created by Analytical Spectral Devices, Inc. (Mal-vern PANalytical company) equipped with two SWIR
detectors. The spectral domain from 350 to 2500 nm is cov-ered at a spectral resolution of 3 nm from 350 to 1000 nm and at a spectral resolution of 10 nm from 1000 to 2100 nm. The scanning time of 100 milliseconds made it possible to
conduct the measurements rapidly for all granitic sections. The wavelength reproducibility is 0.1 nm with an accuracy of 0.5 nm. The reproducibility of the measurement was tested by measuring the same samplefive times; this resulted in a
HMOD (moderate hydrothermal alteration): - Ilt (further alteration of Chl) - Pl+Kfs (weakly altered) - Fresh and weakly altered Bt (minor amounts)
HEXT (extreme hydrothermal alteration): - Depletion of Bt
- Ilt (abundant) replacing primary Bt
- Pl+Kfs
- Drusy Qz linked to hydrothermal circulation VEIN (quartz vein): core of the FZs - Highest amount of secondary drusy Qz associated with a high Cal content Core samples Soultz-sous-Forêts 4 cm Granite hydrothermal alteration grades
HHIG (high hydrothermal alteration):
- Ilt (abundant) - Chl (very few) - Pl+Kfs (strongly altered) - Altered Bt (relics) GRAN (unaltered granite): - Bt - Hem - Cal - Red Kfs megacrysts (large amount) Geodic Qz Cuttings samples Rittershoffen 3 mm
HLOW (low hydrothermal alteration): - Chl - Primary Bt (few) - Absence/minor amount of secondary Ilt - Unaltered primary Pl+Kfs Pl Kfs Chl under illitiza tion
Chl under illitiza tion Illitized ma teria l Sulphide Anh Illi tized ma ter ial Geodic Qz Chl Bt Qz Pl Kfs Illitized material Bt Qz Bt Illitized material Geo dic Qz Illitized mater ial Anh Chl under illi tiza tio n Kfs Kfs Qz Pl Chl Kfs + h ydr o ther m al al tera tio n – Chl Chl Altered
Figure 3: Examples of mineralogical assemblages of the granitic basement observed in cores (middle) and in cuttings (right); these
assemblages define the different hydrothermal alteration grades (left). GRAN: unaltered granite; HLOW: low hydrothermal alteration;
HMOD: moderate hydrothermal alteration; HHIG: high hydrothermal alteration; HEXT: extreme hydrothermal alteration; VEIN: secondary drusy quartz vein; Anh: anhydrite; Bt: biotite; Cal: calcite; Chl: chlorite; Hem: hematite; Ilt: illite; Kfs: potassic feldspars; Pl: plagioclase; Qz: quartz.
variation of 1% for the 2200 nm absorption band area, by performingfive measurements without moving the sample and five measurements after mixing the sample (personal communication). Before measurements are taken, the ASD TerraSpec requires a warm-up period of approximately 30 minutes. It is also necessary to conduct a calibration with the “Spectralon” reference material provided with the machine before thefirst measurement and thereafter regu-larly every hour during the measurement period [49]. 3.1.3. Processing. After the measurement, the SWIR spectra were processed with “the Spectral Swagger” (TSS), an in-house Visual Basic Macro developed at Poitiers University that runs on Microsoft Excel [49]. First, the baseline was removed automatically by the software; then, spectra were fitted with few Gaussian curves (four and two for the water and the 2200 nm absorption band areas, respec-tively). To create a profile simulation, the user must set the position and the half width at half maximum (HWHM). The height parameter is automatically deduced from the baseline-removed spectrum; its initial height equals 90% of the y-axis value of the baseline-removed spectrum at the Gaussian centre wavelength. The user can designate the parameter that will be allowed to change. Thefinal simulated profile is the sum of all Gauss-ian curves. The quality of the fit between the simulated
and observed profile is verified against the weighted profile R-factor (Rwp), which is commonly used in Rietveld refinements [50]. In this study, six Gaussian curves were used to fit the spectrum from 1820 to 2300 nm (Figure 4). For the GRT-2 well, position and HWHM were locked for each simulation profile. However, different sets of position and HWHM were used. Simulation profiles with an Rwp lower than 0.05 were accepted. For the GPK-1 well, for which a very large number of profiles (1190) were calculated, position and HWMH were free-fitted by TSS for each simulation profile. The areas of the water absorption band and the 2200 nm absorption band were also fitted manually for some profiles to deter-mine whether there was a significant deviation in the area with respect to the free fitting. The results showed that there was no significant change in the area between pro-files fitted manually and those free-fitted by TSS (see Figure S3 in the supplementary materials). Thus, the results presented in this study for the GPK-1 well are profiles that were free-fitted by TSS.
3.1.4. Mineralogical Identification. In the SWIR spectral domain, the phyllosilicates are detected, and they are not influenced by feldspars and quartz, which do not present absorption bands in this domain. Four Gaussian curves were used to fit the absorption band spanning the
H2O Al2 OH Mg 2 Fe O H Observed profile Simulated profile Fitted Gaussian curve
Wavelength (nm) Acquisition spectra (GRT-2) A b so rba n ce 0 0,05 0,1 0,15 0,2 1810 1910 2010 2110 2210 2310 Legend (a) Bt Chl Ilt 1800 1900 2000 2100 2200 2300 2400 2500 Wavelength (nm) Literature spectra Ms A b so rba n ce (b)
Figure 4: (a) Example of an absorption spectrum and a simulated profile in the GRT-2 well at 2800 m. (b) Reference spectra from Pontual et al. [52] for biotite (Bt), muscovite (Ms), chlorite (Chl), and illite (Ilt).
wavelength range from 1900 to 2060 nm (Figure 4); this range corresponds to the stretching and bending vibrations of H2O molecules. This absorption band exists not only for
the hydrated phyllosilicates but also for some other hydrated minerals such as zeolites, opal, and amorphous silica. This absorption band can also vary according to the humidity of the environment. Hence, not only it is linked to clay minerals but also, under constant humidity conditions, the area of this absorption band will vary according to the quantity of clay minerals present in the sample. This aspect will be discussed in Section 5.2. Two Gaussian curves were used to fit the absorption band spanning the wavelength range from 2200 to 2255 nm, which mainly corresponds to the vibrations of the bonds between the cations of the octahedral sheets and the structural OH groups in the aluminous phyllosilicates, i.e., corresponding to the combination modes of the stretching and bending vibrations of the Al2OH groups [51]. Thus, the 2200 nm absorption band represents Al-rich dioctahedral clay minerals [52]. The shoulder observed between 2247 and 2253 nm is more complex in terms of absorption band and mainly reflects the occurrence of biotite and chlorite trioctahe-dral clay minerals as well as of muscovite (Figure 4(a)). The Gaussian curves used to fit the spectrum from 2300 to 2400 nm are not presented in this study because we are focus-ing on the relative quantification of illitic minerals associated with the“Al2OH” absorption band. In our study, the mineral-ogy of the granitic basement in the wells is thoroughly described by binocular magnifier observation of 240 cuttings from the GRT-2 well [33] and 1190 cuttings from the GPK-1 well [37, 53]. Thus, the variation in the relative integrated intensity of the 2200 nm absorption band is considered to rep-resent illite variations, except in the GRT-2 well from 2950 to 3200 m MD, where significant amounts of biotite were observed, and in the GPK-1 well, in which biotite is present in the unaltered granite. Based on a comparison with spectra reported in the literature (Figure 4(b)), the influence of chlo-rite on the 2200 nm absorption band area is not significant, but the influence of biotite and muscovite could be signifi-cant if these minerals were present in high amounts in the studied samples. Beyond the mineralogical signature of the absorption bands, this methodology was used for a broad quantification of clay minerals based on the Beer-Lambert law, which establishes proportionality between the absorbed energy and the concentration of chemical bonds in the ana-lysed material [54]. In this study, the area of the 2200 nm absorption band is expressed in arbitrary units (a.u.) which represents the area of the absorption band considered. 3.1.5. Intrasample Variability. Because each cuttings bag con-tains sections of the drilled rocks (see Section 3.1.1) and because the cuttings could not be homogeneously mixed in the bag, several measurements were performed on each cut-tings bag (see Figures S1 and S2 in the supplementary materials). In the GRT-2 well, 10 measurements were performed on the same cuttings bag, whereas only 5 measurements were performed in the GPK-1 well due to the lower amount of cuttings available. Error bars were calculated for each cuttings bag to determine whether the range of variation exceeds the scattering of the data.
Because the results were found to be reliable, they are not presented in this study; however,figures showing the results are provided as supplementary materials.
3.2. X-Ray Diffraction. X-ray diffraction data were acquired from selected cuttings samples of the GPK-1 well and used to identify the clay minerals present in the samples. The XRD results of Vidal et al. [18] for the GRT-2 well were also used in this study. Twenty-eight cuttings samples were col-lected from the GPK-1 well. The sampling was concentrated in the permeable and altered FZs as well as in the unaltered granite that was used as a reference material, as the latter is believed to be representative of rocks preserved from actual fluid circulation. The samples were not ground; they were dispersed in distilled water by ultrasonic vibration. Oriented powders on glass slides were prepared from a<5 μm clay mineral suspension obtained by sedimentation. Clay minerals were identified by XRD of air-dried and ethylene glycol-saturated oriented powders conducted on a Bruker D8 Advance diffractometer (CuKα radiation, 40 kV, 40 mA). The analytical conditions were as follows: angular domain, 2.5-30°2θ; step increment, 0.025 2θ; and counting time per step, 1 s. XRD data acquisition and treatment were conducted using the X’Pert HighScore software (PANalytical B.V.). The clay minerals were identified according to the lit-erature [55].
3.3. Geophysical Logs. The geophysical logs and mud logging data are presented in this study to highlight their correlations with evidence of present-day circulation (T log, He, CO2, CH4, and Rn), FZ evidence (neutron porosity, density, and resistivity), and evidence of the presence of paleo-circulation zones rich in illite (total gamma ray, spectral potassium gamma ray (GR-K), and electrical resistivity). 3.3.1. Temperature. TheT log is expressed in°C. Measure-ments were made every 50 cm and 10 cm in the GRT-2 and GPK-1 wells, respectively. T anomalies are interpreted as the signatures offluid circulations between the well and the formation [30, 56–58]. For this study, the T log of the GRT-2 well was shifted upwards by 2 m from 2480 to 2650 m MD and upwards by 10 m from 2650 to 3196 m MD because stretching of the cable occurred during the mea-surement as a function of depth. Moreover, because theT log of the GRT-2 well was acquired separately, it could not be correlated in depth with another reference. Thus, in this study, the T log was correlated with the resistivity and porosity logs because they obviously presented the same types of anomalies preceding the four main T anomalies. For similar reasons, the T log of the GPK-1 well was shifted downwards by 7 m to vertically fit the T anomalies and the permeable FZs [30].
3.3.2. Gas Content (He, CO2, and CH4). The occurrence of
alkanes as well as of other gas species such as He, CO2, and
CH4 indicates permeable FZs [59, 60]. For reference, the abundances of He and CH4in the atmosphere are approxi-mately 5.24 ppm and 1.75 ppm, respectively. He, CO2, and CH4were monitored in GPK-1 [59]. Only CH4 was
3.3.3. Porosity. The neutron porosity log (NPHI) which is supposed to quantify the porosity filled with water is deduced from measurements of the hydrogen content of the formation (fast neutrons emitted by the tool are slo-wed down by elastic scattering, mainly due to collision with hydrogen atoms). Neutron porosity can also be highly influenced by clay minerals, which often contain bound water. It is expressed in m3/m3 and sometimes in %. It was sampled at every 15 cm depth in the GRT-2 and GPK-1 wells. The parameter has an investigation depth of several cm behind the borehole wall, which can correspond to the flushed zone. Porosity logs do not directly indicate true porosity in this context, a specific calibration should be performed, and the influence of the granitic matrix on the neutron porosity can be as high as 7% [61]. Nevertheless, the neutron porosity measured here provides a global signal for FZs to the extent that they are porous and contain fluids and/or clay minerals. 3.3.4. Density. The density log (RHOB) is calculated from returning gamma rays following the interaction of gamma rays emitted from a chemical source (Ce137and Co60) with the electrons present in the elements in the formation. These gamma rays are related to the electron density of the for-mation, which itself depends on the formation density. RHOB is given in g/cm and was acquired every 15 cm in depth for both the GRT-2 and the GPK-1 wells. A negative peak in a density curve could be due to the occurrence of secondary clay minerals and high porosity and thus should reveal alterations associated with a frac-ture zone, whereas positive peaks are associated with high-density minerals or changes in lithology.
3.3.5. Gamma Ray. The gamma ray (GR) log measures natu-ral radioactivity (cumulative emissions, mainly from ura-nium (U), potassium (K), and thorium (Th)) in gAPI; vertical sampling of the GRT-2 and GPK-1 wells was per-formed every 15 cm. The GR log is aimed at interpreting lithology and rock composition by detecting clay minerals rich in potassium (illite and muscovite). In the altered crys-talline basement, negative GR peaks in the lower positive domain can reflect drusy quartz veins in illitized host rock [14]. In the context under study, GR data are an indicator of hydrothermal alteration and thus provide information regarding paleo-permeability.
3.3.6. Electrical Resistivity. In unaltered hard rocks, the elec-trical resistivity log is mainly controlled by the elecelec-trical con-ductivity of thefluid contained in the rock porosity, a factor that is particularly significant in FZs. Electrical resistivity decreases with water saturation and is even lower for conduc-tive fluids that contain salts, such as brines. Similarly, the electrical resistivity of clay minerals, which are conductive minerals, is low [62]. Hence, laterologs and focused resistivity arrays are sensitive to fracturation and alteration. Resistivity laterologs measure an apparent electrical resistivity that needs to be corrected for the probe characteristics, the hole effect, and spatial variations in electrical resistivity (dipping). In the zones in which hydrothermally altered granite may
coexist with unaltered granite, electrical resistivity modelling should be applied to obtain the“true” electrical resistivity by taking into account the 2D/3D geometry of the zone [63]. Although petrophysical models are commonly used to evalu-ate hydrocarbon saturation in sedimentary formations [64]; for instance, the estimation of porosity changes from electri-cal resistivity is not so straightforward in fractured granitic environments. The electrical conductivity can vary by several orders of magnitudes in zones and areas with different clay mineral contents and fracture densities, whether or not the zones are sealed. In the GRT-2 well, the electrical resistivity was measured with a five-electrode configuration, yielding five apparent resistivity values (RLA1–5) [65]. The contribu-tion of the matrix to the electrical conductivity is supposed to be far lower than that of fractures, and it can vary by several orders of magnitude among unaltered and altered granite zones [33]. Measurements were obtained every 15 cm in depth. These configurations are sensitive to the distance beyond the borehole wall. The shallowest resistivity (RLA1) mainly reflects the average resistivity of the borehole mud, and the deepest resistivity (RLA5) mainly reflects the average resistivity of the formation (granite matrix). In the GPK-1 well, the electrical resistivity was measured in 1989 using a laterolog tool with a two-electrode configuration every 15 cm in depth, yielding a shallow laterolog (LLS) and a deep laterolog (LLD). In this paper, only the most far-reaching resistivity curves (RLA5 and LLD) are presented on an inverted scale with highly resistive values on the left and con-ductive values on the right, allowing the reader to easily corre-late GR, SWIR, and conductive peaks.
4. Results
4.1. GRT-2 Well
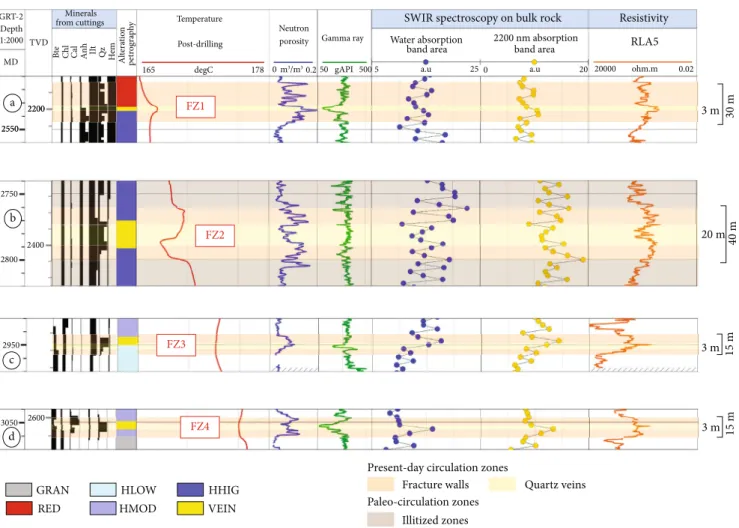
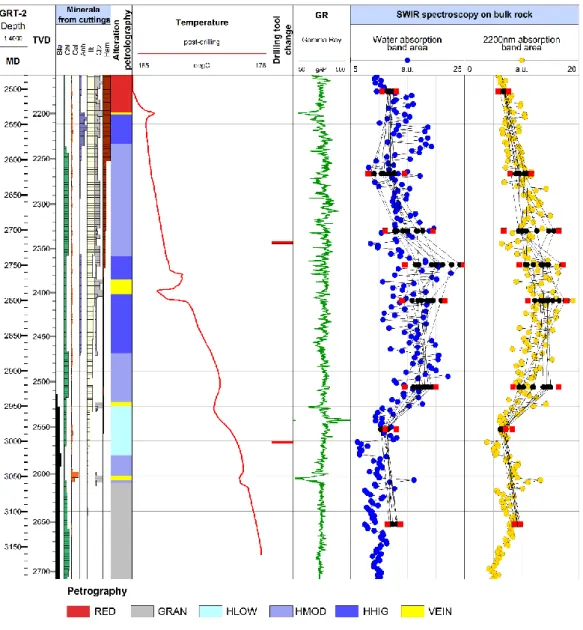
4.1.1. Dataset. The petrographical log of the GRT-2 well (Figure 5) was built from the macroscopic description of the alteration mineralogy in the cuttings. The hydrothermal alteration grades were determined according to the occur-rence of the secondary minerals (chlorite, illite, and drusy quartz) in the cuttings samples. This petrographical log pre-sents three major units: reddish, oxidized granite at the top of the granitic basement, an altered zone from 2535 to 3060 m MD with a highly altered core from 2737 to 2875 m MD, and unaltered granite at the bottom of the well from 3060 to 3196 m MD. These main sections correlate well with the SWIR values; more precisely, we can distinguish four sec-tions in which the variasec-tions in the 2200 nm absorption band area are indicative of the alteration grades around the perme-able FZs.
4.1.2. SWIR Variations and Hydrothermal Alteration Grades. Thefirst section, from 2514 to 2570 m MD around the FZ1, is characterized by a small increase in the SWIR 2200 nm absorption band area, with scattered values between 6 and 10 a.u. It corresponds to the RED and HHIG facies observed with a binocular magnifier.
The second section, from 2570 to 2970 m MD, comprises the FZ2 and the FZ3 and corresponds to the HHIG and
HMOD facies observed with a binocular magnifier. This zone is characterized by the highest values of the 2200 nm absorp-tion band area observed for the well. These values are highly scattered between 10 and 20 a.u., and because the acoustic image logs for GRT-2 are of poor quality, it is difficult to cor-relate the lowest values with opened fractures. The illitization appears to increase with the alteration grade, reaching its highest value (20 a.u.) in the fracture wall (FW) at 2780 m MD. In the FZ2, minimal values of the 2200 nm absorption
band area are observed for a few samples located approxi-mately 2773 m MD. In the acoustic image logs, an opened fracture filled with secondary drusy quartz (VEIN) is observed at 2773 m MD. Below, in the deepest section, acous-tic image logs are not available.
The third section, from 2970 to 3070 m MD, comprises the FZ4. The 2200 nm absorption band area appears to increase with the alteration grade, reaching its highest value (14 a.u.) in the FW at 3055 m MD, associated with a
FZ1 FZ2 FZ3 FZ4 2500 2550 2600 2650 2700 2750 2800 2850 2900 2950 3000 3050 3100 3150 2600 2550 2500 2450 2400 2350 2300 2250 2200 2650 2700 MD TVD Bte Chl Cal An h Il t Qz Hem Al tera tio n p etr ogra p h y Dr illin g t o o l change Minerals GRT-2 Depth 1:4000 from cuttings 165 degC 178 Temperature Post-drilling Density porosity Neutron
SWIR spectroscopy on bulk rock Gamma ray Resistivity RLA5 2200nm absorption band area Water absorption band area a.u 5 25 0 a.u 20 50 gAPI 500 20000 ohm.m 0.02 0 m3/m30.2 1.6 g/cm33.8 GRAN HLOW HMOD HHIG VEIN No data available Permeable zones Legend HEXT
Figure 5: Composite log of the GRT-2 well at Rittershoffen presenting the mineral quantity, petrographical log, T log, porosity and density logs, drilling tool change, total GR, SWIR results with water and the 2200 nm absorption band areas, and resistivity log. Petrographical facies
permeable FZ and a quartz vein at 3050 m MD. This zone corresponds to the HMOD and HLOW facies observed with a binocular magnifier.
The fourth section, from 3070 to 3196 m MD, corre-sponds to the GRAN facies observed with a binocular magni-fier. The values of the 2200 nm absorption band area are stable and low, ranging from 5 to 8 a.u.
The resistivity log also appears to correlate relatively well with the trend of the SWIR log (2200 nm absorption band area). In the open hole of the GRT-2 well, 500 m is altered granite and 200 m is unaltered granite. Thus, altered granite represents 70% of the open-hole section.
4.1.3. Permeable FZs. The four permeable FZs of the GRT-2 well are shown in Figure 6 and are discussed below. (1) FZ1 (2533 m MD). From the ultrasonic borehole images (UBI), no small-scale fracture is observed around the quartz vein for this FZ [34]. The porosity log shows high, scattered values in the entire FZ, the GR log exhibits a low peak corre-lated with the quartz vein, and the resistivity log shows a high conductivity peak that is also correlated with the quartz vein (Figure 6(a)). The thermal anomaly is localized at the quartz vein depth. The SWIR absorption band area at 2200 nm
shows scattered and average values. According to the geo-physical logs, the naturalflow appears to be spatially corre-lated with the occurrence of a quartz vein. The observed conductivity peak in this permeable quartz vein could be due to the presence of geothermal brine, which is a very con-ductivefluid [66].
(2) FZ2 (2770 m MD). The UBI is not available over the entire zone, but open fractures are observed at 2767, 2770, and 2774 m MD and are associated with the occurrence of quartz veins, translating into potential open pathways for fluids. Below these open fractures, smaller sealed fractures are observed from 2786 to 2789 m MD [34]. Whereas the GR is quite stable with some small negative peaks, the porosity, electrical conductivity, and SWIR 2200 nm absorption band area present two positive humps extending vertically over a length of 40 m (Figure 6(b)). This zone is the most contribu-tive according to hydraulic tests [31], but the intra-FZ section reveals a complex architecture. At the centre of the zone, resistive values are observed (from 2776 to 2783 m MD), cor-relating with low neutron porosity, whereas the GR is unaf-fected, which goes along with the presence of the quartz vein observed in the cuttings. More generally, the observa-tions in this FZ are consistent with a permeable FZ and brine
Fracture walls Quartz veins Present-day circulation zones
GRAN HLOW HMOD HHIG VEIN RED Illitized zones Paleo-circulation zones a 2550 2200 b c 2950 d 3 m 30 m 20 m 40 m 3 m 15 m 3 m 15 m FZ1 FZ2 FZ3 FZ4 2800 2400 2750 2550 2200 3050 2600 MD TVD Bte Chl Cal An h II t Qz Hem Al tera ti o n p et rog ra p h y Minerals GRT-2 Depth 1:2000 from cuttings 165 degC Temperature Post-drilling 178 porosity Neutron Gamma ray
SWIR spectroscopy on bulk rock Resistivity RLA5 2200 nm absorption band area Water absorption band area 50 gAPI
m3/m3 5 a.u 250 a.u 20 20000 ohm.m 0.02
0 0.2 500
Figure 6: Magnified view of the four (a, b, c, and d) main permeable FZs of the GRT-2 well at Rittershoffen, presenting the mineral quantity,
petrographical log,T log, porosity and density logs, total GR, SWIR results with water and the 2200 nm absorption band areas, and resistivity
circulations. The lack of UBI data in this zone does not help support our interpretation. However, the fact that the unavailability of UBI data is due to difficulties in running the tool in this zone because of cavings also suggests the exis-tence of an FZ.
(3) FZ3 and FZ4 (2950 and 3052 m MD). No UBI is available for this zone; thus, we are unable to describe the architecture of the FZs. The presence ofT anomalies implies circulation in both FZs. These two FZs look alike. In fact, they present a neutron porosity increase over 10 m, a low GR, and a sharp peak in electrical conductivity correlated with the quartz veins (Figures 6(b) and 6(c)). Two higher resistivity values are observed above and below the FW, surrounding the zone of higher neutron porosity. These peaks appear to be related to the presence of unaltered (or slightly altered) granite, which occurs from 2934 m MD according to the high resis-tive values and also appears to be correlated with the SWIR values, which are stable and low at this depth. The SWIR 2200 nm absorption band area is high in both of these FZs. For both FZs, the sharp increase in electrical conductivity appears to be linked to brine circulation in the quartz veins, whereas the lower conductive values above and below the quartz veins appear to be linked to the occurrence of illite in the FW. The abrupt decrease in electrical conductivity sug-gests a closely delimited hydrothermal circulation zone.
4.2. GPK-1 Well
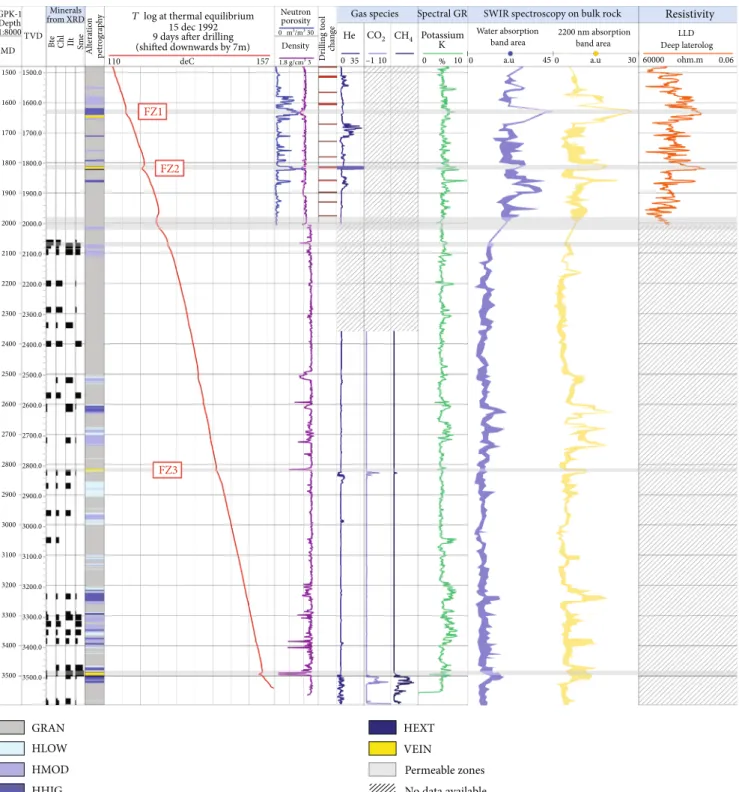
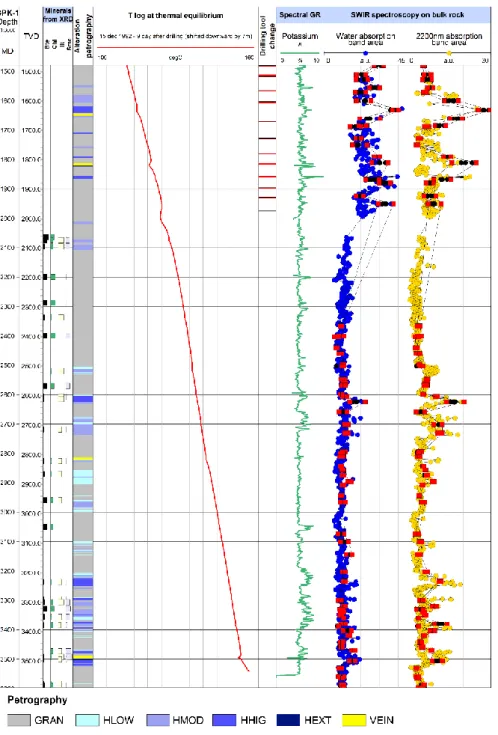
4.2.1. Dataset. The petrographical log of the GPK-1 well was compiled by Genter et al. [42, 43] and Traineau et al. [37] from cuttings samples based on macroscopic observations with a binocular magnifier. The grades of hydrothermal alteration were determined according to the occurrence of the secondary minerals (chlorite, illite, and drusy quartz) in the cuttings samples. This petrographical log presents three major hydrothermally altered granite units surrounded by unaltered granite. These three units extend from 1580 to 1830 m MD, from 2600 to 2800 m MD, and from 3200 to 3500 m MD.
4.2.2. SWIR Variations and Hydrothermal Alteration Grades. Thefirst section, from 1580 to 1830 m MD, is characterized by very scattered high values between 3 and 26 a.u. for the 2200 nm absorption band area. The shift of the SWIR values to high values in this section could be due to a granulometry effect, as this section was drilled first and was then deepened, resulting in a change in the cuttings grain size. Based on bin-ocular magnifier observations, this section corresponds to GRAN with hydrothermally altered zones of HMOD-HHIG facies. These altered zones appear to correlate with the SWIR values, which are higher, i.e., between 8-17 a.u. for the 2200 nm absorption band area for HMOD (1547-1553 m MD, 1579-1606 m MD, and 1650-1656 m MD) and approximately 25 a.u. for HHIG (at 1620-1640 m MD). Quartz veins were identified at 1645 m MD (FZ1) and at 1814 m MD (FZ2), where drusy quartz was visible by obser-vations of cuttings. The latter corresponds to a fracture vein that is visible in core samples (Figure 7).
The second section, from 2605 to 2827 m MD, is charac-terized by high, scattered values between 3 and 19 a.u. for the 2200 nm absorption band area. Based on binocular magnifier observations, it corresponds to GRAN with occurrences of low to high hydrothermal alterations. The HLOW grade appears to correlate with the 2200 nm absorption band area, with values between 5 and 10 a.u. at 2600-2603 m MD, 2610-2612 m MD, 2676-2679 m MD, 2681 m MD, 2693-2701 m MD, and 2731-2733 m MD. Occurrences of HMOD suggest a good correlation with the 2200 nm absorption band area, with values between 7 and 15 a.u. at 2625-2632 m MD, 2679-2681 m MD, 2685-2692 m MD, 2701-2731 m MD, and 2733-2736 m MD. The HHIG occurrences also suggest a good correlation with the stable values of the 2200 nm absorption band area, which range from 14 to 19 a.u. A quartz vein is observed in the cuttings from 2817 to 2818 m MD (FZ3). An open fracture is observed on the FMI log and is characterized by the occurrence of He and CO2 con-tent, evidencing the presence of geothermalfluid.
The third section, from 3203 to 3523 m MD, is character-ized by high, scattered values between 3 and 19 a.u. for the 2200 nm absorption band area. Based on binocular magnifier observations, it corresponds to GRAN with occurrences of hydrothermal alterations of HLOW to HEXT facies. HLOW appears to correlate with values of the 2200 nm absorption band area between 4 and 8 a.u. Two quartz veins are observed in the same fracture zone at 3489 and 3496 m MD in the cut-tings. These open fractures, which match theflow log anom-alies, are observed on the acoustic image logs at 3490 and at 3495 m MD (FZ4).
Outside of these sections, from 2065 to 2605 m MD and from 2827 to 3203 m MD, we observe low, very stable values between 2 and 9 a.u. for the 2200 nm absorption band area. Based on binocular magnifier observations, these correspond to GRAN, with HLOW-HMOD from 2505 to 2530 m MD. These hydrothermal alteration grades suggest a good correla-tion with the 2200 nm absorpcorrela-tion band area which presents higher values of approximately 9 a.u.
In the open-hole section of the GPK-1 well, 500 m is hydrothermally altered granite and 2200 m is unaltered gran-ite; thus, the hydrothermally altered granite represents only 20% of the open hole.
4.2.3. Permeable FZs. The two FZs of the upper section of the GPK-1 well (1540-2000 m MD) are shown in Figure 8 and are discussed below.
(1) FZ1 (1645 m MD). A quartz vein was observed, and aT anomaly above the quartz vein proves a contributive flow zone (Figure 8(a)). The porosity presents high values above and below the quartz vein, whereas low values are observed at the quartz vein depth. The GR-K is also slightly higher above and below the quartz vein, whereas it is low at the quartz vein. Very small He content is also visible above the quartz vein. The laterolog resistivity (LLD) presents high conductivity values above the quartz vein and high resistivity values at the quartz vein depth. He content is also observed in this section, indicating the occurrence of dissolved gas in the geothermalfluid (Figures 7 and 8). The SWIR values are high
in the FZ, particularly above the quartz vein. The hydraulic data show thatflow anomalies are mainly due to the FZ core [67]. However, surprisingly, the quartz vein presents neither a sharp T anomaly nor evidence of fluid circulations from geophysical logs. The geophysical anomalies associated with the FW above the sealed quartz vein could suggest that the FW corresponds to porous granite which allows a good con-nection between the well and the near-wellfield. On the other
hand, the geophysical anomalies of the FW below the quartz vein could indicate that the FW acts as a tight zone possibly caused by secondary mineral precipitations.
(2) FZ2 (1814 m MD). This FZ presents a localizedT anomaly correlated with the quartz vein (Figure 8(b)). According to this T anomaly and considering the section between 1400 and 2000 m, the majority of the fluid flows from this FZ
GRAN HLOW HMOD HHIG VEIN No data available Permeable zones HEXT FZ1 FZ2 FZ3 1500 1600 1700 1800 1900 2000 2100 2200 2300 2400 2500 2600 2700 2800 2900 3000 3100 3200 3300 3400 3500 1500.0 1600.0 1700.0 1800.0 1900.0 2000.0 2100.0 2200.0 2300.0 2400.0 2500.0 2600.0 2700.0 2800.0 2900.0 3000.0 3100.0 3200.0 3300.0 3400.0 3500.0 MD TVD Bte Chl IIt Sme Al tera ti o n p et rog ra p h y Dr illin g t o o l change Minerals GPK-1 Depth 1:8000 from XRD 110 deC
T log at thermal equilibrium 15 dec 1992 9 days after drilling (shifted downwards by 7m)
157 Density porosity
Neutron Gas species Spectral GR SWIR spectroscopy on bulk rock
He CO2 CH4 Potassium K Resistivity LLD Deep laterolog 2200 nm absorption band area Water absorption band area a.u 0 0 10 35 0 –1 % 10 450 a.u 30 60000 ohm.m 0.06 0 m3/m3 30 1.8 g/cm3 3
Figure 7: Composite log of the GPK-1 well at Soultz-sous-Forêts, presenting the mineral quantity, petrographical log, T log, porosity and density logs, drilling tool change, gas species, spectral GR-K, SWIR results with water and 2200 nm absorption band areas, and resistivity
[67, 68]. The porosity is high and shows a sharp peak in its centre that is correlated with the drusy quartz vein. The GR-K presents a low peak at the quartz vein depth and high peaks in the FW above and below the quartz vein. The resis-tivity laterolog presents high electrical conducresis-tivity values, with a sharp very conductive peak at the quartz vein depth, and lower-than-average resistivity values above and below that are correlated with the FWs. The SWIR 2200 nm absorp-tion band area presents higher values in the FZ. As for FZ3 and FZ4 in the GRT-2 well, the sharp and very high conduc-tivity values could be associated with the brine circulating in
the quartz vein since high GR-K and the conductive zone above and below coincide with the high amount of clay min-erals (illite) in the FW. The very high He content matching the quartz vein (>200 ppm) evidences the occurrence of per-meability indicators such as geothermal gases dissolved in the brine.
5. Discussion
5.1. SWIR as a Permeability Indicator. The SWIR method showed good reproducibility of the measurements obtained
b a 6 m 40 m 3 m 20 m GRAN HLOW HMOD HHIG VEIN Legend HEXT
Fracture walls Quartz veins Present-day circulation zones
Illitized zones Paleo-circulation zones FZ2 FZ1 1560 1580 1600 1600.0 1700.0 1800.0 1900.0 1620 1640 1660 1680 1700 1720 1740 1760 1780 1800 1820 1840 1860 1880 1900 1920 1940 1960 1980 MD TVD Al tera ti o n p et rog ra p h y GPK-1 Depth 1:2000 110 degC
T log at thermal equilibrium 15 Dec 1992 9 days after drilling (shifted downwards by 7 m)
126 porosity
Neutron Gas Spectral GR SWIR spectroscopy on bulk rock
He Potassium K Resistivity LLD Deep laterolog 2200nm absorption band area Water absorption band area a.u 0 0 % 10 450 a.u 30 60000 ohm.m 0.06 0 30 0 35
Figure 8: Magnified view of two (a and b) main permeable FZs of the GPK-1 well at Soultz-sous-Forêts, presenting the petrographical log, T log, porosity and density logs, spectral GR-K, SWIR results with water and 2200 nm absorption band areas, and resistivity log. Petrographical
on cuttings samples. Stable and low values appear to be sys-tematically observed in conjunction with the unaltered or slightly hydrothermally altered granite (Figures 5, 7, and 9). The geothermal reservoirs of the Soultz and Rittershoffen geothermal sites are highly fractured, with fracture infillings corresponding to secondary drusy quartz and some carbon-ates, and present hydrothermally altered zones. The hetero-geneity of the hydrothermal facies encountered produces heterogeneity in the SWIR signal that appears on the SWIR log as peaks exceeding the mean values, surely reflecting the presence of mineralizations associated with hydrothermal circulations. Because the primary and sec-ondary mineralogy of the deep granites in the URG base-ment does not vary significantly, the SWIR method is easily applicable to the detection of fluid-rock interaction processes linked to geothermal fluid circulation in the gra-nitic fractured reservoirs of geothermal wells. More gener-ally, the combination of the SWIR 2200 nm absorption band area and the spectral GR-K is a strong illite indicator. On a large scale, the scattering (linked to quartz vein occurrences in the FZs) and the high values of the SWIR 2200 nm absorption band area localize the highly altered zones crossed by the wells. These highly altered zones are linked to the main faults and are interpreted as the perme-able zones of the well (Figures 6 and 8). The vertical extent of this scattering provides in-depth information on the extent of the well volume that is affected by hydrothermal circulations. This initial study applying the SWIR method to the Soultz and Rittershoffen geothermal sites will soon be reinforced by an ongoing study in which the SWIR method is applied to the new Illkirch geothermal site. This will help us confirm our interpretation and extend the interpretation to the URG.
Based only on geophysical logs (acoustic image logs were not acquired below 2850 m MD), the main permeable FZ of GRT-2 was identified from 2766-2800 m MD with a true thickness of 35 m by Vidal et al. [34]. Our SWIR method yields new complementary results that provide new information about the FZ architecture, and we observe that the FZ is more extended than was described by Vidal et al. [34] based on geophysical logs. SWIR helps distinguish the part of the actual FZ that controls the present-day circulations and the part of the FZ that has been affected by paleo-circulations. In fact, this study using SWIR data reveals that this zone presents an intense illitization extending from 2743 to 2884 m MD and thus a true thickness of 112 m. Previous mineralogical studies of the GRT-2 well suggested that a low intensity of illitization could explain the high permeability of the well [18]. How-ever, the GRT-2 well presents high values of the 2200 nm absorption band area (20 a.u.); these are higher than the values measured in the GPK-1 well (13 a.u.) and also higher than those measured in other wells such as GRT-1 and GPK-4 [69]. These high SWIR 2200 nm absorption band area values are surprising considering the results of Vidal et al. [18]. The advantage of the SWIR method is that it provides a general and continuous overview of the well in terms of permeability indicators that prevents over-interpretation of punctual localized data.
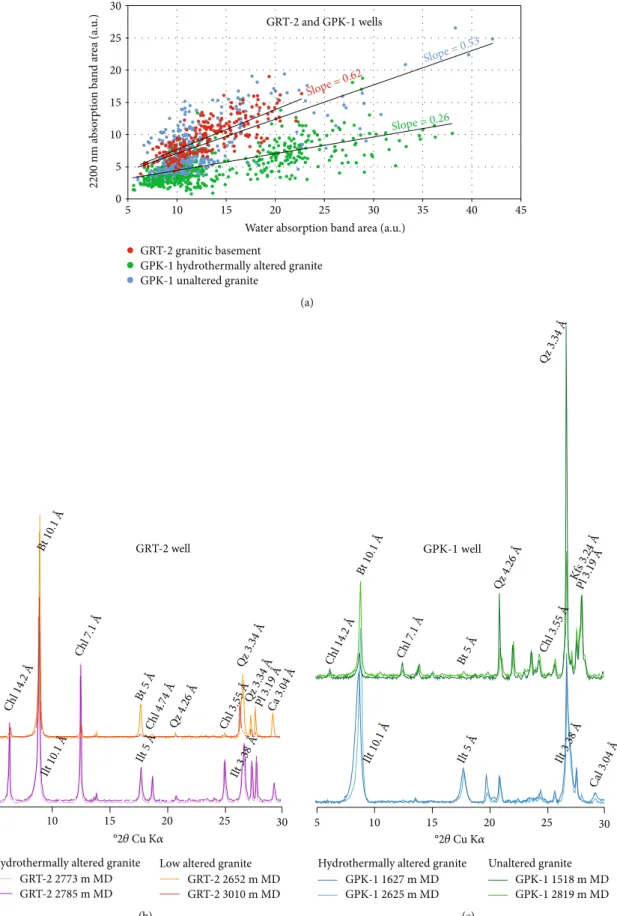
5.2. SWIR Correlation. From simple observations, for both the GRT-2 and GPK-1 wells, the water absorption band area and the 2200 nm absorption band area appear to be corre-lated (Figures 5 and 7). In fact, the ratio between the water absorption band area and the 2200 nm absorption band area varies significantly according to the species of aluminous phyllosilicates considered (illite and micas) [21].
The correlation between these two absorption bands was tested for both wells (Figure 9). For the GRT-2 well, the cor-relation appears to be linear with a corcor-relation coefficient of 0.62 (Figure 9(a)). For the GPK-1 well, the correlation pre-sents two linear tendencies (Figure 9(a)). After classifying the samples into altered and unaltered granite on the basis of petrographic observations, it was found that these two ten-dencies correspond to hydrothermally altered granite with a coefficient of 0.53 and to unaltered granite with a coefficient of 0.26 (Figure 9(a)).
From mineralogical identifications (XRD and binocular magnifier observations), the unaltered granite in both wells is characterized by the presence of biotite and chlorite whereas the altered granite is essentially characterized by the presence of illite and illite-rich illite/smectite mixed layers in considerable amounts (Figures 9(b) and 9(c)).
Based on the phyllosilicate mineralogy of the unaltered and altered granite, it seems relevant to use the 2200 nm absorption band area as an indicator of the illitization rate of the granitic rocks of Northern Alsace. In the GPK-1 well, we can clearly see that for a similar value of the water absorp-tion band area (e.g., a water absorpabsorp-tion band area of 20 a.u.), we observe values of the 2200 nm absorption band area of the illitized granite more than two times higher than those observed for the unaltered granite (17 a.u. and 7 a.u., respec-tively). Considering the absorption band area at 2200 nm, the lower absorption depth noted for the samples of unaltered granite (Figure 9) can be explained by a weak to very weak contribution of both primary biotite and chlorite to the absorption band near 2200 nm (Figure 4(b)). The correlation between the water absorption band area and the 2200 nm absorption band area indicates that the mineralogy of the GRT-2 well is more homogeneous than that of the GPK-1 well (Figure 9).
From the SWIR results, the GRT-2 well showed a higher degree of hydrothermal alteration all along the well com-pared to the GPK-1 well. In this well, unaltered granite pre-sents some localized sharp peaks of the 2200 nm absorption band area that correspond to the fracture-controlled altered zones. The interpretation of the two correlation tendencies of the GPK-1 well is consistent along with the petrographical observations: localized FZs are intersected on small apparent depth extents (Figures 7 and 9). These mineralogical and structural differences between the wells are explained by their different trajectories and concepts. Notably, the GPK-1 well was drilled nearly vertically and intersects few localized FZs at a higher angle, whereas the GRT-2 well is highly deviated but has an orientation parallel to the Rittershoffen local fault over its approximately 400 m apparent length. In fact, the GPK-1 well required stimulation, whereas the GRT-2 well did not, suggesting that intense illitization is a good indicator of permeability.
GRT-2 granitic basement
GPK-1 hydrothermally altered granite GPK-1 unaltered granite 0 5 10 15 20 25 30 5 10 15 20 25 30 35 40 45 Slope = 0.53 Slope = 0.62 Slope = 0.26
Water absorption band area (a.u.)
2200 nm a b so rp tio n ba nd a re a (a.u .) GRT-2 and GPK-1 wells (a)
Low altered granite GRT-2 2652 m MD GRT-2 3010 m MD Hydrothermally altered granite
GRT-2 2773 m MD GRT-2 2785 m MD Chl 14.2 Å Chl 7.1 Å Chl 4.74 ÅQz 4.26 Å °2𝜃 Cu K𝛼 5 10 15 20 25 30 Bt 10.1 Å Chl 3.55 Å Qz 3.34 Å Qz 3.34 ÅPl 3.19 Å Ca 3.04 Å Bt 5 Å Ilt 3.38 Å GRT-2 well Ilt 10.1 Å Ilt 5 Å (b) °2𝜃 Cu K𝛼 5 10 15 20 25 30 Chl 14.2 Å Chl 7.1 Å Ilt 10.1 Å Ilt 5 Å Bt 10.1 Å Bt 5 Å Cal 3.04 Å Pl 3.19 Å Kfs 3.24 Å Ilt 3.38 Å Chl 3.55 Å Qz 3.34 Å Qz 4.26 Å GPK-1 well Unaltered granite GPK-1 1518 m MD GPK-1 2819 m MD Hydrothermally altered granite
GPK-1 1627 m MD GPK-1 2625 m MD
(c)
Figure 9: Correlation of the SWIR water and 2200 nm absorption band area for (a) the GRT-2 and GPK-1 wells, (b) XRD results for the slightly altered granite and the hydrothermally altered granite in the GRT-2 well, and (c) XRD results for the unaltered granite and the hydrothermally altered granite in the GPK-1 well.
5.3. Electrical Logs and SWIR. The similar shapes and ten-dencies observed for the electrical logs and the SWIR data, outside of brine circulation in FZs, atfirst show a consider-able control of illite on the electrical properties measured in the GRT-2 and GPK-1 wells (Figure 10). Very conductive zones are often associated with the SWIR 2200 nm absorp-tion band area and with high GR-K peaks pointing to highly hydrothermally altered zones rich in illite. This type of zone could be observed either associated with aT anomaly, yield-ing an altered zone that is contributive (in FZ1 at 1620-1640 m MD in GPK-1) (Figure 8(a)), or with a straightT pro-file, yielding a sealed illitized zone (at 1550, 1579-1606, 1710, 1758, 1792, and 1860 m MD in GPK-1), which could be paleo-circulation zones (Figure 8). Resistive peaks can corre-late with negative 2200 nm absorption band area peaks and the occurrence of a quartz vein, suggesting a fracture core plugged with secondary drusy quartzfilling with insufficient residual porosity for abundant circulation and no abundant illite (low GR) (FZ1 at 1645 m MD in GPK-1) (Figure 8(a)). At a more restricted level, positive conductivity peaks can also correlate with negative GR-K peaks, low SWIR 2200 nm absorption band area, andT anomalies, translating
into the presence of brine such as in the cores of FZs (FZ2 at 1814 m in GPK-1, FZ1 at 2534 m MD, FZ3 at 2950 m MD, and FZ4 at 3050 m MD in GRT-2) (Figures 6 and 8).
5.4. FZ Signatures. In the GRT-2 well, FZs are always corre-lated withT anomalies and VEIN facies. This observation is probably related to the drusy euhedral quartz geometry, which keeps the space open and prevents plugging of the fracture. In contrast, the textural organization of illite in the FWs tends to plug the zone (Figure 10).
A specific signature of the resistivity laterolog is observed in both the GRT-2 and GPK-1 wells (FZ3 and FZ4 in GRT-2 and FZ2 in GPK-1), with very low resistivity values (20 ohm·m) corresponding to the occurrence of geothermal brine within the quartz vein as well as low resistivity values (20 ohm·m) corresponding to illite occurrence in the FW (Figures 6, 8, and 10).
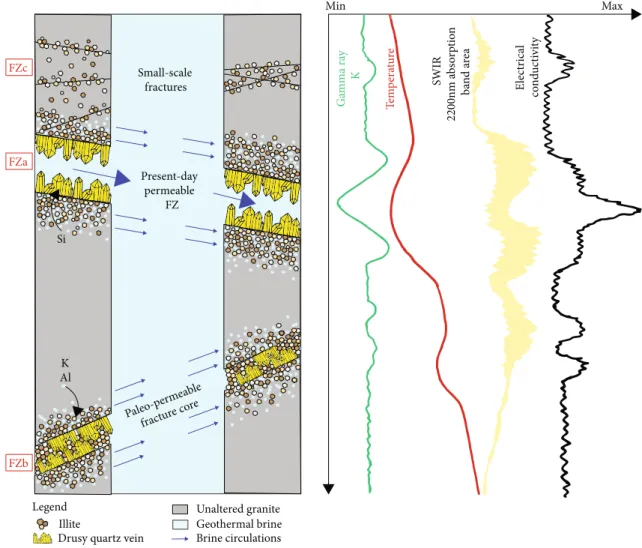
We can distinguish three types of FZs (Figure 10): (i) FZa: permeable FZs with localized brine
contribu-tions, such as FZ1, FZ3, and FZ4 in GRT-2
Present-day permeable FZ Paleo-p ermeable fracture co re Small-scale fractures
Drusy quartz vein
Geothermal brine Illite Unaltered granite Legend Ga mma ra y K T em p era tur e SWIR 2200nm a b so rp tio n ba n d a rea Electrical co nd uc ti vi ty FZa FZb FZc K Al Si Brine circulations Min Max
Figure 10: Model showing the variation in the 2200 nm absorption band area and its correlation with geophysical logs (gamma ray,
temperature, and electrical conductivity) in response to different grades of hydrothermal alteration of the granite and different FZ
(Figures 6(a), 6(c), and 6(d)) and FZ2 in GPK-1 (Figures 6(a), 6(c), 6(d), 8(b), and 10)
(ii) FZb: permeable FZs with multiple brine contribu-tions, such as FZ2 in GRT-2 and FZ1 in GPK-1 (Figures 6(b), 8(a), and 10)
(iii) FZc: paleo-permeable FZs, such as those at 1550, 1579-1606, 1710, 1758, 1792, and 1860 m MD in GPK-1 (Figures 8 and 10)
Evans et al. [70] showed that in the open-hole section of GPK-1, the poststimulatedflow zones systematically match the permeable and paleo-permeable FZs.
5.5. Applications. In future geothermal projects in the URG, the SWIR method could be a routine mud logging method. As a matter of fact, along with GR measurements obtained while drilling (MWD), cuttings provide thefirst data obtained during drilling. The use of SWIR measurements during dril-ling, when previously calibrated with the granitic analogue sig-nature, could be helpful in determining the extent of the hydrothermally altered fault damage zone and in quantifying the alteration grade encountered in the granite. This could help determine when the exploration well leaves the altered zone and thus when to stop drilling. The SWIR method could be used as a routine mud logging analysis on-site during dril-ling after washing and drying the cuttings samples. It could also be further refined for the alteration mineralogy identifica-tion in geothermal systems [21].
In enhanced geothermal system projects, SWIR could be used to target paleo-permeable zones that could be reopened (sealed fractures and damage zones), thereby enhancing the permeability between the well and the reser-voir during stimulation operations. In a similar manner, for existing geothermal wells in the URG drilled in granite, SWIR could be used as a complementary method to pre-cisely characterize the hydrothermal alterations around the FZs and to target potential stimulation zones in cases of decreased productivity.
6. Conclusion
In this paper, the analysis of the correlation between the SWIR water and 2200 nm absorption bands areas confirms the petrography observed in both wells. By showing that the mineralogy is more homogeneous in the GRT-2 well than in the GPK-1 well, the results confirm that the two wells do not crosscut the circulation zones in the same way. Showing that the fluid-rock ratio is higher in the GRT-2 well than in the GPK-1 well, these results are con-sistent, according to hydrothermal concepts, with the higher productivity of the GRT-2 well compared to the GPK-1 well, which required stimulation. In this study, we observe three types of FZs: FZs with a localized contri-bution, FZs with multiple contributions, and paleo-permeable FZs. In conclusion, the SWIR method is a robust method for the detection of paleo- and present cir-culation zones for geothermal applications. By the joint interpretation of SWIR data and other geophysical logs,
this method could be used to determine whether the stud-ied zone is a currently active circulation zone or a paleo-circulation zone. According to the values of the SWIR 2200 nm absorption band area, grades of alteration as well as the fluid-rock ratio trend can be determined. The sim-ilar variations in the SWIR 2200 nm absorption band area and the electrical logs demonstrate a significant influence of the rock clay mineral content (quantity of illitic minerals) on the electrical response. A specific electrical signature is observed in each well, indicating the FZ architecture and brine or illite contributions.
Data Availability
Data of the Rittershoffen wells belong to ECOGI. Please con-tact ES-Géothermie for data requests at geothermie@es.fr. Data of the Soultz wells can be requested at gui-chet.H@brgm.fr. SWIR data belong to ES-Géothermie and Poitiers University; for data request, please contact geothermie@es.fr.
Conflicts of Interest
The authors declare that they have no competing interests.
Authors’ Contributions
CG acquired the SWIR data in GPK-1. JV acquired the SWIR data in GRT-2. CG, JV, PP, DB, SP, and AG worked on the interpretation of SWIR data and the correlation with other geophysical logs. CG and J-FG worked on the interpretation of the electrical logs. All authors approved the final manuscript.
Acknowledgments
This manuscript was prepared as a contribution to the PhD thesis (University of Strasbourg) of Carole Glaas which is cofunded by ES-Géothermie and ANRT (French Agency for Research and Technology). The authors warmly thank Benoît Hébert for allowing them to use his in-house Visual Basic software (TSS) and the Poitiers University team for the use of the TerraSpec on the Soultz site. They warmly thank Chrystel Dezayes from BRGM for the access to the Soultz cuttings samples. The authors acknowledge the EGS Alsace and DEEP-EM projects funded by ADEME (French Agency for Environment), GEIE EMC, and ECOGI for pro-viding the Soultz and Rittershoffen cuttings samples and logs. Sophie Funfrock is thanked for improving the manuscript with English revision. Tom Schintgen is also thanked for the review of the manuscript.
Supplementary Materials
This supporting information provides details on the SWIR results acquired in the GRT-2 and GPK-1 wells. Figure S1 shows the intrasample variability in the GPK-1 well, present-ing the results of multiple measurements of the same cuttpresent-ings samples. Figure S2 shows the intrasample variability in the GRT-2 well, presenting the results of multiple measurements
![Figure 1: Complexity of a FZ after Caine et al. [71]. We can di ff erentiate three zones: (a) the fault core, which can be a pathway for fl uid if illite and quartz veins are not totally sealing the zone, (b) the damage zone, which can be sealed or opened wi](https://thumb-eu.123doks.com/thumbv2/123doknet/14758189.583644/3.899.200.702.109.631/figure-complexity-caine-erentiate-pathway-illite-totally-sealing.webp)