ISMRE2018/XXXX-2018 ALGERIA
Creep rupture of the drawn copper wire
1,*S.Gareh,
1L.Fellah
1*
University of Kasdi Merbah-Ouargla, Ouargla, 40000, Algeria
Corresponding author*: Tel: 00 213 0776651689;[email protected]
Abstract
—
This investigation presents the creep rupture behaviour of drawn copper wire. Creep studies were carried at 290oC under differentes stress98, 108 and 118 MPa. The variation of rupture time of the material with stress followed a power law relation. The time to onset of tertiary stage of deformation was directly proportional to rupture time. The value of damage tolerance factor indicates the creep damage results from growth of cavities by coupled diffusion and power-law creep during creep in the drawn copper wire. The data were analyzed in terms of Larson–Miller parameter.
Keywords—Creep rupture, Drawn copper, Larson-Miller parameter.
I. INTRODUCTION
copper has been one important base metals for a long time, because of its excellent electric and thermal conductivity [1]. copper is used in electrical fields (transmission cable [2], telephone, generator, electric pump, ..). More than, this materials also used in nuclear field [3]. However, the mechanical characteristic of copper such as creep resistance more need more important for industrial use. well on during the use of this material in the fields industrial, this material is ruptured, thus it is must studied the rupture the behavior of this material in creep.
The ductile rupture of polycrystalline alloys occurs by void nucleation, growth and coalescence [4,5]. Typically the voids, which are approximately
spherical, nucleate from inclusions/second-phase particles present in the alloy under favourable hydrostatic tensile stress in the presence of plastic deformation. The voids growth under increased the applied stress. if the void increase at large size,they will coalesce either with neighbouring voids or the nearby crack [6].
The present research work deals with the study of the creep rupture behaviour of drawn copper wire at temperature 290 ° C and different stress.
II. EXPERIMENTAL
The material used in this study is an drawn copper wire of 99.99 purity. This material has been submitted to wiredrawing process. All samples having gauge length of 100 mm and diameter of 1.8 mm. The creep specimens were tested at temperature 290 ° C and under stress of 98, 108 and 118 MPa.
III. RESULTS AND DISCUSSION
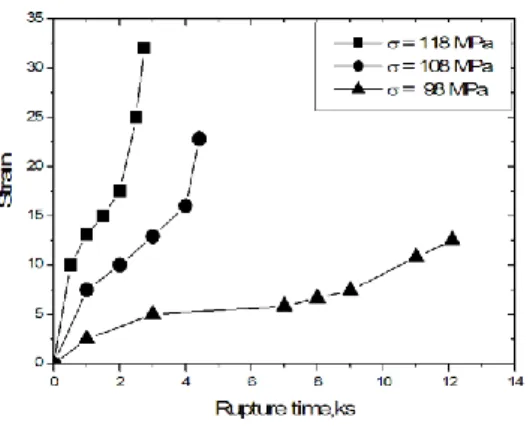
Fig. 1 shows the variations of strain with time (creep curve) of the drawn copper wire at 290OC
for different stresses. The creep deformation of this material was characterized by a small instantaneous deformation on loading, a transient primary stage, an apparent secondary stage, followed by a prolonged tertiary creep regime.
ISMRE2018/XXXX-2018 ALGERIA
Fig. 1 Creep curves of drawn copper at 290 ° C.
The variation of rupture time of the drawn copper wire with applied stress is shown in adouble-logarithmic plot in Fig.2. Rupture time was found to decrease with increase the applied stress and submitted a power law relation tr = A σ n, where A
and n are the stress coefficient and the stress exponent, respectively. Similar observations of decrease in stress exponent ‘n’ with temperature were reported in Ref. [7].
Fig.3.Show the variation of percentage elongation and reduction in area as a function of rupture time. The variation of percentage elongation decrease with increasing rupture time, also with according to Fig.3 we found that reduction in area increases with increasing rupture time.
The time to onset of tertiary ‘tot’ was measured
from creep curve as the time at which the creep rate attained its minimum and beyond which the creep rate accelerated. The variation of ‘tot’ with rupture
time is shown in Fig. 4. It followed a linear equation of the form tot = F tR, where ‘F’ is a
constant.The constant ‘F’ was equal 0,78, which suggests that the drawn copper wire spent almost
22 % of its creep life in the tertiary stage of
deformation. The extensive tertiary creep in terms of both the
Fig.2. Rupture time dependence of applied stress for
drawn copper wire.
Fig.3. The variation of percentage elongation and
reduction in area as a function of rupture time
small time spent and accumulation of large creep deformation observed in this material.
The creep damage tolerance factor (λ) provides a measure of the susceptibility of a material to localized cracking at locations of concentrated applied stress and deformation. It is a very important parameter to evaluate the performance of the materials. The factor λ is defined 𝜆 = 𝜀𝑓⁄𝜀̇𝑚𝑡𝑅, where εf is deformation to fracture, 𝜀̇𝑚 is minimum
ISMRE2018/XXXX-2018 ALGERIA
creep rate and tR is rupture time. It is known that
each damage micromechanism, when acting alone, results in a distinctive shape of the creep curve and a corresponding characteristic value of λ. For
λ=1.5–2.5, the creep damage results from growth
of voids by coupled diffusion and power-law creep [8]; for λ=5 or more, it results from degradation of the microstructure such as coarsening of the precipitates and/or dislocation substructural softening [9]. For λ=1, materials have low creep deformation,and brittle fracture mode is detected as they fracture without any significant plastic deformation, while big values indicate that the material can with stand deformation concentration without local of the crack and the fracture is ductile [10].
Fig. 4. Variation of time to onset of tertiary creep tot as a
function of rupture time
for the drawn copper wire at 290OC.
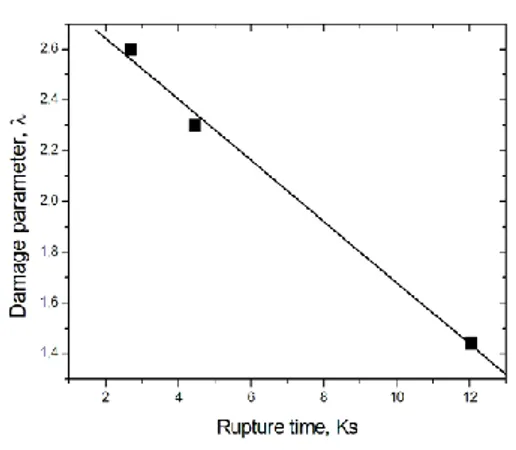
Fig. 5 shows the variation of creep damage tolerance factor with rupture time for different applied stresses of the drawn copper wire in the present study. The average value of was between 1,4 and 2,6 for the drawn copper wire,this mean value is indicated as damage mechanism due to creep resulting from growth of voids by coupled diffusion and power-law creep in the copper.
Fig.5.Variation of creep damage parameter λ as a
function of rupture time
The creep resistance in terms of rupture time for drawn copper wire may be defined according to the Larson-Miller parameter LMP (Eq.1):
𝐿𝑀𝑃 = 𝑇[𝑙𝑜𝑔𝑡𝑅+ 𝐶] (1) where T is the temperature expressed in K, tR is the
rupture time of creep tests in hours and C is a constant (C = 20 for standard materials [11]). If the stress applied of the creep tests is plotted in logarithmic scale versus the obtained Larson-Millerparameter a linear trend can be observed as demonstrated in Fig.6.
ISMRE2018/XXXX-2018 ALGERIA
IV. CONCLUSION
The main remarks of this investigation can be summarized as follows:
1)- The variation of percentage elongation decrease with increasing rupture time
2)- The reduction in area increases with increasing rupture time.
3)- The time to onset of tertiary is a linear function of rupture time, The tertiary creep have to small time in creep lifetime and to large creep deformation compared to another creep stages. 4)- The average value of λ was between 1.2 to 2.7 for the drawn copper wire. The value of λ indicates the creep damage results from growth of cavities by coupled diffusion and power-law creep during creep in the drawn copper wire.
5)- The stress applied is a linear function of the LMP.
REFERENCES
[1] Fujiwara S, Abiko K, Ductility of ultra high purty copper, J. Phys. IV 1995; 5 : 295-300.
[2] N.S. Beniwal, D.K. Dwivedi, H.O. Gupta, Creep life assessment of distribution transformers, Eng. Fail. Ana. 2010; 17: 1077–1085.
[3] Henrik C. M, Andersson-Östling Sandström.Survey R, creep properties of copper intended for nuclear waste disposal , Technical Report TR-09-32. December 2009. www.skb.se. [4] Gurson A.L, Continuum theory of ductile rupture by void nucleation and growth: part 1 yield criteria and flow rules for porous ductil media,Trans.ASME,J.Eng.Mater.Tech. 1977;2–15. [5]Garrison W.M.,.Moody N.R, Ductile fracture,J.Phys.Chem.Sol. 1987;48 ;1035–1074.
[6] Das A., Roy N., Ray A.K., Stress induced creep cavity, Mater.Sc.Eng.A 2014; 598 : 28–33.
[7] Wilshire B., Scharning P.J., A new methodology for analysis of creep and creep fracture data for 9–12% chromium steels, Int. Mater. Rev 2008 ; 53 : 91–104.
[8] Ashby M.F., Dyson B.F., Advances in Fracture Research, Pergamon Press, Oxford 1. 1984 ;3–30.
[9] Choudhary B.K., Samuel E.I., Creep behaviour of modified 9Cr–1Mo ferritic steel, J. Nucl. Mater. 2011 ; 412 :82–89.
[10] Nabarro F.R.N., de Villiers H.L., The Physics of Creep, Taylor & Francis 1995 : 22–25.
[11] Dieter G. E., Mechanical Metallurgy, Third Edition, McGraw-Hill Inc. 1986 : 461–465.