https://doi.org/10.5194/tc-12-3409-2018
© Author(s) 2018. This work is distributed under the Creative Commons Attribution 4.0 License.
Brief communication: Impact of the recent atmospheric circulation
change in summer on the future surface mass balance of the
Greenland Ice Sheet
Alison Delhasse1, Xavier Fettweis1, Christoph Kittel1, Charles Amory1, and Cécile Agosta1,2 1Laboratory of Climatology, Department of Geography, University of Liège, Liège, Belgium 2Laboratoire des Sciences du Climat et de l’Environnement, Gif-sur-Yvette, France
Correspondence: Alison Delhasse ([email protected]) Received: 27 March 2018 – Discussion started: 17 April 2018
Revised: 17 August 2018 – Accepted: 4 September 2018 – Published: 30 October 2018
Abstract. Since the 2000s, a change in the atmospheric cir-culation over the North Atlantic resulting in more frequent blocking events has favoured warmer and sunnier weather conditions over the Greenland Ice Sheet (GrIS) in summer, enhancing the melt increase. This circulation change is not represented by general circulation models (GCMs) of the Coupled Model Intercomparison Project Phase 5 (CMIP5), which do not predict any circulation change for the next cen-tury over the North Atlantic. The goal of this study is to evaluate the impact of an atmospheric circulation change (as currently observed) on projections of the future GrIS surface mass balance (SMB). We compare GrIS SMB estimates sim-ulated by the regional climate model MAR forced by per-turbed reanalysis (ERA-Interim with a temperature correc-tion of + 1, +1.5, and +2◦C at the MAR lateral boundaries) over 1980–2016 to projections of the future GrIS SMB from MAR simulations forced by three GCMs over selected pe-riods for which a similar temperature increase of +1, +1.5, and +2◦C is projected by the GCMs in comparison to 1980– 1999. Mean SMB anomalies produced with perturbed re-analysis over the climatologically stable period 1980–1999 are similar to those produced with MAR forced by GCMs over future periods characterised by a similar warming over Greenland. However, over the 2 last decades (2000–2016) when an increase in the frequency of blocking events has been observed in summer, MAR forced by perturbed reanal-ysis suggests that the SMB decrease could be amplified by a factor of 2 if such atmospheric conditions persist compared to projections forced by GCMs for the same temperature in-crease but without any circulation change.
1 Introduction
Starting in the late 1990s, the surface mass balance (SMB, i.e. the difference between mass sources and sinks at the sur-face) of the Greenland Ice Sheet (GrIS) has been decreas-ing through a rise in surface meltwater run-off (RU) (Fet-tweis et al., 2013a; van den Broeke et al., 2016). Since the 2000s, multiple melting records have been broken over the GrIS (Tedesco et al., 2013; Hanna et al., 2014; Fettweis et al., 2017) and 70 % of this melt increase can be attributed to an atmospheric circulation change gauged through a shift in the summer North Atlantic Oscillation (NAO) index to negative values (Fettweis et al., 2013b). These changes have favoured anticyclonic conditions (i.e. more frequent block-ing events) in summer over Greenland which enhance the melt–albedo feedback through three main ways (Box et al., 2012): (1) an increase in advection of warm air along the western coast of the ice sheet enhancing the surface sensi-ble heat flux and thus strengthening snow grain metamor-phism and further decreasing surface albedo (Tedesco et al., 2016); (2) a decrease in snowfall (SF) rates in summer lead-ing to longer exposure of bare ice at the GrIS margins (Noël et al., 2015); and (3) an increase in incoming radiation result-ing in more surface heatresult-ing. For this last feature, the debate about the contribution of shortwave and longwave radiation is still ongoing as the role of clouds is opposite between the ablation zone (more sensitive to shortwave anomalies) and the accumulation zone (more sensitive to longwave anoma-lies). Hofer et al. (2017) point out the importance of increas-ing incomincreas-ing solar radiation while other studies allocate the increase in surface heating and melting to longwave
radia-tion notably due to the transport of water vapour (Neff et al., 2014; Bonne et al., 2015) and liquid low-level clouds (Ben-nartz et al., 2013). These processes reduce meltwater refreez-ing and then enhance meltwater RU (Van Tricht et al., 2016). Such an amplification in surface melt is well represented by regional climate models (RCMs) forced by climate reanal-ysis, which capture the current circulation change (Ettema et al., 2009; Fettweis et al., 2011, 2017; Noël et al., 2015, 2018). However, as general circulation models (GCMs) do not presently predict any future circulation change (Belle-flamme et al., 2012; Fettweis et al., 2013b; Hanna et al., 2018), the melt increase currently observed is underestimated when RCMs are forced by GCM scenarios starting from the 2000s (e.g. Fettweis et al., 2011, 2013b; Rae et al., 2012). This raises the question of how RCM-based projections of future GrIS SMB are affected by the GCM forcing if the re-cent shift to negative NAO phases in summer persists through the next decades?
To address this issue, we use the Modèle Atmosphérique Régional (MAR), especially developed for polar regions, to perform a sensitivity study based on the analysis of MAR-derived GrIS SMB anomalies resulting from various forcing experiments with ERA-Interim reanalysis and three GCMs from the CMIP5 database (Climate Model Intercomparison Project Phase 5; Taylor et al., 2012).
2 Data and methodology
2.1 The regional climate model MAR
The model MAR is a RCM specifically developed for sim-ulating polar climate specificities (e.g. Amory et al., 2015; Gallée et al., 2015; Lang et al., 2015) and furthermore abun-dantly evaluated over the GrIS (e.g. Fettweis et al., 2011, 2017). In this study, we use version 3.8 of MAR and refer to Fettweis et al. (2017) for a more detailed description of MAR. Relative to version 3.5 used in Fettweis et al. (2017) and in addition to the usual bug fixes and improved computa-tion efficiency, the main improvement of MAR v3.8 consists of an increase in the cloud lifetime, partly correcting the un-derestimation of downward longwave radiation and the over-estimation of inland precipitation described in Fettweis et al. (2017).
MAR requires prescription of atmospheric fields (tem-perature, specific humidity, wind speed, pressure) at its lat-eral boundaries as well as sea surface conditions (SSC, de-fined as sea ice concentration and sea surface temperature) from climate reanalysis or GCM outputs. Using the ERA-Interim reanalysis (Dee et al., 2011) to force MAR, Fettweis et al. (2013a) have shown that the period 1980–1999 is char-acterised by a stable climate and general circulation over Greenland, before a circulation shift occurred in summer at the end of the 1990s. In this study, we thus consider the pe-riod 1980–1999 as a reference (Fettweis et al., 2013a) and
discuss mean GrIS annual SMB anomalies with respect to this reference period.
2.2 Forcing experiments
We performed two sets of sensitivity experiments according to the large-scale forcing used, as described below.
2.2.1 ERA-Interim forcing
MAR was first forced by the ERA-Interim reanalysis every 6 h at a spatial resolution of 25 km over 1979–2016. Two dis-tinct periods are considered: the reference period 1980–1999 and the period 2000–2016 for which a different atmospheric circulation has been observed in summer on average by com-parison with the reference period (Fettweis et al., 2013b, 2017; Hanna et al., 2018). Then we performed sensitivity ex-periments in which ERA-Interim atmospheric temperatures were increased by +1, +1.5, and +2◦C at each of the 24 vertical sigma levels of the MAR atmospheric lateral bound-aries (hereafter referred to as perturbed reanalysis). The mean SMB anomalies of these sensitivity experiments are referred to as MARera+1, MARera+1.5, and MARera+2 for anomalies averaged over 1980–1999 and MARera2k, MAR-era2k+1, MARera2k+1.5, and MARera2k+2 for correspond-ing anomalies averaged over 2000–2016 (Appendix A, Ta-ble A1). Note that the relative humidity at the lateral bound-aries was conserved by modifying the specific humidity ac-cording to temperature changes in order to obtain precipita-tion fields consistent with warmer ERA-Interim atmospheric temperatures. However, SSC from ERA-Interim reanalysis remained unchanged in the sensitivity experiments.
2.2.2 GCM forcing
We performed three additional experiments in which MAR was forced over 1980–2060 with three GCMs from the CMIP5 database, using the historical scenario over 1980– 2005 and the future RCP4.5 scenario (Moss et al., 2010) over 2005–2060. Then, for each GCM, three 20-year pe-riods (different for each GCM) characterised by a climate about ∼ +1, ∼ +1.5, and ∼ +2◦C warmer on average than the climate over the reference period (as represented by the GCM) of 1980–1999 were considered (Table 1). The differ-ences between the GCM periods are only due to the tim-ing required to reach each relative warmtim-ing. Note that each warming was computed as the mean JJA (June–July–August) temperature anomaly compared to 1980–1999 over the com-putation domain (100–0◦W, 55–85◦N) at four vertical levels in the free atmosphere (850, 700, 600, and 500 hPa).
The three GCMs used are CanESM2, NorESM1, and MIROC5, identified in Fettweis et al. (2013b) as the CMIP5 GCMs best representing the general circulation at 500 hPa (influencing the precipitation amount and pattern simulated by MAR) and the JJA temperature at 700 hPa over Greenland (influencing the melt amount simulated by MAR) compared
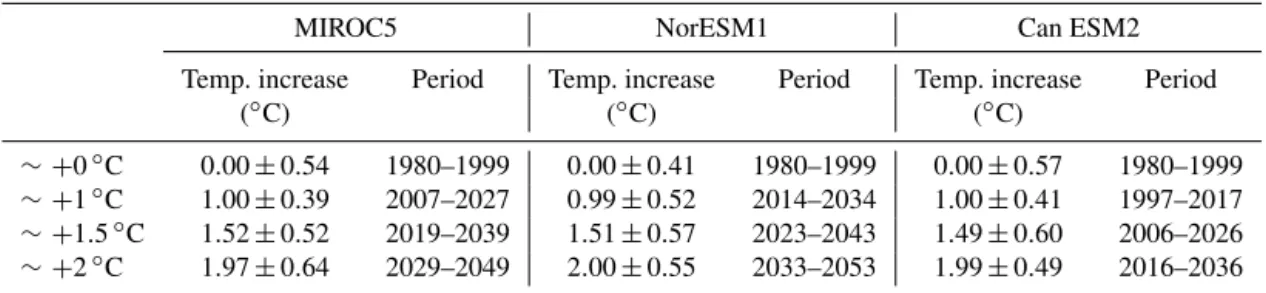
Table 1. The 20-year periods corresponding to an increase in temperature of ∼ +1, ∼ +1.5, and ∼ +2◦C for the three selected GCMs (MIROC5, NorESM1, and CanESM2). The exact increase in temperature and the standard deviation for these periods compared with 1980– 1999 are shown.
MIROC5 NorESM1 Can ESM2 Temp. increase Period Temp. increase Period Temp. increase Period
(◦C) (◦C) (◦C)
∼ +0◦C 0.00 ± 0.54 1980–1999 0.00 ± 0.41 1980–1999 0.00 ± 0.57 1980–1999 ∼ +1◦C 1.00 ± 0.39 2007–2027 0.99 ± 0.52 2014–2034 1.00 ± 0.41 1997–2017 ∼ +1.5◦C 1.52 ± 0.52 2019–2039 1.51 ± 0.57 2023–2043 1.49 ± 0.60 2006–2026 ∼ +2◦C 1.97 ± 0.64 2029–2049 2.00 ± 0.55 2033–2053 1.99 ± 0.49 2016–2036
to ERA-Interim over 1980–1999. However, some discrepan-cies remain between MAR forced by these GCMs and MAR forced by ERA-Interim over 1980–1999. For instance, MAR underestimates RU and overestimates SF when forced by NorESM1 compared to MAR forced by ERA-Interim (Fet-tweis et al., 2013a). This is also confirmed by a recent study comparing melt energy budgets from MAR forced by ERA-Interim, MIROC5, NorESM1, and CanESM2 (Leeson et al., 2018). This is why the SMB obtained with perturbed reanal-ysis cannot be directly compared to the SMB obtained with GCM forcing data because of these divergences over the ref-erence period.
Therefore we compare anomalies of these GCM-forced projections during the 20-year future periods of ∼ +1, ∼ +1.5, and ∼ +2◦C to the corresponding GCM-forced MAR climate over the reference period (1980–1999) and not di-rectly to MAR forced by ERA-Interim over 1980–1999. As for the sensitivity experiments using the ERA-Interim re-analysis as forcing, the mean SMB anomalies associated with these GCMs experiments are respectively referred to as MARcan+x for CanESM2, MARmir+x for MIROC5, and MARnor+x for NorESM1, where x equals 1, 1.5, or 2 corre-sponding to a warming of +1, +1.5, or +2◦C (Appendix A, Table A2). Contrary to ERA-Interim-forced experiments, no humidity correction has been applied at the MAR lateral boundaries and the SSC are directly prescribed from the RCP4.5 scenario projected by the respective GCM.
3 Results
3.1 Analysis of warming experiments without circulation change
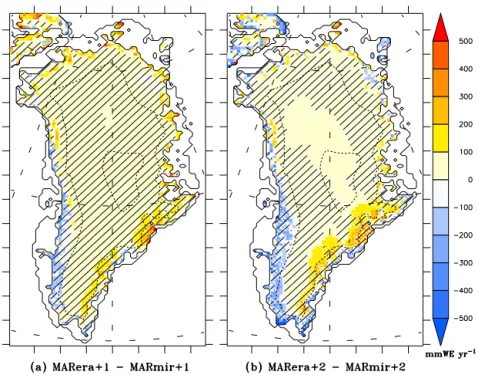
Before assessing the impact of the current circulation change on SMB projections, we evaluate analogies between MAR forced by perturbed reanalysis and by GCM scenarios over future periods experiencing a similar warmer climate. Fig-ure 1 shows the difference in SMB anomalies between MAR-era+1 (+2) and MARmir+1 (+2, using MIROC5 as a forc-ing) over 1980–1999 when the mean general circulation in summer is similar in both ERA-Interim and the GCMs.
Even if the differences are mainly not statistically signifi-cant (i.e. lower than the inter-annual variability in the simu-lation of MAR forced by unaltered ERA-Interim over 1980– 1999), the RU anomalies are generally higher if MAR is forced by GCMs rather than by corresponding perturbed re-analysis. GCM-forced simulations also predict a higher pre-cipitation increase along the south-east of the ice sheet. These weak differences are caused by the SSC, which were not modified in experiments based on perturbed reanalysis, while the GCM-forced simulations use future SSC. Anomalies at the ice sheet margins (Fig. 1) are similar to the SMB anoma-lies found by Noël et al. (2014), who evaluated the (insignif-icant) impacts of SSC on the SMB of the GrIS. We therefore assume that anomalies between MARera+x and MARmir (or MARnor or MARcan) result from the SSC unchanged in MARera+x. Because GCMs fail to represent the circulation change observed in summer over Greenland since the 2000s, MAR forced by perturbed reanalysis over 1980–1999 simu-lates SMB anomalies similar to MAR forced by GCMs over the corresponding future warmer periods. Therefore, evalu-ating MAR forced by perturbed reanalysis over 2000–2016 allows us to evaluate the likely impact of a warmer climate induced by an increase in blocking events (as currently ob-served) on the projected GrIS SMB.
3.2 Influence of a potential future circulation change Over 2000–2016, the JJA temperature in the ERA-Interim reanalysis has increased by 0.7◦C in the free atmosphere (mean 850–500 hPa temperature integrated over the com-putation domain) compared to 1980–1999. This offset in temperature has to thus be taken into account when com-paring the anomalies of the different warming experiments. The SMB anomaly MARera2k+1 (MARera2k+1.5) is sig-nificantly more negative (up to a factor of 2) than perturbed-reanalysis experiments and GCM-forced future experiments relative to a climate warmer by +1.5◦C (+2◦C) (Table 2). This suggests that capturing the recent circulation change simulated by perturbed-reanalysis experiments would en-hance the projected SMB decrease compared to the de-crease projected for a warmer climate without any circula-tion change. This is illustrated in Fig. 2 in which the decrease
Figure 1. Differences of mean anomalies of annual SMB (in mm w.e. y−1) between (a) MARera+1 and MARmir+1 and (b) MARera+2 and MARmir+2. Areas where anomaly differences are smaller than the inter-annual variability (i.e. the standard deviation) of the simulation of MAR forced by unaltered ERA-Interim over 1980–1999 are hatched. Dashed lines are equal altitude lines of 2000 and 3000 m. See Appendix A and Tables A1 and A2 for abbreviations.
in SMB is amplified for an equal increase in temperature of +2◦C over 2000–2016 (Fig. 2b), i.e. including the recent cir-culation change, compared to the decrease for the reference circulation over 1980–1999 (Fig. 2a). Additional 2-D rep-resentations of these differences for GCM experiments are available in the Supplement.
As RU and SF mainly drive the GrIS SMB (Box et al., 2004), we mainly discuss in the following the anomalies rel-ative to these two components. As for SMB anomalies, RU and SF anomalies are computed as differences between the corresponding mean value for a given experiment and the mean value for the reference period using the unaltered large-scale forcing (Table 2). Even though non-significant, an in-crease in SF is observed for all experiments associated with a rise in temperature in response to a higher air capacity for holding water vapour (Fettweis et al., 2013a). Moreover, mean RU anomalies increase with the temperature rise in all warming experiments, most significantly for the experiments using perturbed reanalysis over 2000–2016 when the circula-tion change has occurred. It can thus be concluded that run-off is mainly responsible for the SMB discrepancies between the different sensitivity experiments in a warmer climate. As for RU, melt anomalies are also amplified with the circula-tion change (Table 2). However, RU anomalies are systemat-ically higher than melt anomalies. This can be explained by two factors (Machguth et al., 2016): (1) there is less pore place available for meltwater storage in warmer and then more saturated firn and (2) the bare ice area (in the ablation
zone) is larger in a warmer climate, reducing the potential surface for meltwater storage, which also amplifies the melt-water run-off increase. The future decrease in the ice sheet meltwater retention capacity has notably been discussed by Van Angelen et al. (2013).
On average over the ice sheet, downward shortwave radi-ation (SWD) and downward longwave radiradi-ation (LWD) are respectively almost 4 and 3 W m−2 higher over the 2000– 2016 period than over the reference period (Table 3). This is in concordance with the conclusions of Hofer et al. (2017), which argue that the current observed melt increase since the 2000s is a combination of the increase in SWD and LWD. However both simulations forced by perturbed reanalysis and in GCM-forced simulations with a warmer climate suggest a strong SWD decrease as a result of an increasing cloud cover, as already discussed in Franco et al. (2013). This ef-fect combined with a higher free-atmosphere temperature ex-plains then the increase in LWD in a warmer climate (Hofer et al., 2017).
Due to the enhanced positive melt–albedo feedback since the 2000s, SWD absorbed by the surface is more than 2 times higher in simulations with perturbed reanalysis over 2000– 2016 than over the reference period. Due to a lower albedo (in particular in the ablation zone), the surface absorbs more energy, amplifying the melt increase, which further decreases the albedo, potentially re-accelerating melting in addition to a decrease in the ice sheet capacity to refreeze meltwater. This positive feedback triggered by more frequent
anticy-Figure 2. (a) Mean anomalies of annual SMB (mm w.e. y−1) of MAR forced by an ERA-Interim warmer by +2◦C compared to MAR forced by unaltered ERA-Interim over 1980–1999. (b) Differences between mean anomalies of annual SMB (mm w.e. y−1): MARera2k+2 minus MARera2k. Areas where anomaly differences are smaller than the inter-annual variability (i.e. the standard deviation) of the simulation of MAR forced by unaltered ERA-Interim over 1980–1999 are hatched. Dashed lines are equal altitude lines of 2000 and 3000 m. See Appendix A and Tables A1 and A2 for abbreviations.
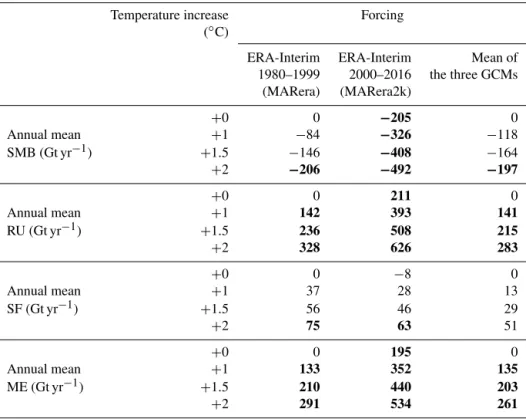
Table 2. Mean GrIS-integrated anomalies of annual SMB (Gt y−1), RU (RU), snowfall (SF), and melt (ME) compared to 1980–1999. Anomalies from GCM-forced simulations are given as averaged. Anomalies greater than the 1980–1999 standard deviation (i.e. greater than the inter-annual variability) of the simulation of MAR forced by unaltered ERA-Interim are shown in bold.
Temperature increase Forcing (◦C)
ERA-Interim ERA-Interim Mean of 1980–1999 2000–2016 the three GCMs (MARera) (MARera2k) +0 0 −205 0 Annual mean +1 −84 −326 −118 SMB (Gt yr−1) +1.5 −146 −408 −164 +2 −206 −492 −197 +0 0 211 0 Annual mean +1 142 393 141 RU (Gt yr−1) +1.5 236 508 215 +2 328 626 283 +0 0 −8 0 Annual mean +1 37 28 13 SF (Gt yr−1) +1.5 56 46 29 +2 75 63 51 +0 0 195 0 Annual mean +1 133 352 135 ME (Gt yr−1) +1.5 210 440 203 +2 291 534 261
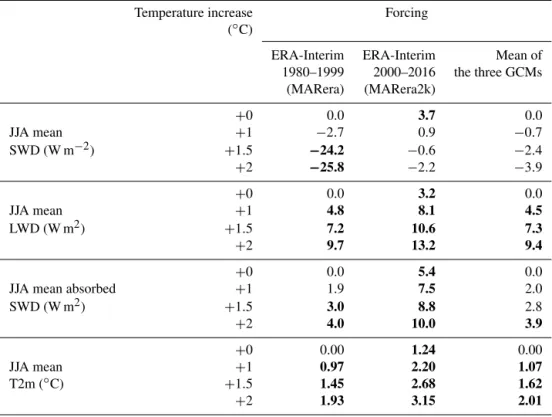
Table 3. Mean GrIS-integrated anomalies of summer energy fluxes (W m−2) and summer surface 2 m temperature (◦C) compared to 1980– 1999. Anomalies from GCM-forced simulations are given as averaged. Anomalies greater than the 1980–1999 standard deviation (i.e. greater than the inter-annual variability) of the simulation of MAR forced by unaltered ERA-Interim are shown in bold.
Temperature increase Forcing (◦C)
ERA-Interim ERA-Interim Mean of 1980–1999 2000–2016 the three GCMs (MARera) (MARera2k) +0 0.0 3.7 0.0 JJA mean +1 −2.7 0.9 −0.7 SWD (W m−2) +1.5 −24.2 −0.6 −2.4 +2 −25.8 −2.2 −3.9 +0 0.0 3.2 0.0 JJA mean +1 4.8 8.1 4.5 LWD (W m2) +1.5 7.2 10.6 7.3 +2 9.7 13.2 9.4 +0 0.0 5.4 0.0
JJA mean absorbed +1 1.9 7.5 2.0 SWD (W m2) +1.5 3.0 8.8 2.8 +2 4.0 10.0 3.9 +0 0.00 1.24 0.00 JJA mean +1 0.97 2.20 1.07 T2m (◦C) +1.5 1.45 2.68 1.62 +2 1.93 3.15 2.01
clonic summer situations over Greenland causes a run-off in-crease nearly 2 times higher in simulations over 2000–2016 than in the simulations over the reference period.
In the absence of a circulation change, the increase in near-surface temperature (T2m) is only due to the temperature in-crease prescribed at the MAR lateral boundaries (Table 3). With a circulation change, the increase in T2m is higher and no more uniform as a result of enhanced warm air advection along the West GrIS (see Fig. S1 in the Supplement). Such more frequent anticyclonic conditions, resulting from more frequent blocking events (Hanna et al., 2018), explain the in-crease in cloud cover at the north of the ice sheet and the associated LWD increase shown in Hofer et al. (2017) in this area, while sunnier conditions dominate in the southern part.
4 Conclusions
The goal of this study is to assess the impact of unresolved recent atmospheric circulation change in GCMs on RCM-based projections of future GrIS SMB. For this purpose, we used the RCM MAR and performed forcing sensitivity ex-periments with the ERA-Interim reanalysis and large-scale fields from three selected GCMs of the CMIP5 database to investigate the influence of a warmer atmosphere in the con-text of a circulation change inducing more frequent blocking events.
We used the annual SMB produced with each original forcing over the climatologically stable period of 1980–1999 as a reference to compute mean annual SMB anomalies rela-tive to each forcing experiment.
The first experiments consisted of increasing the atmo-spheric temperature in the ERA-Interim reanalysis by +1, +1.5, and +2◦C at the MAR lateral boundaries over two distinct periods, i.e. 1980–1999 and 2000–2016, respectively before and after the shift in the summer NAO index. Addi-tional forcing experiments were then performed using the three selected GCMs to force MAR over the reference period and over 20-year future periods for which a similar temper-ature increase of ∼ +1, ∼ +1.5, and ∼ +2◦C is predicted by these GCMs in the free atmosphere.
The comparison among SMB anomalies relative to per-turbed reanalysis and GCM future experiments revealed sim-ilar results for each corresponding warming experiment, since for each GCM the atmospheric circulation remains un-changed over time. This allowed us to evaluate the likely im-pact of a warmer climate induced by a circulation change on the GrIS SMB by comparing SMB anomalies relative to per-turbed reanalysis over 2000–2016 with GCM-forced future SMB anomalies. This comparison suggests that capturing the circulation change leads to SMB anomalies 2 times higher on average with a circulation change than without for a similar atmospheric warming. These higher anomalies are explained
by more frequent summer anticyclonic situations over GrIS, leading to an increase in SWD and warm air advection along the west coast, both promoting a decrease in albedo. As a re-sult, the run-off increase is enhanced and is responsible for the higher decrease in SMB.
The results of this study suggest that previous estimates of GrIS melt projections produced using CMIP5 data as forcing (e.g. Rae et al., 2012; Fettweis et al., 2013a) could be sig-nificantly underestimated if the current summer atmospheric circulation pattern over Greenland persists. In the context of the forthcoming sixth phase of the Coupled Model Intercom-parison Project, our conclusions highlight the importance of examining whether GCMs predict circulation changes in the next decades and, if so, of evaluating their potential influence on projections of the future GrIS SMB. Another remaining scientific challenge of particular interest for GrIS SMB pro-jections is to establish if the increasing frequency of blocking events could be linked to global climate change.
Data availability. All MARv3.8 outputs presented here are avail-able upon request by email ([email protected]), and the source code of MARv3.8 is available at ftp://ftp.climato.be/fettweis/ MARv3.8/.src/ (Fettweis et al., 2017). The ECMWF reanaly-ses (ERA-Interim) were downloaded from http://apps.ecmwf.int/ datasets/.
Appendix A: Description of the abbreviations used in this study
Table A1. Abbreviation description of reanalysis sensitivity experiments.
MARera+1 Anomalies between MAR forced by the ERA-Interim reanalysis warmer by +1◦C over 1980–1999 and MAR forced by the unaltered ERA-Interim reanalysis over 1980–1999
MARera+1.5 Anomalies between MAR forced by the ERA-Interim reanalysis warmer by +1.5◦C over 1980–1999 and MAR forced by the unaltered ERA-Interim reanalysis over 1980–1999
MARera+2 Anomalies between MAR forced by the ERA-Interim reanalysis warmer by +2◦C over 1980–1999 and MAR forced by the unaltered ERA-Interim reanalysis over 1980–1999
MARera2k Anomalies between MAR forced by the ERA-Interim over 2000–2016 and MAR forced by the unaltered ERA-Interim reanalysis over 1980–1999
MARera2k+1 Anomalies between MAR forced by the ERA-Interim reanalysis warmer by +1◦C over 2000–2016 and MAR forced by the unaltered ERA-Interim reanalysis over 1980–1999
MARera2k+1.5 Anomalies between MAR forced by the ERA-Interim reanalysis warmer by +1.5◦C over 2000–2016 and MAR forced by the unaltered ERA-Interim reanalysis over 1980–1999
MARera2k+2 Anomalies between MAR forced by the ERA-Interim reanalysis warmer by +2◦C over 2000–2016 and MAR forced by the unaltered ERA-Interim reanalysis over 1980–1999
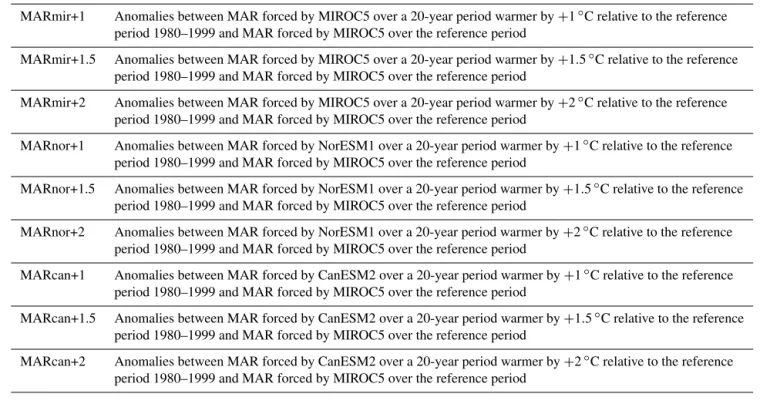
Table A2. Abbreviation description of GCM sensitivity experiments.
MARmir+1 Anomalies between MAR forced by MIROC5 over a 20-year period warmer by +1◦C relative to the reference period 1980–1999 and MAR forced by MIROC5 over the reference period
MARmir+1.5 Anomalies between MAR forced by MIROC5 over a 20-year period warmer by +1.5◦C relative to the reference period 1980–1999 and MAR forced by MIROC5 over the reference period
MARmir+2 Anomalies between MAR forced by MIROC5 over a 20-year period warmer by +2◦C relative to the reference period 1980–1999 and MAR forced by MIROC5 over the reference period
MARnor+1 Anomalies between MAR forced by NorESM1 over a 20-year period warmer by +1◦C relative to the reference period 1980–1999 and MAR forced by MIROC5 over the reference period
MARnor+1.5 Anomalies between MAR forced by NorESM1 over a 20-year period warmer by +1.5◦C relative to the reference period 1980–1999 and MAR forced by MIROC5 over the reference period
MARnor+2 Anomalies between MAR forced by NorESM1 over a 20-year period warmer by +2◦C relative to the reference period 1980–1999 and MAR forced by MIROC5 over the reference period
MARcan+1 Anomalies between MAR forced by CanESM2 over a 20-year period warmer by +1◦C relative to the reference period 1980–1999 and MAR forced by MIROC5 over the reference period
MARcan+1.5 Anomalies between MAR forced by CanESM2 over a 20-year period warmer by +1.5◦C relative to the reference period 1980–1999 and MAR forced by MIROC5 over the reference period
MARcan+2 Anomalies between MAR forced by CanESM2 over a 20-year period warmer by +2◦C relative to the reference period 1980–1999 and MAR forced by MIROC5 over the reference period
The Supplement related to this article is available online at: https://doi.org/10.5194/tc-12-3409-2018-supplement
Author contributions. AD and XF conceived the study. AD and XF performed the simulations. AD led the writing of the manuscript. AD, XF, CK and ChA discussed the results. All co-authors revised and contributed to the editing of the manuscript.
Competing interests. The authors declare that they have no conflict of interest.
Acknowledgements. Computational resources have been provided by the Consortium des Équipements de Calcul Intensif (CÉCI), funded by the Fonds de la Recherche Scientifique de Belgique (F.R.S.FNRS) under grant no. 2.5020.11 and the Tier-1 supercom-puter (Zenobe) of the Fédération Wallonie Bruxelles infrastructure funded by the Wallonia region under the grant agreement no. 1117545. Finally, we would like to thank the two anonymous reviewers for their constructive remarks that helped to improve the paper.
Edited by: Marco Tedesco
Reviewed by: two anonymous referees
References
Amory, C., Trouvilliez, A., Gallée, H., Favier, V., Naaim-Bouvet, F., Genthon, C., Agosta, C., Piard, L., and Bellot, H.: Compar-ison between observed and simulated aeolian snow mass fluxes in Adélie Land, East Antarctica, The Cryosphere, 9, 1373–1383, https://doi.org/10.5194/tc-9-1373-2015, 2015.
Belleflamme, A., Fettweis, X., Lang, C., and Erpicum, M.: Current and future atmospheric circulation at 500 hPa over Greenland simulated by the CMIP3 and CMIP5 global models, Clim. Dy-nam., 41, 2061–2080, https://doi.org/10.1007/s00382-012-1538-2, 2012.
Bennartz, R., Shupe, M. D., Turner, D. D., Walden, V. P., Steffen, K., Cox, C. J., Kulie, M. S., Miller, N. B., and Pettersen, C.: July 2012 Greenland melt extent enhanced by low-level liquid clouds, Nature, 496, 83–86, https://doi.org/10.1038/nature12002, 2013. Bonne, J. L., Steen-Larsen, H. C., Risi, C., Werner, M.,
Sode-mann, H., Lacour, J. L., Fettweis, X., Cesana, G., Delmotte, M., Cattani, O., Vallelonga, P., Kjær, H. A., Clerbaux, C., Sveinbjörnsdóttir, Á. E., and Masson-Delmotte, V.: The sum-mer 2012 Greenland heat wave: In situ and remote sensing ob-servations of water vapor isotopic composition during an atmo-spheric river event, J. Geophys. Res.-Atmos., 120, 2970–2989, https://doi.org/10.1002/2014JD022602, 2015.
Box, J. E., Bromwich, D. H., and Bai, L. S.: Greenland ice sheet surface massbalance 1991-2000: Application of Polar MM5 mesoscale model and in situ data, J. Geophys. Res., 109, D16105, https://doi.org/10.1029/2003JD004451, 2004.
Box, J. E., Fettweis, X., Stroeve, J. C., Tedesco, M., Hall, D. K., and Steffen, K.: Greenland ice sheet albedo feedback: thermo-dynamics and atmospheric drivers, The Cryosphere, 6, 821–839, https://doi.org/10.5194/tc-6-821-2012, 2012.
Dee, D. P., Uppala, S. M., Simmons, A. J., Berrisford, P., Poli, P., Kobayashi, S., Andrae, U., Balmaseda, M. A., Balsamo, G., Bauer, P., Bechtold, P., Beljaars, A. C., van de Berg, L., Bidlot, J., Bormann, N., Delsol, C., Dragani, R., Fuentes, M., Geer, A. J., Haimberger, L., Healy, S. B., Hersbach, H., Hólm, E. V., Isak-sen, L., Kållberg, P., Köhler, M., Matricardi, M., Mcnally, A. P., Monge-Sanz, B. M., Morcrette, J. J., Park, B. K., Peubey, C., de Rosnay, P., Tavolato, C., Thépaut, J. N., and Vitart, F.: The ERA-Interim reanalysis: Configuration and performance of the data assimilation system, Q. J. Roy. Meteor. Soc., 137, 553–597, https://doi.org/10.1002/qj.828, 2011.
Ettema, J., Van Den Broeke, M. R., Van Meijgaard, E., Van De Berg, W. J., Bamber, J. L., Box, J. E., and Bales, R. C.: Higher surface mass balance of the Greenland ice sheet revealed by high-resolution climate modeling, Geophys. Res. Lett., 36, 4–8, https://doi.org/10.1029/2009GL038110, 2009.
Fettweis, X., Tedesco, M., van den Broeke, M., and Ettema, J.: Melting trends over the Greenland ice sheet (1958–2009) from spaceborne microwave data and regional climate models, The Cryosphere, 5, 359–375, https://doi.org/10.5194/tc-5-359-2011, 2011.
Fettweis, X., Franco, B., Tedesco, M., van Angelen, J. H., Lenaerts, J. T. M., van den Broeke, M. R., and Gallée, H.: Estimating the Greenland ice sheet surface mass balance contribution to fu-ture sea level rise using the regional atmospheric climate model MAR, The Cryosphere, 7, 469–489, https://doi.org/10.5194/tc-7-469-2013, 2013a.
Fettweis, X., Hanna, E., Lang, C., Belleflamme, A., Erpicum, M., and Gallée, H.: Brief communication “Important role of the mid-tropospheric atmospheric circulation in the recent surface melt increase over the Greenland ice sheet”, The Cryosphere, 7, 241– 248, https://doi.org/10.5194/tc-7-241-2013, 2013b.
Fettweis, X., Box, J. E., Agosta, C., Amory, C., Kittel, C., Lang, C., van As, D., Machguth, H., and Gallée, H.: Reconstructions of the 1900–2015 Greenland ice sheet surface mass balance using the regional climate MAR model, The Cryosphere, 11, 1015–1033, https://doi.org/10.5194/tc-11-1015-2017, 2017.
Franco, B., Fettweis, X., and Erpicum, M.: Future projections of the Greenland ice sheet energy balance driving the surface melt, The Cryosphere, 7, 1–18, https://doi.org/10.5194/tc-7-1-2013, 2013. Gallée, H., Preunkert, S., Argentini, S., Frey, M. M., Genthon,
C., Jourdain, B., Pietroni, I., Casasanta, G., Barral, H., Vi-gnon, E., Amory, C., and Legrand, M.: Characterization of the boundary layer at Dome C (East Antarctica) during the OPALE summer campaign, Atmos. Chem. Phys., 15, 6225– 6236, https://doi.org/10.5194/acp-15-6225-2015, 2015. Hanna, E., Fettweis, X., Mernild, S. H., Cappelen, J., Ribergaard,
M. H., Shuman, C. A., Steffen, K., Wood, L., and Mote, T. L.: At-mospheric and oceanic climate forcing of the exceptional Green-land ice sheet surface melt in summer 2012, Int. J. Climatol., 34, 1022–1037, https://doi.org/10.1002/joc.3743, 2014.
Hanna, E., Fettweis, X., and Hall, R. J.: Recent changes in sum-mer Greenland blocking captured by none of the CMIP5 models, The Cryosphere Discuss., https://doi.org/10.5194/tc-2018-91, in review, 2018.
Hofer, S., Tedstone, A. J., Fettweis, X., and Bamber, J. L.: Decreasing cloud cover drives the recent mass loss on the Greenland Ice Sheet, Science Advances, 3, e1700584, https://doi.org/10.1126/sciadv.1700584, 2017.
Lang, C., Fettweis, X., and Erpicum, M.: Future climate and surface mass balance of Svalbard glaciers in an RCP8.5 climate scenario: a study with the regional climate model MAR forced by MIROC5, The Cryosphere, 9, 945–956, https://doi.org/10.5194/tc-9-945-2015, 2015.
Leeson, A. A., Eastoe, E., and Fettweis, X.: Extreme tem-perature events on Greenland in observations and the MAR regional climate model, The Cryosphere, 12, 1091–1102, https://doi.org/10.5194/tc-12-1091-2018, 2018.
Machguth, H., Macferrin, M., Van As, D., Box, J. E., Charalam-pidis, C., Colgan, W., Fausto, R. S., Meijer, H. A., Mosley-Thompson, E., and Van De Wal, R. S.: Greenland meltwater storage in firn limited by near-surface ice formation, Nat. Clim. Change, 6, 390–393, https://doi.org/10.1038/nclimate2899, 2016.
Moss, R., Edmonds, J. A., Hibbard, K. A., Manning, M. R., Rose, S. K., van Vuuren, D., Carter, T. R., Emori, S., Kainuma, M., Kram, T., Meehl, G. A., Mitchell, J. F. B., Nakicenovic, N., Ri-ahi, K., Smith, S. J., Stouffer, R. J.. Thomson, A. M., Weyant, J. P., and Wilbanks, T. J.: The next generation of scenarios for climate change research and assessment, Nature, 463, 747–756, https://doi.org/10.1038/nature08823, 2010.
Neff, W., Compo, G. P., Ralph, F. M., and Shupe, M. D.: Continen-tal heat anomalies and the extreme melting of the Greenland ice surface in 2012 and 1889, J. Geophys. Res.-Atmos., 119, 6520– 6536, https://doi.org/10.1002/2014JD021470, 2014.
Noël, B., Fettweis, X., van de Berg, W. J., van den Broeke, M. R., and Erpicum, M.: Sensitivity of Greenland Ice Sheet surface mass balance to perturbations in sea surface temperature and sea ice cover: a study with the regional climate model MAR, The Cryosphere, 8, 1871–1883, https://doi.org/10.5194/tc-8-1871-2014, 2014.
Noël, B., van de Berg, W. J., van Meijgaard, E., Kuipers Munneke, P., van de Wal, R. S. W., and van den Broeke, M. R.: Evalua-tion of the updated regional climate model RACMO2.3: summer snowfall impact on the Greenland Ice Sheet, The Cryosphere, 9, 1831–1844, https://doi.org/10.5194/tc-9-1831-2015, 2015.
Noël, B., van de Berg, W. J., van Wessem, J. M., van Meij-gaard, E., van As, D., Lenaerts, J. T. M., Lhermitte, S., Kuipers Munneke, P., Smeets, C. J. P. P., van Ulft, L. H., van de Wal, R. S. W., and van den Broeke, M. R.: Modelling the climate and surface mass balance of polar ice sheets using RACMO2 – Part 1: Greenland (1958–2016), The Cryosphere, 12, 811–831, https://doi.org/10.5194/tc-12-811-2018, 2018.
Rae, J. G. L., Aðalgeirsdóttir, G., Edwards, T. L., Fettweis, X., Gre-gory, J. M., Hewitt, H. T., Lowe, J. A., Lucas-Picher, P., Mottram, R. H., Payne, A. J., Ridley, J. K., Shannon, S. R., van de Berg, W. J., van de Wal, R. S. W., and van den Broeke, M. R.: Greenland ice sheet surface mass balance: evaluating simulations and mak-ing projections with regional climate models, The Cryosphere, 6, 1275–1294, https://doi.org/10.5194/tc-6-1275-2012, 2012. Taylor, K. E., Stouffer, R. J., and Meehl, G. A.: An overview of
CMIP5 and the experiment design, B. Am. Meteorol. Soc., 93, 485–498, https://doi.org/10.1175/BAMS-D-11-00094.1, 2012. Tedesco, M., Fettweis, X., Mote, T., Wahr, J., Alexander, P.,
Box, J. E., and Wouters, B.: Evidence and analysis of 2012 Greenland records from spaceborne observations, a regional cli-mate model and reanalysis data, The Cryosphere, 7, 615–630, https://doi.org/10.5194/tc-7-615-2013, 2013.
Tedesco, M., Doherty, S., Fettweis, X., Alexander, P., Jeyaratnam, J., and Stroeve, J.: The darkening of the Greenland ice sheet: trends, drivers, and projections (1981–2100), The Cryosphere, 10, 477–496, https://doi.org/10.5194/tc-10-477-2016, 2016. Van Angelen, J. H., Lenaerts, J. T. M., Van Den Broeke, M. R.,
Fet-tweis, X., and Van Meijgaard, E.: Rapid loss of firn pore space ac-celerates 21st century Greenland mass loss, Geophys. Res. Lett., 40, 2109–2113, https://doi.org/10.1002/grl.50490, 2013. van den Broeke, M. R., Enderlin, E. M., Howat, I. M., Kuipers
Munneke, P., Noël, B. P. Y., van de Berg, W. J., van Meijgaard, E., and Wouters, B.: On the recent contribution of the Greenland ice sheet to sea level change, The Cryosphere, 10, 1933–1946, https://doi.org/10.5194/tc-10-1933-2016, 2016.
Van Tricht, K., Lhermitte, S., Lenaerts, J. T. M., Gorodetskaya, I. V., L’Ecuyer, T. S., Noël, B., van den Broeke, M. R., Turner, D. D., and van Lipzig, N. P. M.: Clouds enhance Green-land ice sheet meltwater runoff, Nat. Commun., 7, 10266, https://doi.org/10.1038/ncomms10266, 2016.