D. Valkeners, A. Théwis, S. Amant and Y. Beckers
Belgian Blue bulls fed a corn silage-based diet
on microbial protein synthesis and nitrogen metabolism in growing double-muscled
Effect of various levels of imbalance between energy and nitrogen release in the rumen
2006. 84:877-885.
J Anim Sci
http://jas.fass.org/cgi/content/full/84/4/877
the World Wide Web at:
The online version of this article, along with updated information and services, is located on
Effect of various levels of imbalance between energy and nitrogen release
in the rumen on microbial protein synthesis and nitrogen metabolism
in growing double-muscled Belgian Blue bulls fed a corn silage-based diet
1D. Valkeners,
2A. The´wis, S. Amant, and Y. Beckers
3Faculte´ universitaire des Sciences agronomiques, Passage des De´porte´s, 2 B-5030 Gembloux, Belgium
ABSTRACT: Seven double-muscled Belgian Blue bulls (initial BW: 341 ± 21 kg) with cannulas in the rumen and proximal duodenum were used in an incom-plete replicated Latin square. The study examined the effect of imbalance between energy and N in the rumen on microbial protein synthesis and N metabolism by giving the same diet according to 3 different feeding patterns. The feed ingredients of the diet were sepa-rated into 2 groups supplying the same amount of fer-mentable OM (FOM) but characterized by different lev-els of ruminally degradable N (RDN). The first group primarily provided energy for the ruminal microbes (12.5 g of RDN/kg of FOM), whereas the second provided greater N (33.3 g of RDN/kg of FOM). These 2 groups were fed to the bulls in different combinations with the aim of creating 3 levels of imbalance (0, 20, and 40 g/ kg of DM) between energy and N supplies in the rumen. Imbalance was measured by the variation of the degrad-able protein balance (OEB value in the Dutch system) of the diet between the 2 meals each a day. Diurnal variations in ruminal NH3-N concentrations and
plasma urea concentrations were greatly influenced by the feeding patterns of the diet. Introduction of
imbal-Key words: energy, imbalance, nitrogen, nitrogen balance, rumen fermentation
2006 American Society of Animal Science. All rights reserved. J. Anim. Sci. 2006. 84:877–885
INTRODUCTION
Recent efforts to enhance productive performance of ruminants through synchronization of carbohydrate
1The research was sponsored by the Fonds pour la Formation a`
la Recherche dans l’Industrie et dans l’Agriculture (FRIA), Brussels, Belgium. The authors express their sincere thanks to C. Leirens for her assistance with sample collection and analysis associated with this project, and to J. Moreman for help with the preparation of the manuscript.
2Current address: Agriculture and Agri-Food Canada, Lennoxville,
QC, J1M 1Z3, Canada.
3Corresponding author: beckers.y@fsagx.ac.be
Received July 15, 2005. Accepted November 18, 2005.
877
ance affected neither microbial N flow at the duodenum (P = 0.97) nor efficiency of growth (P = 0.54). The feeding patterns of the diet had no negative impact on NDF degradation in the rumen (P = 0.33). Nitrogen retention was not affected by imbalance (P = 0.74) and reached 49.7, 52.0, and 51.3 g/d, respectively for 0, 20, and 40 g of OEB/kg of DM imbalance. It seems that introduc-tion of an imbalance between energy and N supplies for the ruminal microbes by altering the feeding pattern of the same diet does not negatively influence the micro-bial activity in the rumen nor N retention of the animal. Nitrogen recycling in the rumen plays a major role in regulating the amount of ruminally available N and allows a continuous synchronization of N and energy-yielding substrates for the microorganisms in the ru-men. Therefore, imbalance between dietary energy and N created over a 24-h interval was not detrimental to rumen microbial growth for the animal as long as the level of imbalance did not exceed 40 g of OEB/kg of DM. Thus, these feeding patterns of the diet can be used under practical feeding conditions with minimal impact on the performance of ruminant animals for meat pro-duction.
and N to improve fermentation in the rumen did not result in detectable benefits for the animals (Richard-son et al., 2003). Furthermore, the introduction of a 12-or 24-h imbalance between N and energy supplies in the rumen did not negatively influence microbial protein synthesis nor N use in sheep (Ludden et al., 2002a,b) or growing bulls (Valkeners et al., 2004). Both the ruminal microbes and their host animal possess the means to compensate for variations in kinetics of feed degrada-tion to ensure a relatively continuous supply of nutri-ents to places of biosynthesis to optimize microbial growth (Dawson, 1999).
The movements of N across the gut play a major role in regulating the amount of ruminally available N, and provide overall plasticity to allow a rapid response to any changes in metabolic status (Lapierre and Lobley,
2001). During periods of N excess in the rumen, NH3
is absorbed in portal blood circulation and detoxified to urea by the liver. This N may then be recycled back to the rumen during subsequent periods of N shortage. Nevertheless, N recycling probably has limitations de-pendent on the time and the level of the imbalance created between energy and N release in the rumen and cannot totally buffer important temporary N excess. The objective of the current study was to examine the effect of the level of imbalance between energy and N release in the rumen on digestion and N metabolism of double-muscled Belgian Blue bulls. This was achieved by feeding the same diet according to different feeding patterns, because it has been suggested that differences due to imbalance may be attributed to some factors associated with the manipulation of the level or type of ingredients (Dewhurst et al., 2000). Therefore, increasing levels of imbalance between ruminal sup-plies of energy and N were tested.
MATERIALS AND METHODS
Animals
Seven double-muscled Belgian Blue bulls (initial BW = 341± 21 kg; final BW = 480 ± 32 kg), fitted with a ruminal cannula (67 mm i.d.) and a T-type cannula at the proximal duodenum, were individually penned (1.5× 2.5 m). Fresh water was available at all times. The experimental protocol was approved by the Gembloux Agricultural University Animal Care and Use Commit-tee, and followed the guidelines issued by the committee on care, handling, and sampling of the animals.
Diet and Feeding Management
Bulls received the same diet according to 3 different feeding patterns at an intake level of 76 g of DM/kg0.75.
Offering feed at this level was roughly 97.5% of ad libitum consumption (Fiems et al., 1999). Adaptation to the diet lasted 20 d. Feed was offered twice a day in equal amounts at 0830 and 2030. The diet was made up of 53% concentrate and 47% corn silage on a DM basis. The diet supplied 83 g of intestinal digestible proteins (DVE) and 7.5 MJ of NE for fattening (NEF) per kg of DM according to the Dutch system (Van Es and Van der Honing, 1977; Tamminga et al., 1994). The degradable protein balance (OEB value in the Dutch system) of the diet amounted to 0.4 g/kg of DM and was close to zero, which corresponded to the optimum OEB value according to the Dutch system. This OEB value is equivalent to a ratio between ruminally degradable N (RDN) and fermentable OM (FOM) of 24 g/kg, which is close to the optimal ratio of 25 g of N/kg of OM truly digested in the rumen proposed by Czerwaski (1986). The OEB value estimates the (im)balance between ru-minal degradable CP and energy extracted during an-aerobic fermentation in the rumen for microbial protein synthesis (Tamminga et al., 1994). When the OEB value
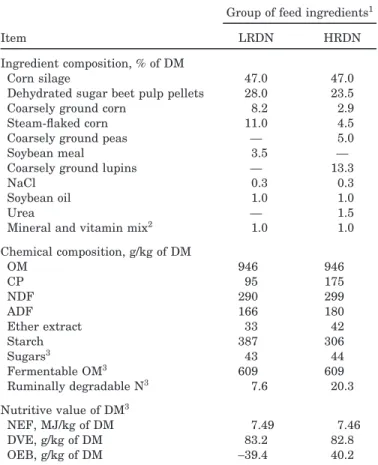
Table 1.Ingredient and chemical composition and nutri-tive value of the 2 groups of feed ingredients
Group of feed ingredients1
Item LRDN HRDN
Ingredient composition, % of DM
Corn silage 47.0 47.0
Dehydrated sugar beet pulp pellets 28.0 23.5
Coarsely ground corn 8.2 2.9
Steam-flaked corn 11.0 4.5
Coarsely ground peas — 5.0
Soybean meal 3.5 —
Coarsely ground lupins — 13.3
NaCl 0.3 0.3
Soybean oil 1.0 1.0
Urea — 1.5
Mineral and vitamin mix2 1.0 1.0
Chemical composition, g/kg of DM OM 946 946 CP 95 175 NDF 290 299 ADF 166 180 Ether extract 33 42 Starch 387 306 Sugars3 43 44 Fermentable OM3 609 609 Ruminally degradable N3 7.6 20.3 Nutritive value of DM3 NEF, MJ/kg of DM 7.49 7.46 DVE, g/kg of DM 83.2 82.8 OEB, g/kg of DM −39.4 40.2
1LRDN = part of the feed ingredients of the experimental diet
theoretically deficient in ruminally available N according to the Dutch system; HRDN = part of the feed ingredients of the experimental diet theoretically providing ruminally available N in excess according to the Dutch system.
2Formulated to provide the following per kilogram of total diet DM:
1.2 g of Ca, 0.8 g of P, 0.4 g of Na, 0.35 g of Mg, 0.5 mg of I, 0.5 mg of Co, 1.5 mg of vitamin E, 60g of Fe, 10 g of Cu, 30 g of Mn, 60g of Zn, 0.2 g of Se, 6,000 IU of vitamin A, and 1,200 IU of vitamin D3.
3Values derived from the Dutch nutritional tables (CVB, 2000).
NEF = net energy for fattening, calculated according to the Dutch system (Van Es and Van der Honing, 1977); DVE = intestinal digest-ible proteins (Tamminga et al., 1994); OEB: degradable protein bal-ance (Tamminga et al., 1994).
is positive for a diet, potential loss of N from the rumen occurs, whereas a negative value means a shortage of ruminally degradable N with a consequent impaired microbial activity.
The feed ingredients of the diet were separated in 2 groups supplying the same amounts of DVE, NEF, and FOM, but with different amount of RDN. Ingredient composition, actual chemical composition, and tabular nutritive value (CVB, 2000) of the 2 groups of feeds are presented in Table 1. No forage was fed separately. The first group (HRDN) provided all the major protein sources (coarsely ground peas, coarsely ground lupins, and urea) of the experimental diet, with a tabular OEB value of 40.2 g/kg of DM, which corresponded to an RDN:FOM ratio of 33.3 g/kg. This part of the diet sup-plied RDN in excess in comparison with the available FOM to the ruminal microbes. The second group
Energy–nitrogen imbalance in the rumen 879
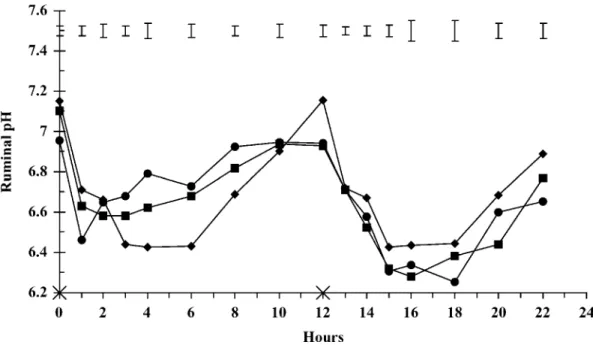
Figure 1. Ruminal pH in bulls fed the same diet but offered in 3 feeding patterns to induce different levels of imbalance between energy and nitrogen supplies for ruminal microbes measured by the variation of the degradable protein balance (OEB) between the 2 meals of a day, with 0 (◆), 20 (䊏), or 40 (䊉) g of OEB/kg of DM. Feeding times are indicated on the x-axis by×. Error bars indicate SEM for n = 6.
(LRDN) was characterized by an OEB value of−39.4 g/kg of DM, which corresponded to an RDN:FOM ratio of 12.5 g/kg. According to the Dutch system, this part of the diet had a low RDN content relative to the avail-able FOM.
The diet was fed to the bulls according to 3 different feeding patterns so that 3 levels of imbalance between energy and N supplies for the ruminal microbes were created. The level of imbalance is measured by the vari-ation of the OEB value between the 2 meals of a day while, on a daily basis, the OEB value was close to zero. The first feeding pattern of the diet (L0) consisted of LRDN and HRDN in equal amounts at each meal. Therefore, the energy and N-yielding substrates to the ruminal microorganisms were considered balanced be-cause the OEB value was close to zero at each meal. The second pattern (L20) consisted of feeding LRDN and HRDN at a ratio of 3:1 in the morning and 1:3 in the evening. The RDN:FOM ratios averaged 17.7 and 28.1 g/kg. With this second feeding pattern, an imbal-ance between the energy and N supplies for the ruminal microbes of an OEB variation of 20 g/kg of DM was created experimentally. However, the OEB value per day was close to zero because the same feed ingredients were ingested on a 24-h basis. The last feeding pattern (L40) consisted of increasing the level of imbalance to an OEB variation of 40 g/kg of DM by feeding alter-nately LRDN at the morning meal and HRDN at the evening meal. On a 24-h basis, the OEB value was close to zero because the same amounts of LRDN and HRDN were ingested compared with L0 and L20.
Digestibility was measured using Cr2O3as an
indi-gestible flow marker. From 5 d before sample collection
and continually thereafter, 3.5 g of Cr2O3/kg of DMI
was administered to each bull twice daily (just before each meal) intraruminally via gelatin capsules (Milton et al., 1997). Bulls were weighed at the beginning of each treatment period before the 0830 feeding and feed offered was adjusted to the metabolic weight of each animal and fixed during the period.
Experimental Protocol and Sample Collection
The 7 bulls were allocated to 3 treatment periods in an incomplete replicated Latin square, separated by a 20-d rest period. Each treatment period lasted 18 d and included collection of digesta (duodenal and fecal), urine, blood, and ruminal fluid. Refusals were collected daily before the morning feeding, weighed, and dried at 60°C. Samples of each group of feed ingredients were obtained each time LRDN and HRDN were mixed, ground to pass a 1-mm screen (Cyclotec 1.093, Foss Tecator AB, Ho¨gana¨s, Sweden), and pooled by period on an equal weight basis.
Urine was collected during the first 10 d of each treat-ment period with an adaptation of the apparatus of Veenhuizen et al. (1984). During collection, urine was acidified with 4 N H2SO4to pH 3 at 0900, 1700, and
2100 to avoid N losses. Total urine collection was weighed daily at 0900, sampled, and frozen at−20°C. The majority of the fecal output was collected simulta-neously into containers placed underneath each animal, sampled daily at 0830, and frozen at−20°C.
Samples of duodenal digesta were collected on d 11 to 13 to cover a 24-h period in 1.5-h steps. After removal of the cap of the duodenal cannula, accumulated digesta
were discarded, and when the flow seemed normal, 400 mL of duodenal contents was collected. For each collec-tion, a 100-g sample of duodenal contents was immedi-ately used to extract liquid-associated bacteria ac-cording to the method described by Poncet and Re´mond (2002). Moreover, the solid-adherent bacteria were ex-tracted according to the method developed by Legay-Carmier and Bauchart (1989) for rumen samples. The remainder of each duodenal sample was frozen at −20°C.
On d 14, central venous catheters (polyurethane ali-phatic, No. 67262J17, Plastimed, Le Plessis Bouchard, France) were inserted into one of the external jugular veins of each bull after an intravenous injection of anal-gesic (xylazine 2%, 0.08 mL/100 kg of BW). On d 15, blood samples (20 mL) were slowly collected into 2 hepa-rinized (143 IU/10 mL) tubes every 2 h for 24 h. On the last 3 d of each treatment period, rumen digesta were sampled 0, 1, 2, 3, 4, 6, 8, and 10 h after each meal to cover a 24-h period.
Laboratory Analyses
Concentrate, corn silage, and feed refusals pooled per animal at each treatment period were ground to pass a 1-mm screen (Cyclotec 1.093, Foss Tecator AB) before DM, OM, ether extract, Kjeldahl N (AOAC, 1990), NDF, and ADF (Van Soest et al., 1991) analyses were con-ducted. The NDF was determined without use of so-dium sulfite but with the addition of heat-stable amy-lase (Thermamyl 120, NOVO Nordisk, Bagsvaerd, Den-mark) for the last 30 min of boiling. A small part of these samples was ground to pass a 0.5-mm screen for starch determination (Faisant et al., 1995). After freeze-drying and grinding (1 mm), DM, OM, N, NDF, and Cr2O3 (Franc¸ois et al., 1978) were measured in feces
pooled per animal and per period. Urinary N was also analyzed (AOAC, 1990).
Blood was centrifuged at 1,200× g for 15 min immedi-ately after sampling. Plasma was removed and frozen at−20°C until further analyses. After thawing, plasma urea N (PUN) was analyzed using the coupled urea-glutamate dehydrogenase enzyme system (Talke and Schubert, 1965). This analysis was automated by using a Vitalab 200 and 200R (Vital Scientific NV, AC Dieren, The Netherlands).
The pH of ruminal fluid was measured (Microproces-sor pH-meter, pH 320/SET, WTW, Weilheim, Germany) immediately after sampling and filtration (250 m). Supernatant from 1,200× g centrifugation for 12 min was frozen at−20°C after H2SO4acidification to pH 3
until NH3-N determination. The NH3-N concentration
was determined by steam distillation with MgO using a 2,300 Kjeltec Analyser Unit (Foss Tecator AB).
Duodenal samples were freeze-dried, ground to pass a 1-mm screen, and pooled per animal and period before DM, OM, N, NH3-N, NDF, and Cr2O3determinations
on the whole digesta. A small part was ground to pass a 0.5-mm screen for starch and purine determinations.
Purine content was measured following the method of Zinn and Owens (1986) adapted for hydrolysis of nucleo-tides by perchloric acid (Makkar and Becker, 1999), and for wash solution used for washing the precipitate of free purines with silver nitrate (Obispo and Dehority, 1999). Duodenal bacteria samples were freeze-dried, ground with a coffee grinder, and pooled per animal and period before N, OM, and purine content determi-nations.
Calculations and Statistical Analyses
Nutrient flows at the duodenum and fecal output were calculated by reference to Cr2O3. The proportion
of microbial N flowing at the duodenum was calculated by dividing the duodenal purine:N ratio by the corres-ponding purine:N ratio in duodenal microbes. An endog-enous N flow of 2.98 g/kg of OM to duodenum (Kim et al., 2001) was applied for the fractionation of the estimated duodenal nonmicrobial N into endogenous and undegraded dietary N.
Statistical analyses on N balance, total tract and ru-minal digestibility, and microbial protein synthesis were conducted using the GLM procedure of SAS (SAS Inst. Inc., Cary, NC). Data were analyzed by ANOVA for an incomplete replicated Latin square design. Model sums of squares were separated into bull, period, and treatment. Least squares means were separated into significant main effects by the PDIFF option of SAS. Because of animal illness, the last experimental period could not be completed and the statistical analysis was done with missing values in place of the actual data. Therefore, the SEM for n = 6 are presented. For data collected over time within each sampling period (rumi-nal pH, rumi(rumi-nal NH3-N concentration, and PUN), a
repeated-measures analysis was performed using the REPEATED statement within the GLM procedure of SAS. Effects in the model included bull, period, treat-ment, time, and treatment × time interaction. When treatment × time interactions were significant, vari-ables were analyzed within time periods. Differences among treatments were considered significant when P < 0.05, whereas when P > 0.05 but P < 0.10, differences were considered to indicate a trend toward a signifi-cant effect.
RESULTS
Ruminal Fermentation Characteristics
and Plasma Urea N
A level of imbalance × time interaction (P < 0.001) was observed in ruminal pH (Figure 1). However, this interaction was largely due to differences in ruminal pH at specific time points and probably not biologically significant, because a pH of 6.2 is generally considered the pH threshold below which the growth of fiber-utiliz-ing microbes and digestibility of fiber and OM are de-creased (Pitt et al., 1996).
Energy–nitrogen imbalance in the rumen 881
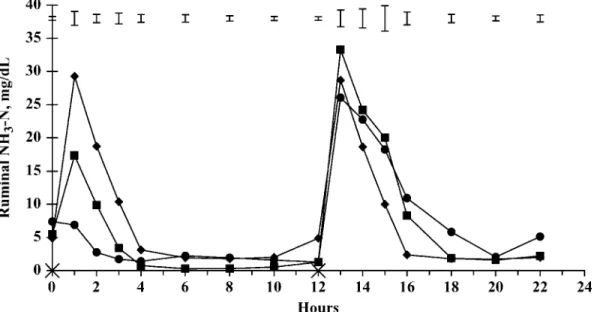
Figure 2. Ruminal NH3-N concentrations in bulls fed the same diet but offered in 3 feeding patterns to induce
different levels of imbalance between energy and nitrogen supplies for ruminal microbes measured by the variation of the degradable protein balance (OEB) between the 2 meals of a day, with 0 (◆), 20 (䊏), or 40 (䊉) g of OEB/kg of DM. Feeding times are indicated on the x-axis by×. Error bars indicate SEM for n = 6.
There was an effect of time and interaction between time and level of imbalance (P< 0.001) on ruminal NH3
-N (Figure 2). The temporal pattern of ruminal -NH3-N
was similar, but peak concentrations during the day were influenced by the pattern of feeding the diet and the nature of the group of feed ingredients ingested. At 1, 2, and 3 h after the morning meal, ruminal NH3-N
levels were significantly different among the levels of imbalance. Ruminal NH3-N concentrations were lower when the proportion of LRDN in the meal was high. At 4 h after the evening meal, ruminal NH3-N measured
in animals on L0 were lower (P = 0.03) than those on L20 and L40. Ruminal NH3-N concentrations were
greater when the proportion of HRDN in the meal was high. Daily mean concentrations of ruminal NH3-N
were not different among the treatments (P = 0.456) and amounted to 6.91, 6.31, and 6.04 mg/dL, respectively for L0, L20, and L40.
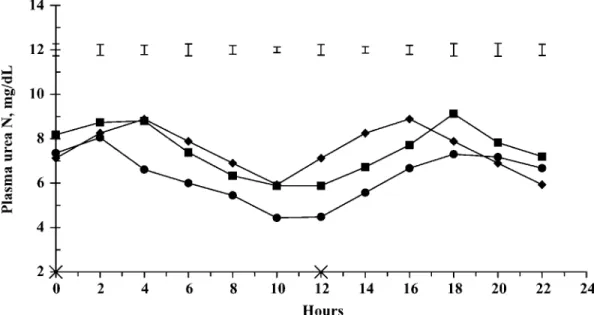
There were a time effect and level of imbalance × time interaction (P< 0.001) on PUN (Figure 3). At 4, 10, and 12 h after the morning meal, PUN measured on animals on L40 were significantly lower (P< 0.01) than those measured on L0 and L20, whereas at 14 and 16 h, bulls on the L20 and L40 feeding patterns had lower (P < 0.05) PUN than those on the L0 feeding pattern. The hourly evolution of PUN was influenced by the nature of the group of feed ingredients ingested. Daily mean concentrations of PUN tended to be influ-enced (P = 0.086) by the feeding pattern of the diet. The daily PUN in bulls fed the diet according to the feeding pattern L40 was lower (6.2 vs. 7.5 mg/dL) than those obtained in bulls fed the diet according to the feeding patterns L0 and L20.
Intake and Digestibility
Intakes of OM, NDF, and starch were not different among treatments (Table 2). Total tract digestibility of OM and NDF were greater (P< 0.048 to 0.049) in bulls on L40 compared with those on L0, with L20 being intermediate (Table 2). Ruminal digestibility of OM, NDF, and starch were not influenced by the feeding patterns. The ratio of ruminal:total tract digestibility of NDF were high and not significantly different be-tween the feeding patterns. The feeding patterns of the diet did not affect intake or digestibility of N (Table 3). Moreover, apparent ruminal digestibility of N may be considered equal to zero according to a conformity test of the mean (tobserved< t0.975).
Flow of Nitrogenous Components
at the Duodenum
Level of imbalance between energy and N supplies for the ruminal microbes had no effect on NH3-N,
non-NH3-N, and microbial N flows at the duodenum (Table
3). Efficiencies of microbial protein synthesis reached 29.2, 25.8, and 24.6 g of N/kg of OM apparently digested in the rumen and 21.1, 19.4, and 18.6 g of N/kg of OM truly digested in the rumen, respectively for L0, L20, and L40, and were not significantly affected by the level of imbalance.
Nitrogen Balance
Fecal and urinary outputs of N, as well as absolute and relative amounts of N retained did not differ sig-nificantly due the feeding pattern (Table 3).
Figure 3.Plasma urea N in bulls fed the same diet but offered in 3 feeding patterns to induce different time periods of imbalance between energy and nitrogen supplies for ruminal microbes measured by the variation of the degradable protein balance (OEB) between the 2 meals of a day, with 0 (◆), 20 (䊏), or 40 (䊉) g of OEB/kg of DM. Feeding times are indicated on the x-axis by×. Error bars indicate SEM for n = 6.
DISCUSSION
According to the Dutch system (Tamminga et al., 1994), the feeding pattern L0 reaches the target of a good balance of energy and N release for the microor-ganisms in the rumen. In practice, because the appar-ent ruminal digestibility of N (−9.3%) may be considered equal to zero, the amount of feed N degraded in the rumen was roughly equal to the amount used by the microorganisms. Thus, the recycling of urea N in the rumen balanced the amount of ruminal NH3absorbed
through the rumen wall and transferred to the blood.
Table 2.Least squares means for intake, and ruminal and total tract digestibility measured in bulls fed the same diet but offered in 3 feeding patterns to induce different levels of imbalance between energy and N supplies for ruminal microbes1
Feeding pattern
Item L0 L20 L40 SEM P-value
OM
Intake, g/d 6,095 6,149 6,051 47.0 0.384
Apparent ruminal digestibility, % 42.6 46.7 49.7 2.3 0.845
True ruminal digestibility, % 57.8 61.2 64.9 2.1 0.063
Apparent total tract digestibility, % 72.2a 73.4ab 74.0b 0.4 0.049
NDF
Intake, g/d 1,874 1,891 1,863 15.0 0.422
Ruminal digestibility, % 54.2 55.7 59.5 2.3 0.332
Total tract digestibility, % 60.7a 62.5ab 63.7b 0.6 0.048
Ruminal:total tract digestibility ratio, % 89.3 89.7 94.4 3.2 0.510 Starch
Intake, g/d 1,559 1,578 1,542 14.0 0.261
Ruminal digestibility, % 50.0 54.7 58.6 4.0 0.423
a,bWithin a row, least squares means without a common superscript letter differ, P< 0.05.
1As measured by the variation of the degradable protein balance (OEB) between the 2 meals of a day,
with 0 (L0), 20 (L20), or 40 (L40) g of OEB/kg of DM.
The total tract and ruminal digestibility of OM and NDF measured with L0 were consistent with those gen-erally measured on double-muscled Belgian Blue bulls (Fiems et al., 1997; Valkeners et al., 2004). The theoreti-cal ruminal N degradability (in sacco values), estimated from the Dutch tabular values (CVB, 2000) averaged 50.2 and 72.4%, respectively, for LRDN and HRDN. For the feeding pattern L0, the estimated in sacco rumi-nal N degradability was 64.5%, which was close to the true ruminal digestibility of N measured with L0 (59.6%). Efficiency of microbial protein synthesis ob-tained with L0 (29.2 g of microbial N/kg of OM
appar-Energy–nitrogen imbalance in the rumen 883 Table 3.Least squares means for intake, ruminal and total tract digestibility, and balance
of nitrogen in bulls fed the same diet but offered in 3 feeding patterns to induce different levels of imbalance between energy and N supplies for ruminal microbes1
Feeding pattern1
Item L0 L20 L40 SEM P-value
N intake, g/d 140.1 141.5 138.9 1.3 0.398 Duodenal flow, g/d Total N 153.4 148.1 144.3 4.5 0.414 NH3-N 4.9 4.3 4.3 0.3 0.322 Non-NH3-N 148.5 143.8 140.0 4.4 0.437 Microbial N 73.5 72.1 72.5 3.9 0.972 Endogenous N2 17.9 18.3 17.8 0.3 0.267 Undegraded N 56.9 53.4 49.7 4.5 0.579
Apparent ruminal digestibility, % −9.3 −4.6 −3.9 3.8 0.639
True ruminal digestibility, % 59.6 62.3 64.4 3.6 0.702
Apparent total tract digestibility, % 65.0 66.5 66.4 0.5 0.165
Fecal N, g/d 49.1 47.4 46.6 0.7 0.111 Urinary N, g/d 41.3 42.2 41.1 1.3 0.820 Retained N g/d 49.7 52.0 51.3 1.9 0.740 % of ingested N 35.7 36.8 36.8 1.2 0.802 % of digested N 54.8 55.5 55.4 1.6 0.966
1As measured by the variation of the degradable protein balance (OEB) between the 2 meals of a day,
with 0 (L0), 20 (L20), or 40 (L40) g of OEB/kg of DM.
2Endogenous-N flow to duodenum; calculated assuming 2.98 g of N/kg of OM intake (Kim et al., 2001).
ently digested in the rumen) is in agreement with the average value of 24 g of microbial N/kg of OM appar-ently digested in the rumen adopted for all diets by the Dutch system (Tamminga et al., 1994). From these results, it seems that the feeding pattern L0 created appropriate conditions in the rumen for the microorgan-isms and their activities. The N retention obtained dur-ing this experiment with L0 (49.7 g of N/d) was indica-tive of the ability of the double-muscled Belgian Blue bulls to grow rapidly (Hornick et al., 1998; Froidmont et al., 2000). Assuming 20.6% of CP in the gain (De Campeneere et al., 2001), N retention observed with L0 corresponded to an ADG of 1.51 kg/d., which is near the average ADG of 1.29 kg/d observed with the bulls on the whole experiment. The use of the N digested by L0 was high and attested that the supplies of NE for fattening and DVE were well balanced.
Over a 24-h period, no significant differences were observed between L20 and L40 average concentrations of ruminal NH3-N compared with L0, although diurnal
variation for this response was important. With L20 and L40, a succession of periods of excess or deficiency in N supply for the microorganisms was created. The group LRDN had a low CP content (95 g/kg of DM) and a theoretically low ruminal degradability of N (50.2%). The ingestion of LRDN at the morning meal by bulls fed L40 did not induce a postfeeding increase of ruminal NH3-N concentration and led to a prolonged period (11
h over the 12 h after the morning meal; Figure 2) during which ruminal NH3-N was below the concentration (5
mg/dL) generally considered as the minimum required for optimal microorganism growth in the rumen (Satter and Slyter, 1974). The average ruminal NH3-N
concen-tration over the 12 h after LRDN feeding amounted to 2.8 mg/dL, and concentrations of PUN decreased from 8.1 to 4.4 mg/dL (Figure 3), probably indicating N trans-fer from the blood into the rumen. In contrast, the group HRDN had a high CP content (175 g/kg of DM) and contained feedstuffs with high ruminal N degradability. Ingestion of L40 (evening meal) led to a large production of NH3in the rumen. Average ruminal NH3-N
concen-tration over the 12 h after HRDN feeding was 9.2 mg/ dL. It was very likely that large amounts of NH3were
lost from the rumen fluid by absorption through the rumen wall and transferred by portal blood to the liver to produce urea because PUN increased for 12 h after HRDN ingestion. With L20, the groups LRDN and HRDN were fed in different combinations (3:1 and 1:3, respectively, for 0830 and 2030 feedings), which led to intermediate ruminal NH3-N and PUN evolutions.
Although each animal received the same diet on a 24-h basis, t24-he feeding pattern of t24-he diet and t24-he nature of the meal ingested had a large influence on the diurnal evolution of the ruminal NH3-N concentration during
this period. Ruminal bacteria require NH3for microbial
growth and activity. Low ruminal NH3has the potential
to inhibit microbial activity and decrease rate of fiber di-gestion.
Intake was not affected by the feeding patterns. Aver-age DMI was 73.2 g of DM/kg0.75and was near ad libi-tum, which is comparable to voluntary DMI of 78.2 g of DM/kg0.75reported by Fiems et al. (1999) for double-muscled Belgian Blue bulls fed a corn silage-based diet. Total tract digestibility of OM and NDF were not nega-tively influenced by the introduction of an imbalance between energy and N supplies for ruminal microbes
and were surprisingly greater (P = 0.049 and P = 0.048, respectively, for OM and NDF) for L40 than L0. The ruminal digestibility of OM, NDF, and starch were not found to differ among treatments. Across all treat-ments, the NDF ruminal:total tract digestibility ratios were high (Table 2) and not influenced by the level of imbalance. The fiber degradation activities of the ruminal microbes were not affected by the perturba-tions experimentally created in terms of energy and N supplies for the ruminal microbes when an imbalance of 20 or 40 g of OEB/kg of DM was induced. Although the periods of low ruminal NH3-N concentration were
longer after the L20 and L40 morning feeding than after the L0 morning meal, it seemed that the N supplies in the rumen for the cellulolytic bacteria and the nonstruc-tural carbohydrate-fermenting bacteria were satisfied even if the diet was fed with a level of imbalance of 20 or 40 g of OEB/kg of DM. Russell and Strobel (1987) found that in in vitro studies, NH3could be transported
into microbes, reaching high intracellular NH3
concen-trations despite the fact that the NH3-N concentration
used in the media was very close to zero. This mecha-nism of active NH3transport is likely to be present in vivo, allowing ruminal cellulolytic microbes to obtain NH3 from the medium at low ruminal NH3
concen-tration.
Level of imbalance had no significant effect on non-NH3and microbial N flows at the duodenum. The
effi-ciency of microbial protein synthesis obtained with L20 and L40 were not significantly different compared with L0. The in vitro studies of Newbold and Rust (1992) and the in vivo studies of Henning et al. (1993), Sinclair et al. (1993, 1995), and Richardson et al. (2003) with sheep have focused on the synchronization of ruminal N and energy to prevent periods of N deficiency during the day. According to their results, there is some dis-agreement as to whether synchronizing dietary energy and N supply to the rumen improves microbial protein growth. Newbold and Rust (1992), Henning et al. (1993), and Richardson et al. (2003) found no effect of dietary synchrony on microbial growth either in vitro or in vivo. However, Sinclair et al. (1993, 1995) have found microbial growth rates or efficiency to be im-proved by dietary synchrony. In the current experi-ment, there was no significant effect on the microbial protein synthesis when a 12-h imbalance of a daily OEB variation of 20 or 40 g of OEB/kg of DM was created. This lack of response to an increased level of imbalance between energy and N supplies for the ruminal mi-crobes is in agreement with results obtained in a previ-ous study (Valkeners et al., 2004), which demonstrated that a lack of imbalance in the diet between the energy and N supplies for ruminal microbes was not detrimen-tal to their growth as long as nutrient supply was bal-anced on a 48-h basis and the level of imbalance did not exceed 30 g of OEB/kg of DM.
Because N retention obtained with L20 and L40 did not differ from L0, it seemed that animal growth was not affected by a lack of synchrony. The total tract N
digestibility was not influenced by the feeding patterns. Feeding the diet with an imbalance of 20 or 40 g of OEB/kg of DM had no significant impact on use of N digested by the animal and therefore, the overall bal-ance of nutrients for the tissues was not modified by the imbalance of nutrients for the rumen.
A large extent of NH3-N excess in the rumen may be
excreted as urea in the urine by growing ruminants (Dehareng and Ndibualonji, 1994). In this experiment, urinary excretion of N was not affected by the feeding patterns. Our results tended to show that the tempo-rary excess of ruminal degradable N created after inges-tion of the evening meal by L20 and L40 were not lost in urine by the bulls but could return in the rumen during temporary N shortages. The ruminal recycling of urea helps the animal and its ruminal microbes to overcome a deficiency in N supply and could minimize the effect of a lack of synchronization between energy and N supplies in the rumen (Dawson, 1999). The N recycling might be an adaptive mechanism to retain N within the system and might be needed to provide NH3
continuously for microbial protein synthesis (Marini and Van Amburgh, 2003). In the current study, this mechanism has minimized the potential negative im-pact of feeding a diet with a level of imbalance between energy and N supplies in the rumen of 20 or 40 g of OEB/kg of DM on digestion and N metabolism of double-muscled Belgian Blue bulls.
IMPLICATIONS
Provided the overall balance between ruminally de-gradable nitrogen and ruminally fermentable organic matter in the daily intake is sufficient, there is no fur-ther advantage for the double-muscled Belgian Blue bulls in balancing the release of energy and nitrogen in the rumen over the short term. Thus, these feeding patterns of the diet can be used under practical feeding conditions with minimal impact on the performance of ruminant animals for meat production.
LITERATURE CITED
AOAC. 1990. Official Methods of Analysis. 15th ed. Association of Official Analytical Chemists, Arlington, VA.
CVB. 2000. Veevoedertabel. Centraal Veevoederbureau, Lelystad, The Netherlands.
Czerwaski, J. M. 1986. An Introduction to Rumen Studies. Pergamon Press, Oxford, UK.
Dawson, J. M. 1999. Variation in nutrient supply and effects on whole body anabolism. Pages 101–126 in Proc. VIIIth Int. Symp. Protein Metabolism and Nutrition. G. E. Lobley, A. White, and J. C. MacRae, ed. EAAP Publications, Wageningen, The Neth-erlands.
De Campeneere, S., L. O. Fiems, and Ch. V. Boucque´. 2001. Composi-tional data on Belgian Blue double-muscled bulls. Anim. Res. 50:51–61.
Dehareng, D., and B. B. Ndibualonji. 1994. Naissance et destine´e de l’ammoniaque ruminale: Revue. 2. Absorption et destine´e ulte´rieure. Empoisonnement a` l’ammoniaque. Ann. Me´d. Ve´t. 138:387–398.
Dewhurst, R. J., D. R. Davies, and R. J. Merry. 2000. Microbial protein supply from the rumen. Anim. Feed Sci. Technol. 85:1–21.
Energy–nitrogen imbalance in the rumen 885 Faisant, N., V. Planchot, F. Kozlowski, M. P. Pacouret, P. Colonna,
and M. Champ. 1995. Resistant starch determination adapted to products containing high level of resistant starch. Sci. Aliments 15:83–89.
Fiems, L. O., B. G. Cottyn, Ch. V. Boucque´, D. F. Bogaerts, C. Van Eenaeme, and J. M. Vanacker. 1997. Effect of beef type, body weight and dietary protein content on voluntary feed intake, digestibility, blood and urine metabolites and nitrogen retention. J. Anim. Physiol. Anim. Nutr. 77:1–9.
Fiems, L. O., R. J. Moermans, Ch. V. Boucque´, B. G. Cottyn, and S. De Campeneere. 1999. Voluntary feed intake in dual-purpose and double-muscled Belgian White-Blue bulls. Pages 21–25 in Regulation of feed intake. D. van der Heide, E. A. Huisman, E. Kanis, J. W. M. Osse, M. W. A. Verstegen, ed. CABI Publishing, Wallingford, UK.
Franc¸ois, E., N. Thill, and A. The´wis. 1978. Me´thode rapide de dosage de l’oxyde de chrome dans les aliments, les fe`ces et les contenus digestifs par titrage apre`s oxydation nitroperchlorique. Ann. Zootech. 27:355–361.
Froidmont, E., Y. Beckers, and A. The´wis. 2000. Determination of the methionine requirement of growing double-muscled Belgian Blue bulls with a three-step method. J. Anim. Sci. 82:233–241. Henning, P. H., D. G. Steyn, and H. H. Meissner. 1993. Effect of synchronization of energy and nitrogen supply on ruminal char-acteristics and microbial growth. J. Anim. Sci. 71:2516–2528. Hornick, J. L., C. Van Eenaeme, A. Clinquart, M. Diez, and L. Istasse.
1998. Different periods of feed restriction before compensatory growth in Belgian Blue bulls: I. Animal performance, nitrogen balance, meat characteristics, and fat composition. J. Anim. Sci. 76:249–259.
Kim, E. J., D. S. Parker, and N. D. Scollan. 2001. Fishmeal supplemen-tation of steers fed on grass silage: Effects on rumen function, nutrient flow to and disappearance from the small intestine. Anim. Res. 50:337–348.
Lapierre, H., and G. E. Lobley. 2001. Nitrogen recycling in the rumi-nant: A review. J. Dairy Sci. 84(E Suppl.):E223–E236. Legay-Carmier, F., and D. Bauchart. 1989. Distribution of bacteria
in the rumen contents of dairy cows given a diet supplemented with soya-bean oil. Br. J. Nutr. 61:725–740.
Ludden, P. A., T. L. Wechter, and B. W. Hess. 2002a. Effects of oscillating dietary protein on nutrient digestibility, nitrogen me-tabolism, and gastrointestinal organ mass in sheep. J. Anim. Sci. 80:3021–3026.
Ludden, P. A., T. L. Wechter, and B. W. Hess. 2002b. Effects of oscillating dietary protein on ruminal fermentation and site and extent of nutrient digestion in sheep. J. Anim. Sci. 80:3336–3346. Makkar, H. P. S., and K. Becker. 1999. Purine quantification in digesta from ruminants by spectrometric and HPLC methods. Br. J. Nutr. 81:107–112.
Marini, J. C., and M. E. Van Amburgh. 2003. Nitrogen metabolism and recycling in Holstein heifers. J. Anim. Sci. 81:545–552. Milton, C. T., R. T. Brandt, Jr., and E. C. Titgemeyer. 1997. Urea
in dry-rolled corn diets: Finishing steer performance, nutrient digestion, and microbial protein production. J. Anim. Sci. 75:1415–1424.
Newbold, J. R., and S. R. Rust. 1992. Effect of asynchronous nitrogen and energy supply on growth of ruminal bacteria in batch cul-ture. J. Anim. Sci. 70:538–546.
Obispo, N. E., and B. A. Dehority. 1999. Feasibility of using total purines as a marker for ruminal bacteria. J. Anim. Sci. 77:3084–3095.
Pitt, R. E., J. S. Van Kessel, D. G. Fox, A. N. Pell, M. C. Barry, and P. J. Van Soest. 1996. Prediction of ruminal volatile fatty acids and pH within the net carbohydrate and protein system. J. Anim. Sci. 74:226–244.
Poncet, C., and D. Re´mond. 2002. Rumen digestion and intestinal nutrient flows in sheep consuming pea seeds: The effect of extru-sion or chestnut tannin addition. Anim. Res. 51:201–216. Richardson, J. M., R. G. Wilkinson, and L. A. Sinclair. 2003.
Syn-chrony of nutrient supply to the rumen and dietary energy source and their effects on the growth and metabolism of lambs. J. Anim. Sci. 81:1332–1347.
Russell, J. B., and H. J. Strobel. 1987. Concentration of ammonia across the membranes of mixed rumen bacteria. J. Dairy Sci. 70:970–976.
Satter, L. D., and L. L. Slyter. 1974. Effect of ammonia concentration on rumen microbial protein production in vitro. Br. J. Nutr. 32:199–208.
Sinclair, L. A., P. C. Garnsworthy, J. R. Newbold, and P. J. Buttery. 1993. Effect of synchronizing the rate of dietary energy and nitrogen release on rumen fermentation and microbial protein synthesis in sheep. J. Agric. Sci. 120:251–263.
Sinclair, L. A., P. C. Garnsworthy, J. R. Newbold, and P. J. Buttery. 1995. Effect of synchronizing the rate of dietary energy and nitrogen release in diets with similar carbohydrate composition on rumen fermentation and microbial protein synthesis in sheep. J. Agric. Sci. 124:463–472.
Talke, H., and G. E. Schubert. 1965. Enzymatic determination of urea using the coupled urease-GLDH enzyme system. Klin. Wo-chenschr. 43:174–176.
Tamminga, S., W. N. Van Straalen, A. P. J. Subnel, R. G. M. Meijer, A. Steg, C. J. G. Wener, and M. C. Block. 1994. The Dutch protein evaluation system: The DVE/OEB system. Livest. Prod. Sci. 40:139–155.
Valkeners, D., A. The´wis, F. Piron, and Y. Beckers. 2004. Effect of imbalance between energy and nitrogen supplies on microbial protein synthesis and nitrogen metabolism in growing double-muscled Belgian Blue bulls. J. Anim. Sci. 82:1818–1825. Van Es, A. J. H., and Y. Van der Honing. 1977. Het nieuwe
energet-ische voederwaarderingssyteem voor herkauwers: Wijze van afleiding en uiteindelijk voorstel. Report IVVO. 92:1–48. Van Soest, P. J., J. B. Robertson, and B. A. Lewis. 1991. Methods
for dietary fiber, neutral-detergent fiber and non-starch polysac-charides in relation to animal nutrition. J. Dairy Sci. 74:3583–3597.
Veenhuizen, J. J., A. D. McGilliard, and J. W. Young. 1984. Apparatus for total collection of urine from steers. J. Dairy Sci. 67:1865– 1867.
Zinn, R. A., and F. N. Owens. 1986. A rapid procedure for purine measurement and its use for estimating net ruminal protein synthesis. Can. J. Anim. Sci. 66:157–166.
http://jas.fass.org/cgi/content/full/84/4/877#BIBL
Citations
http://jas.fass.org/cgi/content/full/84/4/877#otherarticles