Dynamic regulation of human endogenous
retroviruses mediates factor-induced reprogramming
and differentiation potential
Mari Ohnukia,1, Koji Tanabea,2, Kenta Sutoua, Ito Teramotoa, Yuka Sawamuraa, Megumi Naritaa, Michiko Nakamuraa, Yumie Tokunagaa, Masahiro Nakamuraa, Akira Watanabea, Shinya Yamanakaa,b,3, and Kazutoshi Takahashia,3
aCenter for iPS Cell Research and Application, Kyoto University, Kyoto 606-8507, Japan; andbGladstone Institute of Cardiovascular Disease, San Francisco,
California 94158
Contributed by Shinya Yamanaka, July 14, 2014 (sent for review June 6, 2014; reviewed by Konrad Hochedlinger)
Pluripotency can be induced in somatic cells by overexpressing transcription factors, including POU class 5 homeobox 1 (OCT3/4), sex determining region Y-box 2 (SOX2), Krüppel-like factor 4 (KLF4), and myelocytomatosis oncogene (c-MYC). However, some induced pluripotent stem cells (iPSCs) exhibit defective differenti-ation and inappropriate maintenance of pluripotency features. Here we show that dynamic regulation of human endogenous retroviruses (HERVs) is important in the reprogramming process toward iPSCs, and in re-establishment of differentiation potential. During reprogramming, OCT3/4, SOX2, and KLF4 transiently hyperactivated LTR7s—the long-terminal repeats of HERV type-H (HERV-H)—to levels much higher than in embryonic stem cells by direct occupation of LTR7 sites genome-wide. Knocking down LTR7s or long intergenic non-protein coding RNA, regulator of reprogramming (lincRNA-RoR), a HERV-H–driven long noncoding RNA, early in reprogramming markedly reduced the efficiency of iPSC generation. KLF4 and LTR7 expression decreased to levels comparable with embryonic stem cells once reprogramming was complete, but failure to resuppress KLF4 and LTR7s resulted in defective differentiation. We also observed defective differentia-tion and LTR7 activadifferentia-tion when iPSCs had forced expression of KLF4. However, when aberrantly expressed KLF4 or LTR7s were suppressed in defective iPSCs, normal differentiation was restored. Thus, a major mechanism by which OCT3/4, SOX2, and KLF4 pro-mote human iPSC generation and reestablish potential for differ-entiation is by dynamically regulating HERV-H LTR7s.
retrotransposon
|
epigenetics|
evolutionH
uman pluripotent stem cells can be generated through two paths: (i) embryonic stem cells (ESCs) can be derived from embryos (1), and (ii) induced pluripotent stem cells (iPSCs) can be generated from differentiated cells through factor-mediated reprogramming (2). Most iPSCs are highly similar to ESCs, but we recently showed that∼10% of iPSC clones have a differenti-ation-defective phenotype, such that 20% of cells were un-differentiated, even after in vitro-directed neural differentiation (3). These differentiation-defective (DD)-iPSC clones exhibited high expression levels of∼10 genes—including abhydrolase do-main containing 12B (ABHD12B), HERV-H LTR-associating 1 (HHLA1) and chromosome 4 open reading frame 51 (C4ORF51)— driven by the long-terminal repeats (LTRs) of human endogenous retroviruses (HERVs).HERVs constitute∼8% of the human genome as a result of their transposon activity, but they can no longer perform trans-position (4). HERV type-H (HERV-H) transcripts are expressed in ESCs/iPSCs at higher levels than in differentiated cells (5). Approximately 80% of the LTRs belonging to the 50 most highly expressed HERV-H proviruses are occupied by core transcrip-tion factors involved in pluripotency, including POU class 5 homeobox 1 (OCT3/4), sex determining region Y-box 2 (SOX2), and NANOG homeobox (NANOG). Furthermore, HERV-H proviruses are expressed less in some iPSCs than in other iPSCs
and ESCs, suggesting that HERV-H expression may be a ba-rometer of pluripotency (5). Species-specific transposable ele-ments, including HERVs, contribute up to 25% of the core transcription-factor binding sites in mouse and human pluripo-tent stem cells, wiring new genes into the core regulatory net-work of pluripotency in each species (6). These observations suggest that transposable elements may be important deter-minants of pluripotency. However, little is known about the roles of HERVs in reprogramming during iPSC generation.
In the present study, we found that during reprogramming of so-matic cells toward iPSCs, HERV-H LTR7s were transiently activated to levels much higher than in ESCs, and this transient activation was required for efficient reprogramming. When reprogramming was
Significance
In this study, we found that human endogenous retoriviruses type-H (HERV-Hs) are transiently hyperactivated during re-programming toward induced pluripotent stem cells (iPSCs) and play important roles in this process. However, when reprog-ramming is complete and cells acquire full pluripotency, HERV-H activity should decrease to levels comparable with those in embryonic stem cells because failure to resilence this activity leads to the differentiation-defective phenotype in neural line-age. We also found that during reprogramming, reprogramming factors, including POU class 5 homeobox 1 (OCT3/4), sex de-termining region Y-box 2 (SOX2), and Krüppel-like factor 4 (KLF4) (OSK) bind to and activate long-terminal repeats of HERV-Hs. KLF4 possibly precludes Tripartite motif containing 28 and recruits not only OCT3/4 and SOX2, but also E1A binding protein p300 (p300) histone acethyltransferase on HERV-H loci. Therefore, OKSM-induced HERV-H activation constitutes an unanticipated and critical mechanism for iPSC formation.
Author contributions: S.Y. and K. Takahashi designed research; M.O., K. Tanabe, K.S., I.T., Y.S., M. Narita., Michiko Nakamura, and K. Takahashi performed research; M.O., Y.T., Masahiro Nakamura, A.W., and K. Takahashi analyzed data; K. Tanabe contributed new reagents/analytic tools; and S.Y. and K. Takahashi wrote the paper.
Reviewers included: K.H., Howard Hughes Medical Institute and Massachusetts General Hospital Cancer Center.
Conflict of interest statement: S.Y. is a member without salary of the scientific advisory board of iPS Academia Japan.
Freely available online through the PNAS open access option.
Data deposition: The data reported in this paper have been deposited in the Gene Ex-pression Omnibus (GEO) database,www.ncbi.nlm.nih.gov/geo(accession nos.GSE54848
andGSE56569).
1Present address: Anthropology and Human Genetics Department Biology II, Ludwig Max-imilians University Munich, 82152 Martinsried, Germany.
2Present address: Institute for Stem Cell Biology and Regenerative Medicine, Stanford School of Medicine, Stanford, California 94305.
3To whom correspondence may be addressed. Email: yamanaka@cira.kyoto-u.ac.jp or takahash@cira.kyoto-u.ac.jp.
This article contains supporting information online atwww.pnas.org/lookup/suppl/doi:10.
1073/pnas.1413299111/-/DCSupplemental.
complete, HERV-H expression decreased to levels comparable with those in ESCs. However, in DD-iPSC clones, HERV-H LTR7s remained aberrantly activated, leading to the defective differentia-tion. Thus, transient hyperactivation of HERVs is important in reprogramming somatic cells toward pluripotency and establishment of differentiation potential, revealing a previously unrecognized mechanism critical to cellular reprogramming technology.
Results
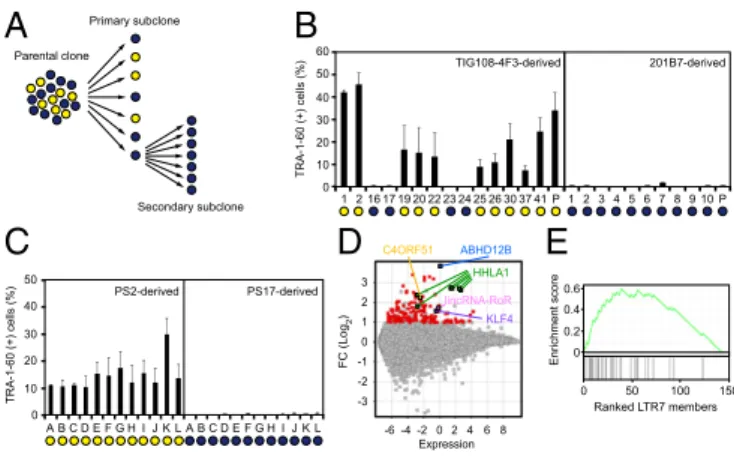
Characteristics of DD-iPSCs.To better understand the nature of DD-iPSCs, we performed single-cell subcloning with four defective iPSC lines established using retroviral vectors, such as TKCBV5-6 (7), TIG108-4F3 (3), and TIG118-4F1 (3), and integration-free episomal vectors, such as 451F3 (8) (Fig. 1A). The subclones were identical to their parental clones regarding patterns of integrated retroviral vectors and short tandem repeats (Fig. S1AandDataset S1). Based on marker-gene expression and neural differentiation potential, each DD-iPSC subclone had a normal or DD pheno-type, whereas all subclones derived from ESCs and normal iPSCs exhibited a normal phenotype (3, 9) (Fig. 1B andFig. S1B). The primary DD subclones derived from TIG108-4F3 DD-iPSCs were then used to produce secondary subclones, all of which showed the DD phenotype. Similarly, all normal primary subclones produced only normal secondary subclones (Fig. 1C). These data demon-strate that each DD-iPSC parental clone is monoclonal but con-sists of both DD and normal iPSCs. However, the DD phenotype is stable once subclones are isolated.
The subcloning experiments allowed us to compare DD-iPSCs and their normal counterparts under the same genetic background. Microarray comparison of global gene expression in normal and DD-iPSC subclones identified 144 marker genes that were enriched in DD-iPSCs (Fig. 1D andDataset S2), including the three previous reported genes ABHD12B, HHLA1, and C4ORF51. We also identified long intergenic non-protein coding RNA, regulator of
reprogramming (lincRNA-RoR), an HERV-H LTR7-related large intergenic noncoding RNA (lincRNA), and KLF4 as DD-iPSC marker genes (3, 10). Of the DD-iPSC markers, 21.5% (31 of 144) were located within 30 kb downstream of LTR7s. Gene set en-richment analysis (GSEA) exhibited a significant correlation be-tween DD-iPSC marker expression and the existence of HERV-H LTR7s [enrichment score = 0.59, false-discovery rate (FDR)
Parental clone Primary subclone Secondary subclone TIG108-4F3-derived 1 2 3 4 5 6 7 8 9 10 P 201B7-derived TRA-1-60 (+) cells (%) 0 10 20 30 40 50 60 17 16 19 20 22 23 24 25 26 30 37 41 1 2 P
D
FC (Log 2 ) 3 2 1 0 -1 -2 -3 Expression02 4 6 -4 -2 -6 8 ABHD12B HHLA1 C4ORF51 lincRNA-RoR KLF4 0.6 0.4 0.2 0 0 50 100 150 Enrichment score Ranked LTR7 membersA
B
C
E
PS2-derived PS17-derived 0 10 20 30 40 50 TRA-1-60 (+) cells (%) A B C D E F G H I J K L A B C D E F G H I J K LFig. 1. Enrichment of LTR7s in subcloned DD-iPSCs. (A) Summary of single-cell subcloning. (B) Differentiation potential of primary subclones. Shown are the percentages of TRA-1-60 (+) cells 14 d after neural induction of each primary subclone analyzed by flow cytometry. Blue and yellow circles in-dicate normal and DD-iPSC subclones/parents, respectively. n = 3. Error bars are SDs. (C) Differentiation potential of secondary subclones. Shown are the percentages of TRA-1-60 (+) cells 14 d after neural induction of TIG108-4F3-PS2- and PS17-derived secondary subclones. Blue and yellow circles indicate normal and DD-iPSC subclones, respectively. n = 3. Error bars are SDs. (D) Differential expression of genes between normal and DD-iPSCs. MA plot comparing global gene expression in normal (n = 18) and DD (n = 37) pri-mary subclones derived from four DD-iPSCs parental clones (TIG108-4F3, TIG118-4F1, 451F3, and TKCBV5-6). Red and colored dots indicate genes with significantly higher expression in DD-iPSCs (FC > 2, FDR < 0.05). (E) Correlation between DD-marker expression and the presence of LTR7 elements. GSEA plot showing enrichment of LTR7 elements in 144 DD-iPSC markers. DD-iPSC markers are displayed in order of their fold-changes between normal- (n = 18) and DD-(n = 37) iPSC subclones in expression levels determined by a microarray.
150 0 100 -50 -100 -200 0 200 400 Component 1 (55.28%) Component 2 (21.49%) d0 d3 d7 d11 d15 D d20 d28 N d49 d42d35 ESC 50 -150 0 10 20 30 40 50 d21 d29 TRA-1-60 (+) cells (%) N D Intermediates (d) 6 4 0 -4 -8 0 3 7 1115 20 283542 49 ESC EN ME NE PSMN
Normalized intensity (Log
2 ) 2 -2 -6 * * * * * * * * ** * N d0 d3 d7 d11 d15 d20 d28 d35 d42 d49 iPSC
ABHD12B C4ORF51 HHLA1 lincRNA-RoR ACTB
chr14:51,338,500-51,371,800 chr4:146,601,000-146,654,500 chr8:133,073,000-133,118,000 chr18:54,721,500-54,740,500 chr7:5,566,300-5,570,800
A
B
F
D
E
C
ABHD12B HHLA1 C4ORF51 0 10 20 30 d0 d20 N Relative occupancy * * * H3K4me3 * D D ** * d0 d20 N Methylation (%) 0 20 40 60 80 100 *** meCpGABHD12B HHLA1 C4ORF51 ACTB
30 25 20 15 10 5 ● ● ● ● Ct value ● ● ● ● ● ● ● ● ● ● ● ● ● ● ● ● ● ● ● ● ● ● 0 7 11 15 20 28ESC Intermediates (d) ● ● ● 0 7 11 15 20 28ESC Intermediates (d) 0 7 11 15 20 28ESC Intermediates (d) 0 7 11 15 20 28ESC Intermediates (d)
Fig. 2. Resemblance of DD-iPSC and partially reprogrammed cells. (A) Principal component analysis of DD-iPSC marker genes. Comparison of ex-pression of 144 DD-iPSC marker genes in HDFs (day 0, n = 4), intermediate reprogrammed cells derived from HDFs induced by OSKM [EGFP (+) cells on day 3 and TRA-1-60 (+) cells on d7-49, n = 3–4 in each time point], ESCs (n = 4), and normal (N, n = 18) and DD (D, n = 37)-iPSC subclones. The green arrow indicates the route of reprogramming. (B) Distribution of DD-iPSC marker gene expression. The box plot shows expression of 144 DD-iPSC marker genes in microarray data and their distribution in intermediate reprogrammed cells [EGFP (+) cells on day 3 and TRA-1-60 (+) cells on days 7–49], normal iPSCs, ESCs, and ESC/normal iPSC-derived differentiated progenies such as EN, ME, and NE, and PSMN. Red and black boxes indicate the median and quartile, respectively. Post hoc pairwise comparisons were performed by Tukey’s test (*P < 0.01 vs. day 0). (C) Transcription of DD-iPSC markers from LTR7 during reprogramming. Expression of ABHD12B, HHLA1, C4ORF51, lincRNA-RoR, and ACTB in HDFs (day 0), intermediate reprogrammed cells [EGFP (+) cells on day 3 and TRA-1-60 (+) cells on days 7–49] and iPSCs were revealed by RNA-seq. Red arrowheads indicate the LTR7 position and direction in each locus. (D) All TRA-1-60 (+) cells transiently express DD-iPSC markers. Ct values plotted by single-cell qRT-PCR for ABHD12B, HHLA1, C4ORF51, and ACTB in intermediate reprogrammed cells (days 0–28 in the x axis) and ESCs. At least 42 single cells were analyzed for each sample. Red dots indicate median values. Gray hourglass shapes represent the distribution of Ct value. Ct 30 indicates undetectable expression, which was indicated by Ct values >26. (E) Epigenetic statuses of LTR7s in TRA-1-60 (+) cells. The percentages of CpG methylation (Left) and H3K4me3 statuses (Right) in LTR7s on each locus including ABHD12B, HHLA1, and C4ORF51 revealed by bisulfite conversion/ pyrosequencing and ChIP-qPCR, respectively. Day 0, HDFs (n = 3); day 20, TRA-1-60 (+) cells (n = 3); N, normal iPSCs (n = 3); D, DD-iPSCs (n = 3). Error bars are SD. *P < 0.05 vs. N was calculated by t test. (F) Neural differentiation-defective phenotype of TRA-1-60 (+) cells during reprogramming. Proportions of TRA-1-60 (+) cells after SFEBq neural inducing culture for 14 d. n = 3. Error bars are SDs.
Ohnuki et al. PNAS | August 26, 2014 | vol. 111 | no. 34 | 12427
CE LL BI O LO G Y
q-value < 0.01] (Fig. 1E), showing that aberrant activation of LTR7s is a characteristic feature of the DD phenotype. Similarity Between DD-iPSCs and Partially Reprogrammed Cells.Next, we tried to understand why and how LTR7s were aberrantly ac-tivated in DD-iPSCs. To this end, we examined LTR7 activities during the course of iPSC generation. We sorted TRA-1-60–positive (+) reprogrammed cells on various days after retroviral transduction of OCT3/4, SOX2, KLF4, and myelocytomatosis oncogene (c-MYC) (subsequently referred to as OSKM) and analyzed their global gene expression by microarrays (11, 12). Using principle component analyses (PCA) with the 144 DD-iPSC markers, we found similarities between DD-iPSC subclones and TRA-1-60 (+) intermediate reprogrammed cells (Fig. 2A andFig. S2). During reprogramming, TRA-1-60 (+) cells showed transiently en-hanced expression of the DD-iPSC markers (including those driven by LTR7s), which reached significantly higher levels than in ESCs and normal iPSCs (Fig. 2B). When ESCs and normal iPSCs differentiated into endoderm (EN), mesoderm (ME), and neuroectoderm (NE), the expression of these markers signifi-cantly decreased. However, expression remained high in primi-tive streak-like mesendoderm (PSMN) (12). Deep sequencing of RNA (RNA-seq) from TRA-1-60 (+) cells exhibited the chimeric transcripts of ABHD12B, HHLA1, C4ORF51, and lincRNA-RoR with LTR7 sequences that meant transcription from intragenic LTR7s of HERV-Hs (Fig. 2C) (3, 10). Single-cell quantitative RT-PCR (qRT-PCR) showed that virtually all TRA-1-60 (+) cells—but not human dermal fibroblasts (HDFs) or ESCs—expressed the DD-iPSC marker genes related to
HERV-H LTR7s (Fig. 2D). Furthermore, in both TRA-1-60 (+) intermediate cells on day 20 and DD-iPSCs, we observed less CpG dinucleotide methylation and more trimethylation of lysine 4 on histone H3 (H3K4me3) in the LTR7-driven DD-iPSC marker genes (Fig. 2E). LTR7-driven DD-iPSC marker genes were highly expressed in TRA-1-60 (+) cells derived from HDFs as well as from adipose tissue-derived mesenchymal stem cells (mesoderm), astrocytes (ectoderm), and bronchial epithelium (endoderm) (Fig. S3). Furthermore, we found that on days 21 and 29, TRA-1-60 (+) cells showed defective neural differenti-ation, in that they still contained TRA-1-60 (+) cells even after in vitro directed neural differentiation (Fig. 2F). Overall, these data show that DD-iPSC clones are similar to TRA-1-60 (+) in-termediate reprogrammed cells in both gene expression and neural differentiation ability.
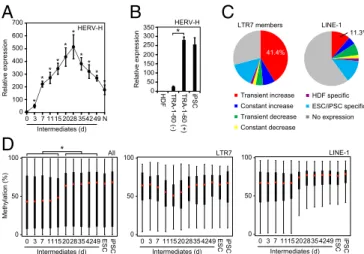
Genome-Wide LTR7 Activation During Reprogramming. This last observation prompted us to examine the genome-wide LTR7 activity during reprogramming. qRT-PCR using a primer set for a conserved sequence of HERV-H LTR7 (13, 14) revealed that HERV-H transcripts transiently increased in TRA-1-60 (+) cells during reprogramming (Fig. 3A). The expression level of HERV-H in TRA-1-60 (+) intermediates on day 7 was significantly higher than those in TRA-1-60 (−) cells (Fig. 3B). RNA-seq showed that more than 40% of 3,771 LTR7 members in the human 0 3 7 1115 2028 354249 N 0 100 500 300 Relative expression 600 200 400 700 HERV-H Intermediates (d) * * * * * Transient increase Constant increase Transient decrease Constant decrease HDF specific No expression ESC/iPSC specific LTR7 members LINE-1 41.4% 11.3% * ** ** 0 100 50 0 3 7 1115 202835 4249 Intermediates (d) LINE-1 0 100 50 0 3 7 1115 202835 4249ESC iPSC Intermediates (d) LTR7 ESC iPSC 0 100 50 Methylation (%) 0 3 7 1115 202835 4249 Intermediates (d) * All ESC iPSC
A
B
D
HDF TRA-1-60 (-) TRA-1-60 (+) iPSC 0 50 100 150 200 250 300 350 Relative expression HERV-H *
C
Fig. 3. Transient hyperactivation of LTR7s during iPSC generation. (A) Transition of total LTR7 transcription level during reprogramming. The plot shows the relative expression of total HERV-H in intermediate reprogrammed cells [EGFP (+) cells on day 3 and TRA-1-60 (+) cells on days 7–49] and normal iPSCs (N) compared with HDFs (day 0) revealed by qRT-PCR. Each value was normalized to that of G3PDH. n = 3. Error bars are SD. *P < 0.05 vs. HDF was calculated by Dunnett test. (B) Abundant HERV-H expression in TRA-1-60 (+) intermediates. Shown are relative expression of HERV-H in HDFs, TRA-1-60 (−) or (+) cells on day 7 and normal iPSCs analyzed by qRT-PCR. Each value was normalized to that of G3PDH. n = 3. Error bars are SD. *P < 0.05 was calculated by t test. (C) Expression patterns of the LTR7 family during reprogramming. Data are shown as LTR7 members and LINE-1 reads per kilobase of exon per million mapped reads (RPKM) in HDFs, TRA-1-60 (+) cells on day 20, and ESCs/normal iPSCs (n = 8). (D) Distribution of CpG methylation during reprogramming. The box plots show the distribution of methylation level at CpGs on all probes (Left), LTR7 (Center), and LINE-1 (Right) regions with overhang sequences (250 bp) in HDFs (day 0), in-termediate reprogrammed cells [EGFP (+) cells on d3 and TRA-1-60 (+) cells on days 7–49], ESCs, and normal iPSCs. Red and black bars indicate the me-dian and quartile, respectively. n = 3. Post hoc pairwise comparisons were performed by Tukey’s test (*P < 0.01).
0 1
ABHD12B
Relative expression (Log
10 ) + + + + + + + + + + + + + + + + + + + + + + + + + + + + + + + + OCT3/4 SOX2 KLF4 c-MYC Mock 2 3 -1 * LTR7 OSK OK K O OS SK S None 0.8 0.6 0.4 0.2 0 0 1000 2000 3000 4000 Enrichment score Ranked LTR7 members 0 1 2 LT
R7s per total peak (%)
OCT3/4 SOX2 * * 0 20 40 OCT3/4 SOX2 OSKM OSM * * LINE-1 LTR7
KAP-1 ESET p300 H3ac
0 0.05 0.1 0.15 0.2 OSM OSKM OSNM HHLA1
KAP-1 ESET p300 H3ac
0 0.05 0.1 0.15 0.2 OSM OSKM OSNM ABHD12B
Enrichment per input
0 500 1000 1500 0 500 1000 1500 2000 2500 Observed counts = 1118
Overlap peak counts
Frequency OCT3/4 0 500 1000 1500 0 200400 600 8001000 Observed counts = 773
Overlap peak counts SOX2 0 500 1000 1500 2000 0 500 1000 1500 Observed counts = 1275
Overlap peak counts KLF4
B
A
C
D
E
F
Fig. 4. Role of OSK in LTR7 activation. (A) OSK is required for activation of ABHD12B expression. Relative expression level of ABHD12B on day 7 post-transduction for all combinations of OSKM. Error bars are SDs. n = 3. *P < 0.05 vs. Mock was calculated by Dunnett test. (B) Distribution of reprogramming factor occupancy on all LTR7s loci revealed by ChIP-seq. (C) Significance of the interaction of reprogramming factors to LTR7s. Histograms show counts of peaks for OCT3/4, SOX2, or KLF4 overlapped with randomly selected regions (10,000 random trials). The 95th percentile count of distribution is marked by red lines. Green dots show counts of ChIP-seq peaks on LTR7 regions with overhang sequences (250 bp). (D) GSEA plot showing enrichment of OSK oc-cupancies in expressed LTR7s. Expressed LTR7 family members in TRA-1-60 (+) cells on day 15 are enriched in the set of LTR7s that show full-array OSK binding (P = 2.4e-155). (E) KLF4-dependent binding of OCT3/4 and SOX2 to LTR7s. Bars show the percentage of OCT3/4- or SOX2-bound LTR7 family members and LINE-1 in HDFs transduced with OSKM (closed) or OSM (open) on day 3 posttransduction. χ2tests were performed between the proportions (*P < 0.05).
(F) Interaction between HERV-H loci and chromatin modifiers. ChIP assays were performed to analyze the interaction of ABHD12B and HHLA1 loci with KAP-1, ESET, p300, and pan-acetyl histone H3 (H3ac) occupancy in HDFs transduced with OSM, OSKM, or OSNM on day 3 were analyzed by ChIP-qPCR. n = 3. Error bars are SD.
genome were transiently activated in TRA-1-60 (+) intermediate reprogrammed cells (Fig. 3C), whereas another transposable element, long-interspersed element-1 (LINE-1), showed varying expression patterns. Array-based analyses revealed that CpG methylation of LTR7 regions in TRA-1-60 (+) cells transiently decreased (Fig. 3D) (15). In contrast, global CpGs and those around LINE-1 elements gradually became methylated during reprogramming. Therefore, LTR7s were activated in a genome-wide manner during OSKM-mediated reprogramming.
Role of OSK in LTR7 Activation.We next examined how OSKM helps activate the LTR7s during reprogramming. In day 7-transduced HDFs, we found that forced expression of OSK or OSKM, but not any single reprogramming factor or another combination, induced expression of the LTR7-driven gene ABHD12B (Fig. 4A). Thus, OCT3/4, SOX2, and KLF4 are all required for LTR7 activation. ChIP and sequencing (ChIP-seq) analyses showed that∼15% of 3,771 LTR7s had cobinding of OCT3/4, SOX2, and KLF4 (OSK),∼8% had cobinding of OCT3/4 and KLF4 (OK), and∼5% had binding of KLF4 alone (K) (Fig. 4B). Compared with random binding, the concentrations of OCT3/4, SOX2, or KLF4 binding in LTR7s was highly significant (Fig. 4C). In addi-tion, GSEA exhibited a significant correlation between OSK binding and HERV-H LTR7 expression in TRA-1-60 (+) cells (enrichment score = 0.85, P = 2.4 × 10−155) (Fig. 4D). The number of OCT3/4- and SOX2-bound LTR7s markedly decreased in the absence of KLF4 (P = 2.2 × 10⁻¹⁶for both OCT3/4 and SOX2) (Fig. 4E), but such drastic decreases were not observed in OCT3/4-or SOX2-binding to LINE-1. Two proteins, KAP-1 (KRAB-associated protein 1) and histone methyltransferase SET domain bifurcated 1 (ESET), have been shown to be critical in suppression of endogenous retroviruses (16). ChIP experiments revealed that in HDFs transduced with OSKM, the binding of KAP-1 to LTR7s significantly decreased in ABHD12B and HHLA1 loci, but this
decrease was not observed with OSM or OSNM (OSM with NANOG instead of KLF4) (Fig. 4F). In addition, the interaction between p300 and acetylated histone H3 was enriched by OSKM transduction, but not when KLF4 was absent (Fig. 4F). Therefore, KLF4 activates LTR7s by promoting OSK binding, recruiting the coactivator p300, and excluding KAP-1.
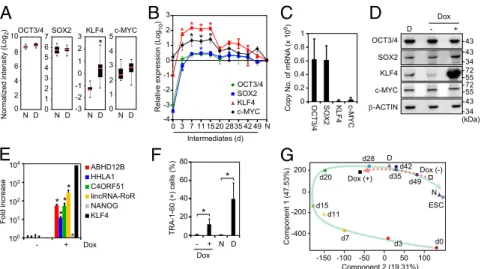
KLF4, a DD-iPSC Marker, Activates LTR7.In addition to LTR7-driven transcripts, we identified KLF4 as a marker gene associated with the DD phenotype (Fig. 1D). Among the OSKM reprogramming factors, only KLF4 was enriched in DD-iPSC subclones (Fig. 5A). Whether KLF4 expression was derived from transgene or endogenous locus differed among clones (Fig. S4A). In the subclones derived from TIG118-4F1 and 451F3, the expression of endogenous KLF4 highly correlated to the DD phonotype (Fig. S4B). On the other hand, there was no significant corre-lation between neural differentiation potentials and endogenous KLF4 expression in the subclones derived from TIG108-4F3 and TKCBV5-6, which mainly expressed exogenous KLF4 (Fig. S4B). These data suggest that KLF4 expression including both aberrant activation of endogenous genes and insufficient si-lencing of retroviral vectors could be associated with the DD phenotype. We therefore analyzed the expression of KLF4, to-gether with the remaining reprogramming factors, during iPSC generation. Total expression levels of OCT3/4 and SOX2 (from both endogenous genes and transgenes) increased more than 1,000-fold within 3 d after retroviral transduction and ap-proached the levels in ESCs/iPSCs (Fig. 5B). After retroviral transgenes were silenced, the expression of OCT3/4 and SOX2 remained high because the endogenous genes were induced. Con-versely, overexpression of KLF4 was transient and decreased once the retroviral transgenes were silenced (Fig. 5 A and B). Accord-ingly, the copy number of KLF4 mRNA was less than 1/40 of those for OCT3/4 and SOX2 in ESCs and normal iPSCs (Fig. 5C). This KLF4
OCT3/4 SOX2 c-MYC
Normalized intensity (Log
2 ) * 0 2 4 6 8 10 0 2 4 6 5 7 3 1 -3 -1 1 3 2 0 -2 0 2 4 5 3 1 N D N D N D N D 1 0.8 0.6 0.4 0.2
0 OCT3/4 SOX2 KLF4 c-MYC
Copy No. of mRNA
(x 10 6) -150 -100 -50 0 50 100 Component 2 (19.31%) Component 1 (47.53%) d7 d3 d0 d11 d15 N d20 d28 d49 D 0 -200 200 -400 Dox (-) Dox (+) d42 d35 ESC ABHD12B HHLA1 C4ORF51 NANOG KLF4 lincRNA-RoR * Fold increase Dox - + * * * 100 101 102 103 104 - + Dox N D TRA-1-60 (+) cells (%) 0 20 40 60 80 * * 0 3 7 11 1520 2835 42 49 N 0 1 2 3 -1 -2 -3 -4 OCT3/4 SOX2 KLF4 c-MYC
Relative expression (Log
10 ) * * * * ** * * Intermediates (d)
B
A
C
D
E
F
G
34 43 43 34 43 55 72 55 72 (kDa) D - + OCT3/4 SOX2 KLF4 c-MYC β-ACTIN DoxFig. 5. Role of KLF4 in the DD phenotype. (A) High expression of KLF4 in DD-iPSCs. Expression levels of total OCT3/4, SOX2, KLF4, and c-MYC in normal- (N; n = 18) and DD- (D; n = 37) iPSC primary subclones in microarray analysis. *FDR < 0.05 vs. N was calculated by t test. (B) Relative expression of total OSKM in intermediate reprogrammed cells were quantified by qRT-PCR and compared with those in iPSC. Each value was normalized to that of G3PDH. n = 3. Error bars are SDs. *P < 0.05 vs. iPSC (N) was calculated by Dunnett test. (C) Copy number of OSKM mRNAs in iPSCs. Data are shown as copy numbers of mRNA per 50 ng of total RNA calculated using a plasmid encoding each factor as a standard in qRT-PCR. n = 23. Error bars are SDs. (D) Expression of KLF4 protein. Western blot analyses of expression of OCT3/4, SOX2, KLF4, c-MYC, and β-ACTIN proteins in DD-iPSCs (D) and normal iPSCs (N) transduced with Dox-inducible KLF4 main-tained with (+) or without (−) Dox. (E) KLF4 induces DD-iPSC marker expression in iPSCs. Bars show the relative expression levels of ABHD12B, HHLA1, C4ORF51, lincRNA-RoR, NANOG, and KLF4 in KLF4-overexpressing iPSCs analyzed by qRT-PCR. Each value was normalized to that of G3PDH. n = 3. Error bars are SDs. *P < 0.05 vs. Dox (−) were calculated by t test. (F) KLF4 prevents neural differentiation. Normal iPSCs transduced with Dox-inducible KLF4 were differentiated into neural cells using the SFEBq method with (+) or without (−) Dox. Bars show the percentages of TRA-1-60 (+) cells after a SFEBq neural inducing culture for 14 d. N and D represent normal and DD-iPSCs, respectively. n = 3. Error bars are SDs. *P < 0.05 was calculated by t test. (G) KLF4 changes the fate of iPSCs. PCA of microarray data from HDFs (day 0), TRA-1-60 (+) intermediate reprogrammed cells, normal iPSC subclones (N), DD-iPSC subclones (D), and Dox-inducible KLF4-transduced iPSCs with (+) or without (−) Dox for the 144 DD-iPSC marker genes. The green arrow indicates the route of reprogramming. The red broken arrow indicates the fate transition after induction of the KLF4 transgene.
Ohnuki et al. PNAS | August 26, 2014 | vol. 111 | no. 34 | 12429
CE LL BI O LO G Y
fact develops the transient increase of KLF4 expression during reprogramming toward iPSCs. On the other hand, the expression of OCT3/4 and SOX2 are constant even after transgene silencing occurred between days 15 and 20 posttransduction. Overall, in-creased expression of KLF4 correlated with aberrant activation of LTR7s in both the reprogramming process and in DD-iPSCs.
To further examine the role of KLF4 in LTR7 activation, we introduced a doxycycline (Dox)-inducible KLF4 expression cassette into normal iPSCs using a PiggyBac transposon system (17) (Fig. 5D). Dox-induced KLF4 expression activated the LTR7-related transcripts ABHD12B, HHLA1, C4ORF51, and lincRNA-RoR but did not affect non-LTR–related genes, such as NANOG (Fig. 5E). Furthermore, overexpression of KLF4 in normal iPSCs produced the DD phenotype (Fig. 5F) (18). In contrast to neural lineage commitment, we observed no effects of KLF4 on the differentiation potentials of iPSCs into EN, ME, and PSMN (Fig. S5). This tendency was common between DD-iPSCs and KLF4-overexpressing iPSCs. PCA on the 144 DD-iPSC markers showed that KLF4-overexpressing iPSCs are quite similar to TRA-1-60 (+) intermediate reprogrammed cells (Fig. 5G), which confirms that KLF4 helps establish the DD phenotype.
To clarify the specificity by which KLF4 activates HERV-Hs in HDFs, we replaced KLF4 in the OSKM induction mixture with the reprogramming factor NANOG (referred to as OSNM). OSNM induced a few TRA1-60 (+) cells on day 7 and ESC-like colonies on day 28 (Fig. S6A). In TRA-1-60 (+) cells induced by OSNM, the expressions of KLF4 (Fig. S6B), HERV-Hs (Fig. S6C), and LTR7-driven genes (Fig. S6D) were only slightly ac-tivated. Therefore, overexpression of KLF4 and hyperactivation of HERV-H LTR7s are strongly correlated with efficient reprogramming in iPSC generation.
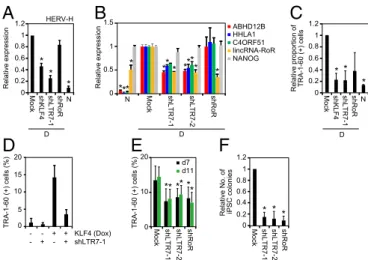
We next performed loss-of-function experiments to further in-vestigate the roles of KLF4 and LTR7 in reprogramming and the DD phenotype. We designed four sets of short hairpin RNAs (shRNAs): one targeted KLF4 (shKLF4); two targeted LTR7 sequences conserved among ABHD12B, HHLA1, C4ORF51, and lincRNA-RoR (shLTR7-1 and shLTR7-2); and one targeted lincRNA-RoR (shRoR). In DD-iPSCs, shKLF4 and shLTR7-1, but not shRoR, significantly suppressed the total expression of HERV-Hs (Fig. 6A). The two shRNAs targeting the conserved LTR7 sequences effectively suppressed ABHD12B, HHLA1, C4ORF51, and lincRNA-RoR, but did not suppress NANOG (Fig. 6B). shRoR specifically repressed lincRNA-RoR expression but did not affect ABHD12B, HHLA1, C4ORF51, or NANOG (Fig. 6B). Suppressing KLF4 or HERV-H LTR7s in DD-iPSCs effec-tively reversed the DD phenotype and made the cells comparable to normal iPSCs (Fig. 6C). We observed a similar trend for shRoR, but the change was not statistically significant (P = 0.09). In addition, shLTR7-1 canceled the DD phenotype of KLF4-overexpressing iPSCs (Fig. 6D). Transducing these shRNAs with OSKM reduced the number of TRA-1-60 (+) cells on days 7 and 11 (Fig. 6E) and almost completely inhibited the generation of iPSC colonies (Fig. 6F). These data confirmed the important roles of KLF4 and LTR7 in reprogramming and the DD phenotype. Discussion
In this study, we found that genome-wide HERV-Hs, including lincRNA-RoR, are transiently hyperactivated during reprogram-ming toward iPSCs and play important roles in this process. However, when reprogramming is complete and cells acquire full pluripotency, HERV-H LTR7 activity should decrease to levels comparable with those in ESCs. Failure to resilence this activity leads to the DD phenotype. This observation resembles NANOG, which promotes induction and maintenance of pluripotency, but suppress differentiation when aberrantly expressed (19). We also found that during reprogramming, OSK factors bind to and activate LTR7s. Therefore, a major mechanism by which OSK reprogramming factors promote human iPSC generation is by
transiently hyperactivating HERV-H LTR7s. Noteworthy, our findings suggest the significance of the transition state of inter-mediate reprogrammed cells, including hyperactivation of HERV-Hs induced by reprogramming factors. Among these cells, KLF4 particularly plays important roles for the activation of HERV-Hs. Our data also revealed that NANOG as a replacer of KLF4 in iPSC generation can induce less HERV-H activity during reprogramming (11). Therefore, the reason why the significant difference of reprogramming activity between KLF4 and NANOG can be explained with our data.
Recent study by Lu et al. showed that HERV-H activity reg-ulated by OCT3/4 and p300 is important for generation and self-renewal of iPSCs (20). Among OSKM reprogramming factors, we showed that KLF4 levels are the most important for activating and resuppressing LTR7s. First, the binding of OCT3/4 and SOX2 to LTR7s was highly dependent on the presence of KLF4. Corrob-orating this finding, we and others have previously demonstrated that the KLF4 protein binds to OCT3/4 and SOX2 proteins. Second, we detected a surge in KLF4 expression during reprog-ramming, which was correlated with the transient hyperactivation of LTR7s. At around 15 d after transduction, overexpression of
Relative No. of iPSC colonies
Mock shLTR7-1 shLTR7-2 shRoR 0 0.2 0.4 0.6 0.8 1 1.2 * * * 0 0.2 0.4 0.6 0.8 1 1.2 Mock shKLF4 shLTR7-1 shRoR Relative expression * * D N * HERV-H D 0 0.5 1 Relative expression N Mock shLTR7-1 shLTR7-2 *** * ** shRoR * 1.5 * ABHD12B HHLA1 C4ORF51 NANOG lincRNA-RoR * * * * d7 d11
TRA-1-60 (+) cells (%) Mock shLTR7-1 shLTR7-2 shRoR
10 20 0 ** ** ** 0 0.2 0.4 0.6 0.8 1 1.2
Relative proportion of TRA-1-60 (+) cells * * * Mock shKLF4 shLTR7-1 shRoR D N
C
E
F
A
B
KLF4 (Dox) 0 5 10 15 20 shLTR7-1 -+ -+ + + TRA-1-60 (+) cells (%)D
Fig. 6. Loss of function experiments to test roles of KLF4 and LTR7s in reprogramming and the DD phenotype. (A) KLF4 is responsible for HERV-H expression. Shown are relative expressions of HERV-H in DD-iPSCs (D) trans-duced with KLF4 shRNA (shKLF4), LTR7 shRNA-1 (shLTR7-1), or shRoR, and normal iPSCs (N) compared with those of Mock-transduced DD-iPSCs. Each value was normalized to that of G3PDH. n = 3. Error bars are SDs. n = 3. *P < 0.05 vs. Mock was calculated by Dunnett test. (B) Knockdown of LTR7 ex-pression. Bars show relative expression of ABHD12B, HHLA1, C4ORF51, lincRNA-RoR, and NANOG in normal iPSCs (N) and DD-iPSCs (D) transduced with empty vector (Mock), LTR7 shRNA-encoding vectors (shLTR7-1 and -2), or shRoR compared with Mock analyzed by microarray. Error bars are SDs. N =2. *P < 0.05 vs. Mock was calculated by Dunnett test. (C) Suppression of KLF4/ HERV-H LTR7 rescues the DD phenotype. Shown are the relative proportions of residual TRA-1-60 (+) cells on day 14 after neural differentiation of DD-iPSCs (D) carrying empty vector (Mock), LTR7 shRNAs (shLTR7-1), or shRoR, compared with normal iPSCs (N). n = 3. *P < 0.05 vs. Mock was calculated by Dunnett test. (D) Suppression of LTR7 rescues the KLF4-induced DD phenotype. Shown are the percentages of residual TRA-1-60 (+) cells on day 14 after neural differ-entiation of normal iPSCs carrying dox-inducible KLF4, and empty vector or LTR7 shRNA (shLTR7-1). Differentiation was performed in the presence (+) or absence (−) of Dox. Error bars are SDs. n = 2. (E) LTR7 activity enhances reprogramming efficiency. Shown are the percentages of TRA-1-60 (+) cells on days 7 (black) and 11 (green) posttransduction of OSKM with empty vector (Mock), LTR7 shRNA-encoding vectors (shLTR7-1 and -2), or shRoR vector. n = 3. Error bars are SDs. *P < 0.05 vs. Mock was calculated by Dunnett test. (F) LTR7 activity facilitates iPSC generation. Shown are the relative numbers of iPSC colonies on day 25 posttransduction of OSKM with empty vector (Mock), LTR7 shRNA-encoding vectors (shLTR7-1 and -2), or shRoR vector. Error bars are SDs. n = 4. *P < 0.05 vs. Mock was calculated by Dunnett test.
OSKM from retroviral transgenes is silenced. However, OCT3/4 and SOX2 maintained high expression levels because of the ac-tivation of their endogenous genes. In contrast, the endogenous KLF4 gene was only weakly activated, thus its total expression level rapidly decreased. In DD-iPSC clones and subclones, KLF4 is expressed at higher levels than in normal iPSCs, in agreement with the expression level of KLF4 helping determine LTR7 ac-tivity. Furthermore, we found that KLF4, together with OCT3/4 and SOX2, increased the binding of coactivator p300 to LTR7s and decreased KAP-1 binding to LTR7s. It has been shown that both KLF4 and KAP-1 bind to methylated DNA (21), suggesting a competition between the two proteins. Overall, we found that KLF4 strongly promotes LTR7 activity.
Among LTR7-driven transcripts, we found that lincRNA-RoR importantly influenced reprogramming and the DD phenotype. This result is consistent with a report from Loewer et al., who showed that lincRNA-RoR promoted iPSC generation (22). The authors identified lincRNA-RoR as one of 10 lincRNAs whose expression levels were higher in iPSCs than in ESCs (22). In contrast, the levels of lincRNA-RoR within most iPSC clones in our study were comparable to those of ESCs. Only DD-iPSCs showed higher expression levels. The functions of lincRNA-RoR remain elusive, but it may serve as a microRNA (miRNA) sponge that protects SOX2 and NANOG from miRNA-mediated degradation by sharing the binding sites of miRNAs that suppress the core transcription factors (23). Alternatively, lincRNA-RoR may suppress p53 (24), which inhibits reprogramming (25–29). Other LTR7-driven transcripts besides lincRNA-RoR likely also contrib-ute to reprogramming and the DD phenotype, given that shRoR only weakly reversed the DD phenotype compared with shKLF4 or shLTR7s. Further studies, including genetic deletion of lincRNA-RoR, are required to fully understand how the activation of LTR7s contributes to reprogramming and the DD phenotype.
Our results suggest that reprogramming processes may use unique transposable elements in each species. Because neither HERV-H sequences nor lincRNA-RoR are conserved in mice, their activation cannot contribute to mouse reprogramming. Bourque and colleagues compared the binding sites of OCT3/4
and NANOG in their target genes and showed that species-specific transposable elements have substantially altered the transcriptional circuitry of pluripotent stem cells (6). Thus, ERV-1, including HERV-H, plays a major role in reprogram-ming human cells, whereas ERV-K, which is enriched in Oct3/4-and Nanog-binding sites in mice (6), may be involved in re-programming mouse cells. Another study showed that a small portion of mouse ESCs and iPSCs express ERV-L retroviruses and possess the ability to differentiate not only into embryonic lineages but also into extraembryonic cells (30). Recently, Friedli et al. showed that aberrant activation of intracisternal A particle, a member of ERV-K, occurred during reprogramming of mouse embryonic fibroblasts toward iPSCs, as well as HERV-H be-havior in a human case, which may suggest the importance of ERV activity in reprogramming beyond species (31). An im-portant future task will involve examining the roles of species-specific ERVs in reprogramming and pluripotency.
Materials and Methods
Detailed descriptions of materials and methods are available inSI Materials and Methods. See Dataset S3 for primer sequences used in this study. Plasmids are available from Addgene (www.addgene.org).
ACKNOWLEDGMENTS. We thank D. Srivastava for critical reading of the manuscript; G. Howard for editorial assistance; S. Arai, S. Ando, Y. Inoue, and N. Amano for technical assistance; M. Koyanagi-Aoi for sharing data; A. Morizane and J. Takahashi for guidance regarding the cellular differen-tiation; and H. Suemori, T. Kitamura, K. Okita, K. Eto, N. Takayama, and K. Woltjen for providing important materials. We are also grateful to Y. Miyake, R. Kato, E. Minamitani, S. Takeshima, R. Fujiwara, Y. Higuchi and K. Nakahara for administrative support. This work was supported in part by Grants-in-Aid for Scientific Research from the Japanese Society for the Promotion of Science (JSPS) and from the Ministry of Education, Culture, Sports, Science, and Technology (MEXT); a grant from the Leading Project of the MEXT; a grant from the Funding Program for World-Leading Innovative Research and Development in Science and Technology (First Program) of the JSPS; a grant from Core Center for iPS Cell Research, Research Center Network for Realization of Regenerative Medicine; a grant from World Premier International Research Center Initiative (WPI), MEXT; a grant from Japan Foundation for Applied Enzymology; and iPS Cell Research Fund. M.O. was supported as a JSPS fellow.
1. Thomson JA, et al. (1998) Embryonic stem cell lines derived from human blastocysts. Science 282(5391):1145–1147.
2. Takahashi K, et al. (2007) Induction of pluripotent stem cells from adult human fibroblasts by defined factors. Cell 131(5):861–872.
3. Koyanagi-Aoi M, et al. (2013) Differentiation-defective phenotypes revealed by large-scale analyses of human pluripotent stem cells. Proc Natl Acad Sci USA 110(51):20569–20574. 4. Lander ES, et al.; International Human Genome Sequencing Consortium (2001) Initial
sequencing and analysis of the human genome. Nature 409(6822):860–921. 5. Santoni FA, Guerra J, Luban J (2012) HERV-H RNA is abundant in human embryonic
stem cells and a precise marker for pluripotency. Retrovirology 9:111.
6. Kunarso G, et al. (2010) Transposable elements have rewired the core regulatory network of human embryonic stem cells. Nat Genet 42(7):631–634.
7. Takayama N, et al. (2010) Transient activation of c-MYC expression is critical for ef-ficient platelet generation from human induced pluripotent stem cells. J Exp Med 207(13):2817–2830.
8. Okita K, et al. (2011) A more efficient method to generate integration-free human iPS cells. Nat Methods 8(5):409–412.
9. Morizane A, Doi D, Kikuchi T, Nishimura K, Takahashi J (2011) Small-molecule inhibitors of bone morphogenic protein and activin/nodal signals promote highly efficient neural induction from human pluripotent stem cells. J Neurosci Res 89(2):117–126. 10. Kelley D, Rinn J (2012) Transposable elements reveal a stem cell-specific class of long
noncoding RNAs. Genome Biol 13(11):R107.
11. Tanabe K, Nakamura M, Narita M, Takahashi K, Yamanaka S (2013) Maturation, not initiation, is the major roadblock during reprogramming toward pluripotency from human fibroblasts. Proc Natl Acad Sci USA 110(30):12172–12179.
12. Takahashi K, et al. (2014) Induction of pluripotency in human somatic cells via a transient state resembling primitive streak-like mesendoderm. Nat Commun 5:3678. 13. Jern P, Sperber GO, Ahlsén G, Blomberg J (2005) Sequence variability, gene structure, and expression of full-length human endogenous retrovirus H. J Virol 79(10): 6325–6337.
14. Liang Q, Xu Z, Xu R, Wu L, Zheng S (2012) Expression patterns of non-coding spliced transcripts from human endogenous retrovirus HERV-H elements in colon cancer. PLoS ONE 7(1):e29950.
15. Lister R, et al. (2011) Hotspots of aberrant epigenomic reprogramming in human induced pluripotent stem cells. Nature 471(7336):68–73.
16. Rowe HM, et al. (2013) De novo DNA methylation of endogenous retroviruses is shaped by KRAB-ZFPs/KAP1 and ESET. Development 140(3):519–529.
17. Woltjen K, et al. (2009) piggyBac transposition reprograms fibroblasts to induced pluripotent stem cells. Nature 458(7239):766–770.
18. Kim H, et al. (2011) miR-371-3 expression predicts neural differentiation propensity in human pluripotent stem cells. Cell Stem Cell 8(6):695–706.
19. Darr H, Mayshar Y, Benvenisty N (2006) Overexpression of NANOG in human ES cells enables feeder-free growth while inducing primitive ectoderm features. Development 133(6):1193–1201.
20. Lu X, et al. (2014) The retrovirus HERVH is a long noncoding RNA required for human embryonic stem cell identity. Nat Struct Mol Biol 21(4):423–425.
21. Quenneville S, et al. (2011) In embryonic stem cells, ZFP57/KAP1 recognize a methyl-ated hexanucleotide to affect chromatin and DNA methylation of imprinting control regions. Mol Cell 44(3):361–372.
22. Loewer S, et al. (2010) Large intergenic non-coding RNA-RoR modulates reprogramming of human induced pluripotent stem cells. Nat Genet 42(12):1113–1117.
23. Wang Y, et al. (2013) Endogenous miRNA sponge lincRNA-RoR regulates Oct4, Nanog, and Sox2 in human embryonic stem cell self-renewal. Dev Cell 25(1):69–80. 24. Zhang A, et al. (2013) The human long non-coding RNA-RoR is a p53 repressor in
response to DNA damage. Cell Res 23(3):340–350.
25. Kawamura T, et al. (2009) Linking the p53 tumour suppressor pathway to somatic cell reprogramming. Nature 460(7259):1140–1144.
26. Hong H, et al. (2009) Suppression of induced pluripotent stem cell generation by the p53-p21 pathway. Nature 460(7259):1132–1135.
27. Banito A, et al. (2009) Senescence impairs successful reprogramming to pluripotent stem cells. Genes Dev 23(18):2134–2139.
28. Utikal J, et al. (2009) Immortalization eliminates a roadblock during cellular re-programming into iPS cells. Nature 460(7259):1145–1148.
29. Marión RM, et al. (2009) A p53-mediated DNA damage response limits reprogram-ming to ensure iPS cell genomic integrity. Nature 460(7259):1149–1153.
30. Macfarlan TS, et al. (2012) Embryonic stem cell potency fluctuates with endogenous retrovirus activity. Nature 487(7405):57–63.
31. Friedli M, et al. (2014) Loss of transcriptional control over endogenous retroelements during reprogramming to pluripotency. Genome Res.
Ohnuki et al. PNAS | August 26, 2014 | vol. 111 | no. 34 | 12431
CE LL BI O LO G Y
Supporting Information
Ohnuki et al. 10.1073/pnas.1413299111
SI Materials and MethodsCell Culture.Human dermal fibroblasts (HDFs) obtained from the Japanese Collection of Research Bioresources were maintained in DMEM (Nacalai tesque) containing 10% FBS (Japan Bio-serum) and 0.5% penicillin and streptomycin (Pen/Strep, Life Technologies). PLAT-E (1) and PLAT-GP cells were main-tained in the same medium. Embryonic stem cell (ESC) clones obtained from WiCELL (H1 and H9) (2) and Kyoto University (KhES1 and KhES3) (3) were maintained in Primate ESC me-dium (ReproCELL) supplemented with 4 ng/mL recombinant human basic fibroblast growth factor (bFGF, Wako) and 0.5% Pen/Strep on mitomycin C (MMC)-treated SNL feeder cells, or in mTeSR1 (Veritas) on Matrigel-coated plates (growth factor reduced; BD Biosciences) (4).
Reprogramming. Reprogramming experiments were conducted as described previously (4, 5). To generate retrovirus, we in-troduced retroviral plasmids into PLAT-E or PLAT-GP cells using the FuGENE 6 transfection reagent (Promega) (1). On the following day, the medium was replaced with an equal volume of fresh medium and cells were incubated overnight. The virus-containing supernatant was collected, filtered through a 0.45-μm pore-size cellulose acetate filter (Whatman) to remove cell de-bris, and supplemented with 4 μg/mL Polybrene (Nacalai tes-que). Appropriate combinations of viruses were mixed and exposed to HDFs expressing the mouse Slc7a1 gene overnight. This point was designated as day 0. To collect the samples on day 3 posttransduction, we introduced pMXs-internal ribosome entry site-EGFP (IG) encoding SOX2 instead of pMXs-SOX2, along with OKM (OCT3/4, KLF4, and c-MYC), and sorted EGFP (+) cells by flow cytometry. TRA-1-60 (+) intermediate reprogrammed cells were collected by magnetic activated cell sorting as described previously. For reprogramming experiments with shRNA trans-duction, 1 μg/mL puromycin was added to the medium from days 3–7 to eliminate untransduced cells. Cells were harvested on day 7 and reseeded onto MMC-inactivated SNL feeders to generate in-duced pluripotent stem cells (iPSCs). On the following day, the medium was replaced with Primate ESC medium supplemented with 4 ng/mL bFGF, and the medium was then changed every other day. The number of iPSC colonies was counted on day 25. We distinguished bona fide iPSC colonies from non-iPSC colonies based on their morphological differences (4).
Neural Differentiation and Flow Cytometry. The single-cell sus-pensions of pluripotent stem cells were prepared using CTK solution and AccuMAX (Innovative Cell Technology), and then transferred at 9 × 10³ cells per well of Lipidure-coated low-binding 96-well plates (NOF Corporation) in 8GMK medium consisting of Glasgow modified eagle medium (Life Technolo-gies), 8% knockout serum replacement (Life TechnoloTechnolo-gies), 1% nonessential amino acids (NEAA; Life Technologies), 1% so-dium pyruvate (Sigma), and 100 nM 2-mercaptoethanol (2-ME, Life Technologies) supplemented with 500 nM A-83-01 (Stem-gent) and 100 nM LDN193189 (Stem(Stem-gent). The medium was carefully half-changed on days 5, 8, and 11. On day 14, the ag-gregates were collected to a 1.5-mL tube and pelletized by centrifugation at 200 × g for 5 min. The pellet was washed with PBS and then dispersed to single cells using AccuMAX, and then cells were used for immunostaining. We used propidium iodide (Life Technologies) or DAPI (Life Technologies) to distinguish dead cells. Samples were analyzed using a FACS Aria II (Becton Dickinson).
Primitive Streak-Like Mesendoderm Differentiation. Primitive streak-like mesendoderm differentiation was performed as described previously (6, 7). In brief, single-cell suspensions of human iPSCs were plated onto fibronectin-coated plates (BD Biosciences) in DMEM/F12 (Life Technologies) supplemented with 1% Insulin-Transferrin-Selenite (Life Technologies), 1% Glutamax (Life Technologies), 1% NEAA, 2% B27 (Life Technologies), 100 nM 2-ME, and 0.5% Pen/Strep. We added 3 μM CHIR99021 (Stemgent) and 50 ng/mL Activin A (Peprotech) on day 1, 3 μM CHIR99021, 25 ng/mL Activin A and 20 ng/mL bFGF on day 2 and 3 μM CHIR99021, 10 ng/mL Activin A, 20 ng/mL bFGF and 40 ng/mL BMP4 (R&D Systems) on day 3.
Endoderm Differentiation. Endoderm differentiation was per-formed as described previously, with slight modification (6, 8). The single-cell suspensions of human pluripotent stem cells were plated onto Matrigel-coated plates in RPMI1640 (Life Technolo-gies) containing 2% B27, 100 ng/mL Activin A, 3 μM CHIR99021, and 0.5% Pen/Strep. We added 0.5 mM sodium butyrate (Sigma) on days 1–3, and then carried out sodium butyrate-free culture until day 7.
Mesoderm Differentiation. The mesodermal differentiation was performed as described previously, with slight modification (6, 9). The single-cell suspensions of human pluripotent stem cells were plated onto collagen I-coated plates (BD Biosciences) in DMEM/ F12 containing 2% B27, 100 ng/mL Activin A, 3 μM CHIR99021 and 0.5% Pen/Strep. Forty-eight hours later, the medium was re-placed with DMEM/F12 supplemented with 2% B27, 25 ng/mL BMP4, and 0.5% Pen/Strep. The medium was changed every other day until day 8.
Antibodies.The following antibodies were used in the study: Alexa 488-conjugated TRA-1-60 (1:20, 560173, BD Biosciences), anti-polysialylated neuronal cell-adhesion molecule (PSA-NCAM) antibody (1:50; MAB5324, Millipore), APC-labeled anti–C-X-C chemokine receptor type 4 (CXCR4) (1:5; FAB170A, R&D Sys-tems), phycoerythrin (PE)-labeled antiplatelet-derived growth fac-tor recepfac-tor-α (PDGFRA) (1:5; 556002, BD Pharmingen), APC-conjugated anti-BRACHYURY (1:5; IC20851A, R&D Systems), Alexa 647-conjugated anti-mouse IgM antibody (1:500; A-21238, Life Technologies), PE-conjugated TRA-1–60 (1:5; 560193, BD Pharmingen), and anti-PE microbeads (130-048-801, Miltenyi Biotec). For Western blot analyses, we used anti-OCT3/4 (1:600; sc-5279, Santa Cruz Biotechnology), anti-SOX2 (1:1,000; ab97959, Abcam), anti-KLF4 (1:500; AF3640, R&D Systems), anti–c-MYC (1:200; sc-42, Santa Cruz), anti–β-actin (1: 5,000; A5441, Sigma), anti-mouse IgG HRP (1:3,000; 7076S, Cell Signaling Technology), anti-rabbit IgG-HRP (1:2,000; 7074S, Cell Signaling), and anti-goat IgG-HRP (1:2,000; sc-2056, Santa Cruz). For ChIP analyses, we used anti-Flag M2 (F1804, Sigma), antitrimethylated lysine 4 of histone H3 antibody (MABI0304, Wako), anti-p300 (sc-585, Santa Cruz), anti-KAP1 (ab10483, Abcam), anti-SET domain bifurcated 1 (sc-66884, Santa Cruz), and antihistone H3Ac (pan acethyl) (39139, Active Motif).
Quantitative RT-PCR. Total RNA was isolated using the Qiazol reagent (Qiagen) and a miRNeasy mini kit (Qiagen). CDNA was generated with a ReverTra Ace-α kit (Toyobo) and oligo dT20 primer. For quantitative RT-PCR (qRT-PCR), reaction mixtures were set up in triplicate using SYBR premix Ex-Taq II (Takara) and run using a StepOne instrument (Applied Biosciences). The levels of mRNA were normalized to G3PDH expression, and
then relative expression was calculated as the fold-change from the control. Primer sequences for each gene are shown inDataset S3. Gene-Expression Analysis by Microarray.Total RNA was purified as described above and the quality was evaluated using a 2100 Bioanalyzer (Agilent Technologies). Total RNA (50 ng) was labeled with cyanine 3-CTP and used for hybridization with a SurePrint G3 Human GE 8 × 60 K array (G4851A, Agilent Technologies) with a one-color protocol. Hybridized arrays were scanned with a Microarray Scanner System (G2565BA, Agilent Technologies), and extracted signals were analyzed using Gene-Spring v12.6 software (Agilent Technologies). Gene-expression values were normalized by 75th percentile shifts. Differentially ex-pressed genes between normal and differentiation-defective (DD)-iPSCs were extracted by comparison using t tests with Benjamini and Hochberg corrections [FC > 2.0, false-discovery rate (FDR) < 0.05]. CpG Methylation Analysis by Microarray. Genomic DNA was extracted using a DNeasy Blood and Tissue Kit (Qiagen). Purified genomic DNA (30 ng) was used for bisulfite CT conversion with an EZ DNA methylation kit (Zymo Research). Bisulfite-treated DNA was whole-genome amplified and hybridized to Human-Methylation450 BeadChip (Illumina), followed by labeling with fluorescence by a single-base extension reaction. Fluorescent signals were read on an Illumina BeadStation GX scanner. Normalization and calculation of β-values, the ratio of methylated to unmethylated cytosine, was performed using GenomeStudio (Illumina). A β-value of 0 indicates nonmethylated cytosine, and that of 1 indicates fully methylated cytosine. The relative distance of the Infinium probe site from a region-of-interest, such as long-terminal repeat 7 (LTR7) and long-interspersed element-1 (LINE-1), was defined as the distance between the center of the region of interest and the probe position.
Pyrosequencing.Genomic DNA was extracted using a DNeasy Blood and Tissue Kit (Qiagen). Purified genomic DNA (500 ng) was used for bisulfite CT conversion with an EZ DNA methyl-ation kit (Zymo Research). PCR was performed in a 25-μL re-action mixture containing 25 ng of bisulfite-converted DNA, Pyromark PCR Master Mix (Qiagen), Coral Load Concentrate (Qiagen), and 0.3 μM forward and 5′ biotinylated reverse pri-mers. PCR conditions were 45 cycles at 95 °C for 30 s, 50 °C for 30 s, and 72 °C for 30 s The PCR product was bound to strep-tavidin Sepharose beads (Amersham Biosciences) and then pu-rified, washed, denatured, and washed again. Then, 0.3 μmol/L pyrosequencing primer was annealed to the purified PCR product. Pyrosequencing reactions were performed in the PSQ HS 96 Pyro-sequencing System. The degree of methylation was expressed as the percentage of methylated cytosines divided by the sum of methylated and unmethylated cytosines. To validate the PCR pyrosequencing assay, each CpG dinucleotide position was as-sayed in triplicate and averages were used in the final analysis. The primer sequences are shown inDataset S3.
Plasmid Construction.To generate a doxycycline (Dox)-inducible KLF4 expression vector, the KLF4 ORF was cloned into PB/TA/ ERN (10) using the Gateway LR reaction system (Life Tech-nologies). Short hairpin RNA sequences were inserted into the AgeI/EcoRI site of pMKO.1-puro (11) (Addgene). To generate a shRNA expression vector for ESCs/iPSCs, a BglII/EcoRI frag-ment of each shRNA construct was transferred into the BamHI/ MfeI site of PB/CAG-GIP/BP. All inserted fragments were veri-fied by sequencing. Target sequences of shRNAs are as follows; LTR7-1 (CCT GTT TGG TGG TCT CTT CAC), LTR7-2 (TGT TTG GTG GTC TCT TCA CAC), long intergenic non-protein coding RNA, regulator of reprogramming (lincRNA-RoR) (AAG CCT GAG AGT TGG CAT GAA), and KLF4 (GAT CAA GCA GGA GGC GGTC TC).
ChIP.For the ChIP assay of exogenous reprogramming factors, such as OCT3/4, SOX2, and KLF4, 3× Flag-tagged factors or nontagged factors were transduced into HDFs using a PLAT-E– produced retroviral system. These cells were harvested at 3 d posttransduction. Cells were fixed with 1% formaldehyde and quenched with 125 mM glycine. Fixed cells were sequentially treated with LB1 [50 mM Hepes-KOH, pH 7.5, 140 mM NaCl, 1 mM EDTA, 10% (wt/vol) glycerol, 0.5% Nonidet-P 40, and 0.25% TritonX-100], LB2 (10 mM Tris·HCl, pH 8.0, 200 mM NaCl, 1 mM EDTA, and 0.5 mM EGTA), LB3 (10 mM Tris·HCl, pH 8.0, 100 mM NaCl, 1 mM EDTA, 0.5 mM EGTA, and 0.1% sodium deoxycholate) to obtain nuclear extracts. Chromatin samples were sheared by treatment with a Misonix Astrason S-3000 sonicator (ON, 30 s; OFF, 1 min; Power, 7.0; 15 cycles). A one-tenth volume of 10% (wt/vol) TritonX-100 solution was added to the cell lysates to obtain cleared supernatants after centrifugation. To reduce the nonspecific background, the chromatin samples were incubated with normal IgG (Santa Cruz) linked to Dynabeads (Life Technologies) for 30 min at 4 ° C. After removal of the beads, the cleared lysates were incubated with a Dynabead-conjugated antibody overnight at 4 °C with constant rotation. After incubation, the beads were washed twice each with Wash buffer 1 (20 mM Tris·HCl, 8.0, 150 mM NaCl, 2 mM EDTA, 1% TritonX-100, and 0.1% SDS), wash buffer 2 (20 mM Tris·HCl, pH 8.0, 500 mM NaCl, 2 mM EDTA, 1% TritonX-100, and 0.1% SDS), wash buffer 3 (10 mM Tris·HCl, pH 8.0, 250 mM lithium chloride, 1 mM EDTA, 1% Nonidet-P 40, and 1% sodium deoxycholate), and TE buffer (10 mM Tris·HCl, pH 8.0 and 1 mM EDTA). The beads were then incubated with elution buffer (25 mM Tris·HCl, pH 7.5, 5 mM EDTA, and 0.5% SDS) supplemented with 0.4 mg/mL protease K (Nacalai tesque) at 42 °C for 1 h and then at 65 °C overnight with constant rotation. Eluates were purified using a Qiaquick PCR purification kit (Qiagen).
Multiplexed ChIP-seq libraries were prepared from 10 ng of immunoprecipitated DNA fragments using NEBNext ChIP-seq Library Prep Master Mix (New England BioLabs). For sequencing using GAIIx (Illumina), cluster generation was performed using TruSeq SR Cluster Kit v2 (Illumina). Each lane of flow cells contained one sample. Sequencing was performed in single-read run mode with a total 76 cycles, including a 75-bp read and one cycle for phasing. For sequencing using HiSeq2000 (Illumina), cluster generation was performed using TruSeq SR Cluster Kit v3 (Illu-mina) and six indexed libraries were loaded into each lane of flow cells. Sequencing was performed in multiplexed single-read run mode with total 86 cycles, including 6 cycles for reading the index sequence. Peak call was executed using a model-based analysis of the ChIP-seq algorithm (MACS) v1.4.0rc2 with default parameters. RNA-Seq Library Preparation and Sequencing.DNase-treated RNA (100 ng) was used to prepare individually indexed and strand-specific RNA-seq libraries using a TruSeq Stranded Total RNA sample prep kit (Illumina). Briefly, ribosomal RNA was depleted using a Ribo-Zero Gold kit (AR Brown), followed by RNA fragmentation, cDNA synthesis, end repair, A-base addition, and ligation with Illumina-indexed adaptors. Cluster generation was performed using a TruSeq PE cluster Kit v3 on an Illumina cBot instrument. Six indexed libraries were loaded into each lane of flow cells. Sequencing was performed on a Hiseq2000 in multi-plexed paired-read run mode with a total of 208 cycles, including 6 cycles for reading the index sequence.
Data Analysis of Deep Sequencing.Conversion of Bcl into Fastq format was achieved using the configureBclToFastq.pl program, a part of CASAVA 1.8.2 (Illumina). Sequence reads were then aligned to the human genome (GRCh37/hg19) using the paired-end mode of the BWA v0.5.9rc1 and SAMtools v0.1.17 (ChIP-seq), or TopHat2 software (RNA-seq). Aligned sequence tags were vi-sualized using GenomeJack v2.1 (Mitsubishi Space Software).
Quantitative Expression Analysis of Repeat Sequences. Repeat-Masker open-3.3.0 (www.repeatmasker.org), a database of hu-man repetitive sequences, was applied to reference sequences of LTR7 and LINE-1. The LTR7 sequence was from LTR/endog-enous retrovirus (ERV)-1 in the database, including LTR7, LTR7A, LTR7B, LTR7C, and LTR7Y, and 3771 LTR7 regions were found. The number of LINE-1 regions (LINE/L1 in the database) was 979,568. For RNA-seq, the number of sequence reads aligned with the LTR7-coding region by TopHat2 was counted using the Partek Genomics Suite. Sample-to-sample variation was normalized as follows: normalized number of se-quence tags on LTR7 = number of reads aligned with the LTR7 region/total number of hg19-mappable sequence tags.
Single-Cell Expression Analysis.Single-cell suspensions prepared by treatment with 0.25% trypsin/1 mM EDTA were incubated with PE-conjugated TRA-1-60 and DAPI. TRA-1-60 (+)/DAPI (−) cells were directly sorted into PCR master mix using the FACS Aria II. The template for single-cell PCR was prepared using CellsDirect reagent (Life Technologies). Preamplification of the target sequences was performed for 22 cycles. Subsequent PCR
and data collection were conducted with a Biomark system (Flu-idigm). Each sample was validated based on expression of G3PDH or ACTB, with a Ct value < 15. Ct values > 26 were taken to indicate no expression and were unified as 100 for calculation of ΔCt. We used following Taqman assays; abhydrolase domain containing 12B (ABHD12B) (Hs00997975_g1), HERV-H LTR-associating 1 (HHLA1) (Hs00903176_g1) and chromosome 4 open reading frame 51 (C4ORF51) (Hs03037752_m1).
Southern Blotting. Genomic DNA (3–5 μg) was digested with restriction enzymes overnight. Digested DNA were separated on a 0.8% agarose gel and transferred to a nylon membrane (Amersham Biosciences). The membrane was incubated with digoxigenin (DIG)-labeled DNA probe in DIG Easy Hyb buffer (Roche) at 42 °C overnight with constant rotation. After washing, alkaline phosphatase-conjugated anti-DIG antibody (1:10,000; Roche) was added to the membrane. Signals were produced with CDP-star reagent (Roche) and detected using a LAS3000 imag-ing system (Fuji Film). Primer sequences for generation of probes are shown inDataset S3.
1. Morita S, Kojima T, Kitamura T (2000) Plat-E: An efficient and stable system for transient packaging of retroviruses. Gene Ther 7(12):1063–1066.
2. Thomson JA, et al. (1998) Embryonic stem cell lines derived from human blastocysts. Science 282(5391):1145–1147.
3. Suemori H, et al. (2006) Efficient establishment of human embryonic stem cell lines and long-term maintenance with stable karyotype by enzymatic bulk passage. Biochem Biophys Res Commun 345(3):926–932.
4. Takahashi K, et al. (2007) Induction of pluripotent stem cells from adult human fibroblasts by defined factors. Cell 131(5):861–872.
5. Tanabe K, Nakamura M, Narita M, Takahashi K, Yamanaka S (2013) Maturation, not initiation, is the major roadblock during reprogramming toward pluripotency from human fibroblasts. Proc Natl Acad Sci USA 110(30):12172–12179.
6. Takahashi K, et al. (2014) Induction of pluripotency in human somatic cells via a transient state resembling primitive streak-like mesendoderm. Nat Commun 5:3678. 7. Oldershaw RA, et al. (2010) Directed differentiation of human embryonic stem cells
toward chondrocytes. Nat Biotechnol 28(11):1187–1194.
8. Kajiwara M, et al. (2012) Donor-dependent variations in hepatic differentiation from human-induced pluripotent stem cells. Proc Natl Acad Sci USA 109(31):12538–12543. 9. Mae S, et al. (2013) Monitoring and robust induction of nephrogenic intermediate
mesoderm from human pluripotent stem cells. Nat Commun 4:1367.
10. Woltjen K, et al. (2009) piggyBac transposition reprograms fibroblasts to induced pluripotent stem cells. Nature 458(7239):766–770.
11. Masutomi K, et al. (2003) Telomerase maintains telomere structure in normal human cells. Cell 114(2):241–253.
TRA-1-60 (+) cells (%) 0 10 20 30 40 50 60
TKCBV5-6-derived TIG118-4F1-derived 451F3-derived
1 2 3 4 5 6 7 8 9 10 11 12 13 14 15P1 2 3 4 5 6 7 8 9 10 11 12P1 2 3 4 5 6 79 10 11 12 13 14 1517P 1 2 3 4 5 6 7 8 9 10 P H9-derived 1 kb 4 kb 1 2 3 4 5 6 7 8 9 10 11 12 P TIG118-4F1 PS BSD probe BamHI/EcoRI BSD probe 2 kb 20 19 22232425 263037 41 P TIG108-4F3 PS ESC BamHI/EcoRI/NcoI c-MYC probe 2 kb 10 kb 1 23 4 5 6 7 8 9 10 12 13 P TKCBV5-6 PS ESC iPSC (201B7) BglII/EcoRI/NcoI 11 1415
A
B
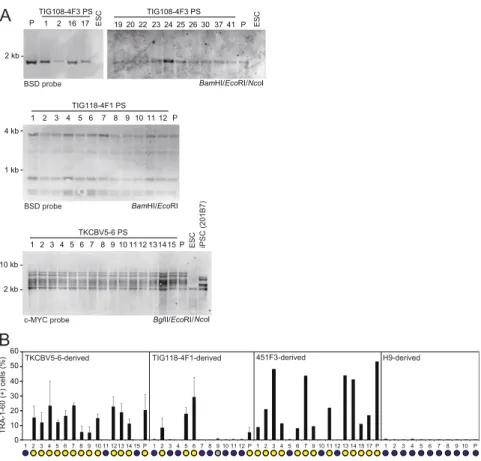
2 1 1617 P TIG108-4F3 PS ESCFig. S1. Subcloning of DD-iPSCs. (A) Monoclonal origin of iPSC subclones. The genomic DNA of the subclones derived from TKCBV5-6, TIG108-4F3, and TIG118-4F1 by Southern blotting. Restriction enzymes and probes used for each clone are shown. For subclones derived from the 451F3 integration-free iPSC clone, short tandem-repeat analyses were performed for 16 loci (D3S1358, TH01, D21S11, D18S51, Penta_E, D5S818, D13S317, D7S820, D16S539, CSF1PO, Penta_D, AMEL, vWA, D8S1179, TPOX, and FGA). (B) Percentages of TRA-1-60 (+) cells 14 d after neural induction of each primary subclone and parental cells (P) analyzed by flow cytometry. Blue and yellow circles indicate normal and DD-iPSC subclone, respectively. n = 2–3. Error bars are SDs.
d42 d42 d42 d35 d35 d35 d49 d49 d49 d28 d28 d28 d28 d20 d20 d20 d20 Normal iPSC Normal iPSC Normal iPSC Normal iPSC Normal iPSC Normal iPSC Normal iPSC Normal iPSC Normal iPSC Normal iPSC Normal iPSC Normal iPSC Normal iPSC Normal iPSC Normal iPSC Normal iPSC Normal iPSC Normal iPSC d0 d0 d0 d0 d3 d3 d3 d11 d15 d15 d15 d11 d11 d7 d7 d7 DD-iPSC DD-iPSC DD-iPSC DD-iPSC DD-iPSC DD-iPSC DD-iPSC DD-iPSC DD-iPSC DD-iPSC DD-iPSC DD-iPSC DD-iPSC DD-iPSC DD-iPSC DD-iPSC DD-iPSC DD-iPSC DD-iPSC DD-iPSC DD-iPSC DD-iPSC DD-iPSC DD-iPSC DD-iPSC DD-iPSC DD-iPSC DD-iPSC DD-iPSC DD-iPSC DD-iPSC DD-iPSC DD-iPSC DD-iPSC DD-iPSC DD-iPSC DD-iPSC ESC ESC ESC ESC
Fig. S2. Reproducibility of DD-iPSC related gene expression. Shown are the hierarchical clustering of 144 DD-iPSC marker expression in parental HDFs [day (d) 0], intermediate reprogrammed cells at the indicated time points (days 3–49), ESCs, normal iPSCs, and DD-iPSCs.
0 2 4 6 8 10
Fold change (Log
2 ) HDF ASC HA NHBE ABHD12B HHLA1 C4ORF51 lincRNA-RoR 12
Fig. S3. The expression of DD-iPSC markers in TRA-1-60 (+) cells from various origins. Fold-increases of ABHD12B, HHLA1, C4ORF51, and lincRNA-RoR ex-pression in TRA-1–60 (+) intermediate reprogrammed cells on day 28 compared with original somatic cell lines, determined by microarray. ASC, adipose tissue-derived mesenchymal stem cells; HA, human astrocytes; NHBE, normal human bronchial epithelium. n = 3. Error bars are SDs.
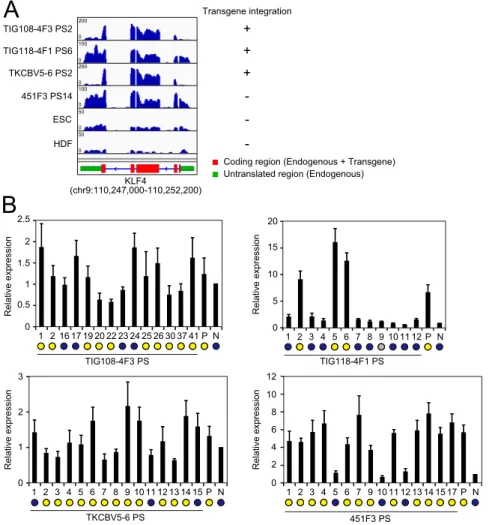
TIG108-4F3 PS2 TIG118-4F1 PS6 TKCBV5-6 PS2 451F3 PS14 ESC HDF Transgene integration + + + -200 150 250 100 50 50 0 0 0 0 0 0
Coding region (Endogenous + Transgene) Untranslated region (Endogenous) KLF4 (chr9:110,247,000-110,252,200)
A
B
TKCBV5-6 PS 1 2 3 4 5 6 7 8 9 10 11 12 13 14 15P N 0 1 2 3 Relative expression 0 5 10 15 20 Relative expression 1 2 4 5 6 7 8 9 10 11 12 TIG118-4F1 PS P N 3 451F3 PS 1 2 3 4 5 6 7 9 10 11 12 13 14 15 17 P N 0 2 4 6 8 10 12 Relative expression TIG108-4F3 PS 2 16 17 19 20 222324 25 26 30 37 41P N 0 1 2 2.5 Relative expression 1.5 0.5 1Fig. S4. KLF4 transcripts in DD-iPSCs. (A) The histogram shows the representative transcription patterns of KLF4 in DD-iPSC primary subclones (PS), ESCs, and HDFs analyzed by RNA-seq. Red and green box indicate protein coding region (common in transgene and endogenous locus) and untranslated region (only in endogenous locus), respectively. (B) The relative expression of endogenous KLF4 in DD-iPSCs and their primary subclones (PS) compared with those in normal iPSCs (N) analyzed qRT-PCR. Blue and yellow circles indicate normal and DD-iPSC subclones/parents, respectively. n = 3. Error bars are SDs.
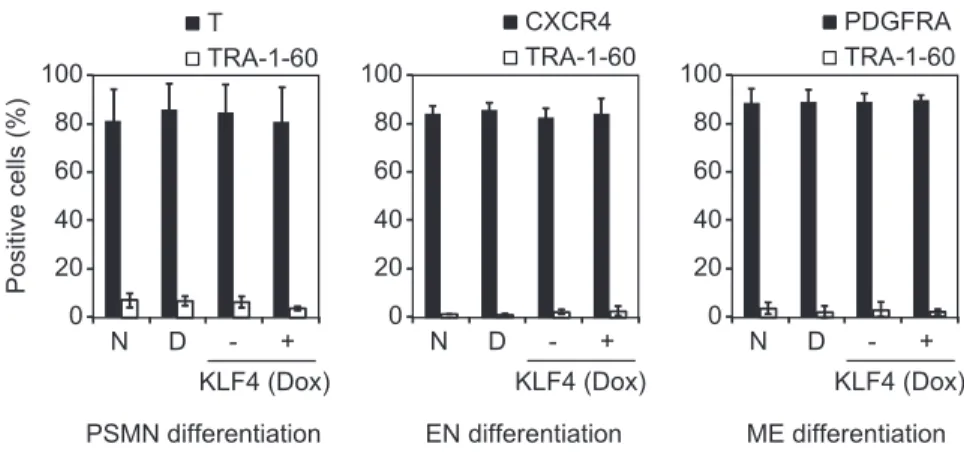
N D KLF4 (Dox) + -0 20 40 60 80 100 CXCR4 TRA-1-60 N D KLF4 (Dox) + -0 20 40 60 80 100 PDGFRA TRA-1-60 N D KLF4 (Dox) + -0 20 40 60 80 100 T TRA-1-60 Positive cells (%)
PSMN differentiation EN differentiation ME differentiation
Fig. S5. Differentiation potential of DD-iPSCs and KLF4-overexpressing iPSCs. Normal iPSCs (N), DD-iPSCs (D), and normal iPSCs transduced with Dox-inducible KLF4 were differentiated into primitive streak-like mesendoderm (PSMN), endoderm (EN), or mesoderm (ME) in the conditions with (+) or without (–) Dox. Closed bars in each graph represent the differentiation efficiencies into PSMN, EN, and ME evaluated by immunostaining with T, CXCR4, and PDGFRA, re-spectively. Open bars indicate the percentages of residual undifferentiated cells labeled by TRA-1-60. n = 3. Error bars are SDs.
HHLA1
40 60 80
20
0 OSKM OSNM* ESC
TRA-1-60 (+) N HDF Relative expression ABHD12B 100 101 102 103
OSKM OSNM ESC
TRA-1-60 (+) N HDF * HERV-H 100 150 300 50 0 250 200 Relative expression
OSKM OSNM ESC
N HDF TRA-1-60 (+) *
B
C
D
ESC KLF4 (Total) 100 101 102 103 OSKM OSNM TRA-1-60 (+) N HDF * Relative expression KLF4 (Endo) 0 6 8 10 OSKM OSNM TRA-1-60 (+) N HDF 2 4 ESCA
0 4 8 12 16TRA-1-60 (+) cells (%) OSM OSKM OSNM* 0 0.2 0.4 0.6 0.8 1 1.2
Relative No. of iPSC colonies
OSKM OSNM*
OSM
Fig. S6. The effect of exogenous NANOG homeobox (NANOG) on human ERV-H (HERV-H) activity. (A) Low reprogramming activity of NANOG. Shown are the proportion of TRA-1-60 (+) cells on day 7 posttransduction of indicated factors (Left) and relative numbers of iPSC colonies counted on day 28 compared with those induced by OCT3/4, SOX2, KLF4, and c-MYC (OSKM) (Right). Error bars are SD. n = 3. *P < 0.05 vs. OSKM was calculated by t test. (B) NANOG does not enhance KLF4 expression. Shown are the relative expression of endogenous (Endo) and total KLF4 in HDFs, TRA-1-60 (+) cells induced by OSKM or OSNM (OSM with NANOG instead of KLF4) on day 7, normal iPSCs (N), and ESCs compared with those in HDFs, revealed by qRT-PCR. Each value was normalized to that of G3PDH. n = 3. Error bars are SD. *P < 0.05 vs. OSKM was calculated by t test. (C) Low activity of NANOG for HERV-H induction. Shown are the relative ex-pression of HERV-H in HDFs, TRA-1-60 (+) cells induced by OSKM or OSNM on day 7, normal iPSCs (N), and ESCs compared with those in HDFs, revealed by qRT-PCR. Each value was normalized to that of G3PDH, and then the value of Mock was adjusted to be 1. n = 3. Error bars are SD. *P < 0.05 vs. OSKM was calculated by t test. (D) NANOG slightly enhanced the expression of LTR7-related genes. Shown are the relative expressions of LTR7-related genes ABHD12B and HHLA1 in HDFs, TRA-1-60 (+) cells induced by OSKM or OSNM on day 7, normal iPSCs (N), and ESCs compared with those in HDFs, revealed by microarray. n = 3. Error bars are SD. *FDR < 0.05 vs. OSKM was calculated by t test.
Dataset S1. Short tandem-repeat analyses of 451F3 subclones
Dataset S1
Shown are the results of short tandem-repeat analyses for 16 loci (D3S1358, TH01, D21S11, D18S51, Penta_E, D5S818, D13S317, D7S820, D16S539, CSF1PO, Penta_D, AMEL, vWA, D8S1179, TPOX, and FGA) in 451F3 integration-free parental iPSCs (P) and its primary subclones (PS).
Dataset S2. DD-iPSC markers
Dataset S2
Microarray probes, genomic location, and gene symbols of iPSC marker genes, P values and fold-change (FC) for comparison between normal and DD-iPSC subclones.
Dataset S3. Primer sequences used in the study
Dataset S3
The purposes, targets and sequences of primers used in this study are listed.
![Fig. S2. Reproducibility of DD-iPSC related gene expression. Shown are the hierarchical clustering of 144 DD-iPSC marker expression in parental HDFs [day (d) 0], intermediate reprogrammed cells at the indicated time points (days 3–49), ESCs, normal iPSCs,](https://thumb-eu.123doks.com/thumbv2/123doknet/6806813.189279/11.877.196.677.75.889/reproducibility-expression-hierarchical-clustering-expression-intermediate-reprogrammed-indicated.webp)