HAL Id: inserm-00677106
https://www.hal.inserm.fr/inserm-00677106
Submitted on 19 Jun 2012
HAL is a multi-disciplinary open access
archive for the deposit and dissemination of
sci-entific research documents, whether they are
pub-lished or not. The documents may come from
teaching and research institutions in France or
abroad, or from public or private research centers.
L’archive ouverte pluridisciplinaire HAL, est
destinée au dépôt et à la diffusion de documents
scientifiques de niveau recherche, publiés ou non,
émanant des établissements d’enseignement et de
recherche français ou étrangers, des laboratoires
publics ou privés.
A contrario detection of focal brain perfusion
abnormalities based on an Arterial Spin Labeling
template
Camille Maumet, Pierre Maurel, Elise Bannier, Jean-Christophe Ferré,
Christian Barillot
To cite this version:
Camille Maumet, Pierre Maurel, Elise Bannier, Jean-Christophe Ferré, Christian Barillot. A contrario
detection of focal brain perfusion abnormalities based on an Arterial Spin Labeling template. 9th IEEE
International Symposium on Biomedical Imaging (ISBI), May 2012, Barcelona, Spain. pp.1176-1179.
�inserm-00677106�
A CONTRARIO DETECTION OF FOCAL BRAIN PERFUSION ABNORMALITIES
BASED ON AN ARTERIAL SPIN LABELING TEMPLATE
Camille Maumet
1,2,3
, Pierre Maurel
1,2,3, Elise Bannier
1,2,3, Jean-Christophe Ferr´e
1,2,3,4, Christian Barillot
1,2,3 1INRIA, VisAGeS Project-Team, F-35042 Rennes, France
2
INSERM, U746, F-35042 Rennes, France
3
University of Rennes I, CNRS, UMR 6074, IRISA, F-35042 Rennes, France
4
CHU Rennes, Department of Neuroradiology, F-35033 Rennes, France
ABSTRACT
Arterial Spin Labeling (ASL) is a recent MRI perfusion technique which enables quantification of cerebral blood flow (CBF). The pres-ence of regions with atypical CBF can characterize a pathology. In brain tumors for instance, perfusion increase can be directly related to the grading of the malignant tissues. It is therefore of great inter-est to identify these regions in order to provide the patients with the most appropriate therapy.
In this paper, we propose to detect abnormal brain perfusion by using an a contrario framework and an ASL template as a model of normal perfusion. Validation was undertaken by qualitative compar-ison with CBF extracted from dynamic susceptibility weighted con-trast enhanced (DSC) imaging. We experimented this framework on four patients presenting brain tumors.
Results show that high perfusion regions found in DSC CBF maps are correctly identified as hyperperfusions with a contrario tection. Automatic detection has clear advantages over manual de-lineation since it is less time-consuming, does not depend on medical expertise and allows quantification of perfusion abnormalities within the detected regions.
Index Terms— Arterial spin labeling, Cerebral blood flow, Template, a contrario detection.
1. INTRODUCTION
Brain perfusion is the biological process through which a complex blood system operates in order to supply each region of the brain with oxygen and nutrients. Cerebral Blood Flow (CBF), expressed in mL/100g/min, represents the quantity of blood (in mL) supplied to 100g of tissue per minute. This measure is an indicator of the well-being of the tissues.
Dynamic susceptibility-weighted contrast enhanced (DSC) MRI is the reference method to estimate CBF with MRI. It is based on the injection of a bolus of contrast agent and first pass imaging. CBF can be estimated, along with cerebral blood volume (CBV) and mean transit time (MTT). Arterial Spin Labeling (ASL) is a recent sequence [1] using the blood as an endogenous tracer. This sequence relies on the acquisition of pairs of images acquired with and without prior labeling of the blood in the brain feeding arteries. The differ-ence between labeled and unlabeled images reflects local perfusion. ASL is entirely non invasive and can ease the measure of CBF in patients with difficult venous access such as children, healthy volun-teers or pregnant women. Besides the use of an endogenous tracer, its inherent non-invasivity allows repetitive acquisitions and is well adapted for longitudinal studies. However, this comes at the cost of
lower spatial resolution and smaller signal to noise ratio compared to DSC.
Brain perfusion varies between individuals and depends on sev-eral parameters including age and sex. Some pathologies are char-acterized by the presence of brain regions having a level of perfu-sion outside a normal range, namely hyperperfused or hypoperfused regions. A better understanding of individual focal perfusion abnor-malities could therefore lead to the definition of new biomarkers and help to draw a more complete picture of complex pathologies. Ab-normal CBV and CBF in brain tumors are well documented [2–5]. Based on DSC or ASL, measures of focal perfusion abnormalities in tumorous tissues can ease tumor grading [2–4] or discriminating post-radiation necrosis from tumor recurrence [5]. Both are impor-tant issues in order to supply the patient with the most appropriate therapy. However these analyses are usually based on manual delin-eation of regions of interest, a time-consuming task, prone to inter-rater variability.
The purpose of this paper is to introduce a new method for auto-matic detection of pathological focal perfusion abnormalities, based on an a contrario detection framework using a statistical model of perfusion in healthy subjects (ASL template). Section 2 presents the proposed method for ASL template creation and a contrario de-tection. The experimental framework is outlined in section 3 and section 4 deals with the results. A brief discussion is proposed in section 5.
2. METHOD 2.1. ASL template creation
The template construction was performed as described in [6] from the ASL CBF maps of healthy subjects. The template is made of two maps describing the mean and standard deviation of the normal law N(µv, σ2v) defined in each voxel v. Due to differences in brain
coverage, voxels where data was available for less than 15 subjects were discarded. This ASL template represents a model of normal cerebral perfusion in the different parts of the brain. This model will be used in the a contrario framework as the so-called background model.
2.2. A contrario detection of focal perfusion abnormalities The a contrario approach is a statistical framework inspired from the Gestalt laws of perception introduced in [7]. This theory has been applied to medical image processing, for instance for opacities detection in mammography [8] or epileptogenic zone detection [9].
The a contrario approach is based on the definition of a back-ground model. An event contradicting this model is a candidate for detection. The contradiction level is evaluated using a criterion called Number of False Alarms (NFA), corresponding to the average number of false detections in the background. The occurrence of an event corresponding to a very low value of NFA is very unlikely ac-cording to the background model. The detection threshold is denoted by ǫ and usually set to 1. The detections therefore verify NFA≤ ǫ and are called ǫ-significant. This method allows to correct for mul-tiple comparisons and is linked to Bonferroni correction as outlined in [10]. Background model definition and NFA calculation are at the core of the detection problem. Similarly to [10] we propose to use the Gaussian laws defined by our ASL template as background model.
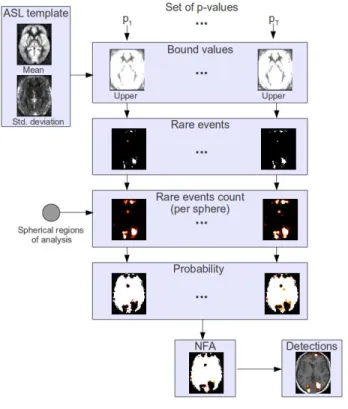
Fig. 1. Pipeline of a contrario detection of hyperperfusions. Detec-tion of hypoperfusions is similar except that lower bound values are computed in the first step.
Figure 1 describes the pipeline of the a contrario detection of hyperperfusions. First of all, we define a set of p-values P = p1, p2, ..., pT. For each normal law N(µv, σv2) defined in
each voxel v, and each p-value pi, we determine the corresponding
smaller and upper values. In the map to be compared to the tem-plate, a voxel with an associated value overtaking at least one of these bounds corresponds to a rare event. Thus, given a CBF map to be compared to the template, we first select the voxels that are rare events with respect to the ASL template for each p-value in set P .
A set of regions of analysis, in this case spheres, is chosen so that the NFA will be computed in each region. On each region, we count the number of rare events and get the corresponding probability of getting such a number given the probability of occurrence of a rare event pi. Let k be the number of rare events in sphere s composed
of n voxels, then for p-value pi, the probability of having k or more
rare events, is defined by the tail of the binomial distribution: πis= P (X ≥ k), where X ∼ B(n, pi). (1)
Therefore, for each p-value, pi, we have a probability per sphere,
leading to a probability per voxel πivconsidering that a detection in
a given voxel is determined by its neighborhood.
This probability map is converted into NFA map according to: NFAs= S.T.min(πsi), (2)
where S is the number of spheres and T is the cardinal of set P . The NFA map is then thresholded: regions where NFA> ǫ are discarded in order to obtain ǫ-significant spheres.
To the aim of discriminating hypoperfusions from hyperperfu-sions, the upper and lower bounds associated to a p-value are stud-ied separately. Then S is increased twofold since twice as many tests are performed. Due to the neighborhood constraint, a voxel can be detected both as hyperperfused and hypoperfused. To avoid this con-fusing situation, we added the constraint that a voxel can be outlined as hypoperfused (resp. hyperperfused) only if its value is smaller (resp. greater) than the template mean.
3. EXPERIMENTS 3.1. Data acquisition
Thirty healthy volunteers (14 males, 16 females, mean age:28.0 ± 6.6 year-old) and four patients (1 male, 3 females, ages: 58.7, 77.8, 54.9 and 54.8 year-old) presenting identified tumors were involved in this study. Data acquisition was performed on a 3T Siemens Verio MR scanner with a 32-channel head-coil. The healthy subjects were involved in a broader study, only the se-quences described hereafter were exploited in the context of this study. Patients were scanned in the context of clinical practice. The imaging protocol included a 3D T1-weighted anatomical sequence (T1w) (TR: 1900ms/TE: 2.27ms/FOV: 256x256x176mm3/flip an-gle: 9◦/resolution: 1x1x1mm3), a PICORE Q2TIPS sequence with
crusher gradients (TR: 3000ms/TE: 18ms/FOV: 192x192mm2/flip angle: 90◦/in plane resolution: 3x3mm2/slice thickness:
7mm/inter-slice gap: 0.7mm/TI: 1700ms/T Iwd: 700ms/60 repetitions). In
addi-tion to these sequences, the patients also underwent a DSC sequence (GRE EPI/TR: 1500ms/TE: 30ms/FOV: 230x230mm2/flip angle: 90◦/in plane resolution: 1.8x1.8mm2/slice thickness:
4mm/inter-slice gap: 1.2mm) and 3D T1w post gadolinium (T1w-Gd) se-quence (TR: 1900ms/TE: 2.27ms/FOV: 250x250x176mm3/flip an-gle: 9◦/resolution: 1x1x1mm3).
3.2. Pre-processing
Image pre-processing was performed using SPM8 (Wellcome De-partment of Imaging Neuroscience, University College, London). The anatomical image of each subject was segmented into grey mat-ter (GM), white matmat-ter and cerebrospinal fluid using the unified seg-mentation [11]. For each subject, an anatomical brain mask was created, excluding voxels with less than 50% of brain tissue.
A six-parameter rigid-body registration of the ASL volumes was carried out in order to reduce undesired effects due to subject motion. Coregistration on GM was then performed based on normalised mu-tual information. The average of unlabeled volumes was used to estimate the geometrical transformation to apply to each volume.
The 60 unlabeled and labeled ASL volumes were pair-wise sub-tracted and averaged in order to obtain a perfusion weighted map per
subject. A standard kinetic model [12] was then applied in order to get ASL CBF, according to the following equation:
f= λ.∆M
2.α.T Iwd.exp−(T I+idxsl∗T Isl)/T 1b.M0 (3) where f is the CBF map, M0is the acquired M0map, λ = 0.9mL.g−1
is the blood/tissue water partition coefficient, α = 0.95 mea-sures the labeling efficiency,∆M is the perfusion weighted map, T I = 1700ms is the inversion time of the ASL sequence, idxslis the
slice index, starting from 0 for the first acquired slice, T Isl= 45ms
is the duration of acquisition of one slice, T Iwd = 700ms is the
temporal width of the bolus, T1b= 1500ms is the T1 of blood [13].
In order to account for inter-subject variations in CBF [1], each map was normalised by the mean perfusion value computed from all voxels containing more than 70% of GM [6]. Since tumorous tissue is often considered as GM in basic SPM segmentation (no extra class definition to model the tumor), we could not apply the same intensity normalisation to the patient maps. Thus, for each patient map, we iteratively estimated the normalisation factor that would lead to the best fit to the model defined by the template when excluding 10% of the voxels.
Spatial normalisation parameters estimated during the segmen-tation step were then applied to the T1w and ASL CBF map in order to normalise the subjects into the ICBM template space [14].
The DSC images were processed using MR manufacturer soft-ware by manually choosing an arterial input function to calculate CBF and MTT maps. Similarly to ASL, DSC CBF map were coreg-istered on GM and spatially normalised.
ASL template construction was performed from the ASL CBF maps of the 30 healthy subjects involved in this study. Four subjects were excluded for excessive motion (>1mm or >1◦ between two
successive volumes), one because of strong ghosting artefacts and one because of abnormally low signal.
3.3. Implementation of a contrario detections
An in-house software was implemented under Matlab for a con-trario detection of focal perfusion abnormalities and applied to the ASL CBF maps of the four patients with brain tumors. In the a contrario framework, the radius of the spherical regions of analy-sis was set to 2 voxels. We chose the following set of p-values: P= {0.001, 0.005}.
4. RESULTS
Figure 2 presents the hypoperfusions and hyperperfusions detected on each subject overlaid on the T1w map along with the T1w-Gd, DSC CBF and ASL CBF maps.
Subject 1 presents a meningioma of both occipital lobes. Three foci of hyperperfusion are identified in the tumor and coincide with large CBF values on both CBF maps. One hypoperfusion focus is located in the surrounding of the tumor. The right part corresponds to a low CBF value on both ASL and DSC CBF maps. The left part might be due to signal lowering in ASL CBF map induced by a longer transit time. Other small hypoperfusions are detected in the insula and pallidum regions. They could correspond to artefactual low perfusion values in the ASL CBF map, absent from the DSC CBF map. Three hypoperfusions in the occipital lobe and two hy-perperfusions in the frontal lobe, presenting a typical corolla shape, can be attributed to motion artefacts.
Subject 2 presents a high grade tumor in the left frontal lobe. On the T1w-Gd map, the contrast is enhanced on the right side of the
Fig. 2. A contrario detection of pathological focal perfusion ab-normalities on 4 patients with brain tumors. From top to bottom: T1w-Gd anatomical map, T1w map with detections (−log10(NFA))
- hypoperfusions (winter map) and hyperperfusions (hot color-map) - overlaid, DSC CBF map, ASL CBF map. Images are dis-played in neurological convention. The largest foci of detections are coherent with evidence from DSC CBF map.
tumor towards the medial part of the brain. The DSC CBF map out-lines a region of high perfusion surrounding the tumor and covering the region enhanced on the T1w-Gd map. As expected, the central necrosis displays a very low perfusion level. The ASL CBF map is coherent. On the detection map, one hyperperfusion is outlined around the tumor overlapping the region of high perfusion present on both CBF maps. Part of the central necrosis is identified as hy-poperfusion. Other probably artefactual hypoperfusions are detected biparietally and, on the right, frontally. We hypothesize that these artefactual detections might be explained by a too short TI for this old (77.8 years) patient with probably increased transit times.
Subject 3 presents a high grade tumor in the left temporal lobe. On the T1w-Gd map, the contrast is enhanced around the tumor with a larger zone on the left in the posterior part of the tumor. The DSC CBF map outlines a high level of perfusion around the tumor, coin-ciding with the contrast enhancement of the T1w-Gd map. The ASL CBF map is coherent. The detection map outlines the most lateral part of the high perfusion ring, on the left. Another focus of hy-perperfusion is observed on the opposite side of the ring. A small hypoperfusion is detected outside the tumor corresponding to a low signal on both CBF maps.
Subject 4 presents a high grade tumor in the right temporo-parietal lobe. On the T1w-Gd map, the contrast is enhanced around the tumor, while the central part of the tumor displays a low signal. The DSC CBF map outlines a low perfusion level inside the tumor and a small area of high perfusion forward the tumor. The ASL CBF map is very artefacted. We can however distinguish a very low level of perfusion on the right part of the brain encompassing the tumor site. On this map, the left frontal part of the brain has a very low perfusion as well, while this is not the case on the DSC CBF map. This might be the consequence of motion artefacts. In the detection map, the tumor is detected as a hypoperfusion in concordance with the DSC CBF map. A couple of artefactual hypoperfusions are seen in the frontal and occipital lobes due to motion artefacts. A small hyperperfusion is detected.
Thus, on all subjects, the largest foci of hypoperfusions and hy-perperfusions are coherent with evidence from the DSC CBF maps.
5. DISCUSSION AND CONCLUSION
In this paper, we have demonstrated the capability to automatically detect hypoperfusions and hyperperfusions jointly using an ASL per-fusion template and an a contrario framework. Improving the pre-processing of the ASL sequence might reduce the artefacts seen on the ASL CBF map and therefore reduce artefactual detections. Mo-tion is a major source of artefacts, and taking advantage of the re-peated measures performed in ASL might improve the detection. Longer transit times in elderly subjects or patients with neurologi-cal diseases is a known cause of signal lowering in ASL CBF map compared to DSC CBF map. Introduction of new multi-TI ASL se-quences along with adapted quantification models might undercover this issue.
Detection methods based on a statistical model estimated on healthy subjects are inherently limited by the coverage of the model and by the registration to the template. The robustness of registration of T1w images presenting tumors using SPM default normalisation method has been studied [15]. Recent registration algorithms, like DARTEL [16], have improved the accuracy of registration and could be used to increase the detection accuracy. However, their robustness on patients presenting large pathological lesions on T1w still needs to be studied.
This study included four patients and a broader validation on a larger database is ongoing. Further work will include a comparison of the a contrario detection framework with more standard methods like the general linear model, and a validation based on quantitative criteria.
In the context of tumor pathologies, automatic detection of fo-cal perfusion abnormalities could be useful for surgifo-cal planning by identifying the most malignant part of the tumor. Automatic detec-tion of perfusion abnormalities also opens the field to more subtle detections that could not be outlined by visual inspection only.
6. REFERENCES
[1] L. M. Parkes and J. A. Detre, “ASL: Blood Perfusion Measure-ments Using Arterial Spin Labelling,” in Quantitative MRI of
the Brain: Measuring Changes Caused by Disease., P. Tofts, Ed., chapter 13. John Wiley & Sons, Ltd, 2003.
[2] S. Chawla, S. Wang, R. C. Wolf, J. H. Woo, J. Wang, D. M. O’Rourke, K. D. Judy, M. S. Grady, E. R. Melhem, and H. Pop-tani, “Arterial spin-labeling and MR spectroscopy in the
dif-ferentiation of gliomas.,” AJNR, vol. 28, no. 9, pp. 1683–9, 2007.
[3] M. A. Weber, S. Zoubaa, M. Schlieter, E. J¨uttler, H. B. Huttner, K. Geletneky, C. Ittrich, M. P. Lichy, A. Kroll, J. Debus, F. L. Giesel, M. Hartmann, and M. Essig, “Diagnostic performance of spectroscopic and perfusion MRI for distinction of brain tu-mors.,” Neurology, vol. 66, no. 12, pp. 1899–906, 2006. [4] C. Warmuth, M. G¨unther, and C. Zimmer, “Quantification
of Blood Flow in Brain Tumors: Comparison of Arterial Spin Labeling and Dynamic Susceptibility-weighted Contrast-enhanced MR Imaging,” Radiology, vol. 228, no. 4, pp. 523– 532, 2003.
[5] T. Sugahara, Y. Korogi, S. Tomiguchi, Y. Shigematsu, I. Ikushima, T. Kira, L. Liang, Y. Ushio, and M. Takahashi, “Posttherapeutic intraaxial brain tumor: the value of perfusion-sensitive contrast-enhanced MR imaging for differentiating tumor recurrence from nonneoplastic contrast-enhancing tis-sue.,” AJNR, vol. 21, no. 5, pp. 901–9, 2000.
[6] J. Petr, J.-C. Ferre, E. Bannier, H. Raoult, J.-Y. Gauvrit, and C. Barillot, “Construction and evaluation of a quantitative ar-terial spin labeling brain perfusion template at 3T,” in ISBI. 2011, pp. 1035–1038, IEEE.
[7] A. Desolneux, L. Moisan, and J. Morel, “A grouping principle and four applications,” TPAMI, vol. 25, no. 4, pp. 508–513, 2003.
[8] B. Grosjean and L. Moisan, “A-contrario Detectability of Spots in Textured Backgrounds,” JMIV, vol. 33, no. 3, pp. 313–337, 2008.
[9] C. Aguerrebere, P. Sprechmann, P. Mus´e, and R. Ferrando, “A-contrario localization of epileptogenic zones in SPECT im-ages,” in ISBI. 2009, pp. 570–573, IEEE.
[10] F. Rousseau, S. Faisan, F. Heitz, J. P. Armspach, Y. Cheva-lier, F. Blanc, J. de Seze, and L. Rumbach, “An a contrario approach for change detection in 3D multimodal images: ap-plication to multiple sclerosis in MRI.,” EMBS, pp. 2069–72, 2007.
[11] J. Ashburner and K. J. Friston, “Unified segmentation.,”
Neu-roImage, vol. 26, no. 3, pp. 839–51, 2005.
[12] R. B. Buxton, L. R. Frank, E. C. Wong, B. Siewert, S. Warach, and R. R. Edelman, “A general kinetic model for quantitative perfusion imaging with arterial spin labeling.,” MRM, vol. 40, no. 3, pp. 383–96, 1998.
[13] Y. Wang, A. J. Saykin, J. Pfeuffer, C. Lin, K. M. Mosier, L. Shen, S. Kim, and G. D. Hutchins, “Regional reproducibil-ity of pulsed arterial spin labeling perfusion imaging at 3T.,”
NeuroImage, vol. 54, no. 2, pp. 1188–95, 2011.
[14] J. C. Mazziotta, A. W. Toga, A. Evans, P. Fox, and J. Lan-caster, “A Probabilistic Atlas of the Human Brain: Theory and Rationale for Its Development The International Consortium for Brain Mapping (ICBM),” NeuroImage, vol. 2, no. 2, pp. 89–101, 1995.
[15] J. Crinion, J. Ashburner, A. Leff, M. Brett, C. Price, and K. Friston, “Spatial normalization of lesioned brains: perfor-mance evaluation and impact on fMRI analyses.,” NeuroImage, vol. 37, no. 3, pp. 866–75, 2007.
[16] J. Ashburner, “A fast diffeomorphic image registration algo-rithm.,” NeuroImage, vol. 38, no. 1, pp. 95–113, 2007.