HAL Id: dumas-01874179
https://dumas.ccsd.cnrs.fr/dumas-01874179
Submitted on 14 Sep 2018
HAL is a multi-disciplinary open access archive for the deposit and dissemination of sci-entific research documents, whether they are pub-lished or not. The documents may come from teaching and research institutions in France or abroad, or from public or private research centers.
L’archive ouverte pluridisciplinaire HAL, est destinée au dépôt et à la diffusion de documents scientifiques de niveau recherche, publiés ou non, émanant des établissements d’enseignement et de recherche français ou étrangers, des laboratoires publics ou privés.
Elucidating the temporal dynamics of rhizosphere
priming using reverse microdialysis
Lilian Marchand
To cite this version:
Lilian Marchand. Elucidating the temporal dynamics of rhizosphere priming using reverse microdial-ysis. Life Sciences [q-bio]. 2018. �dumas-01874179�
Elucidating the temporal dynamics of rhizosphere
priming using reverse microdialysis.
Par : Lilian Marchand
Soutenu à ANGERS le 7/09/18 Devant le jury composé de :
Président :CHEN Nicolas
Maître de stage :KAISER Christina Enseignant référent :GUÉNON René
Autres membres du jury : LEBEAU Thierry, Juré
Les analyses et les conclusions de ce travail d'étudiant n'engagent que la responsabilité de son auteur et non celle d’AGROCAMPUS OUEST AGROCAMPUS OUEST CFR Angers CFR Rennes * Année universitaire : 2017-2018 Spécialité : HORTICULTURE
Spécialisation (et option éventuelle) : Protection des Plantes et de l’Environnent
Mémoire de Fin d'Études
d’Ingénieur de l’Institut Supérieur des Sciences agronomiques, agroalimentaires, horticoles et du paysage
de Master de l’Institut Supérieur des Sciences agronomiques, agroalimentaires, horticoles et du paysage
d'un autre établissement (étudiant arrivé en M2)
Ce document est soumis aux conditions d’utilisation
«Paternité-Pas d'Utilisation Commerciale-Pas de Modification 4.0 France» disponible en ligne http://creativecommons.org/licenses/by-nc-nd/4.0/deed.fr
Confidentialité
Non
Oui
si oui :
1 an 5 ans10 ans
Pendant toute la durée de confidentialité, aucune diffusion du mémoire n’est possible
(1).
Date et signature du maître de stage
(2):
A la fin de la période de confidentialité, sa diffusion est soumise aux règles ci-dessous (droits
d’auteur et autorisation de diffusion par l’enseignant à renseigner).
Droits d’auteur
L’auteur
(3) Nom Prénom ---autorise la diffusion de son travail
(immédiatement ou à la fin de la période de confidentialité)Oui
Non
Si oui, il autorise
la diffusion papier du mémoire uniquement(4)
la diffusion papier du mémoire et la diffusion électronique du résumé
la diffusion papier et électronique du mémoire (joindre dans ce cas la fiche
de conformité du mémoire numérique et le contrat de diffusion)
accepte de placer son mémoire sous licence Creative commons
CC-By-Nc-Nd (voir Guide du mémoire Chap 1.4 page 6)
Date et signature de l’auteur :
Autorisation de diffusion par le responsable de spécialisation ou son
représentant
L’enseignant juge le mémoire de qualité suffisante pour être diffusé
(immédiatement ou à la fin de la période de confidentialité)Oui
Non
Si non, seul le titre du mémoire apparaîtra dans les bases de données.
Si oui, il autorise
la diffusion papier du mémoire uniquement(4)
la diffusion papier du mémoire et la diffusion électronique du résumé la diffusion papier et électronique du mémoire
Date et signature de l’enseignant :
(1) L’administration, les enseignants et les différents services de documentation d’AGROCAMPUS OUEST s’engagent à respecter cette confidentialité.
(2) Signature et cachet de l’organisme
(3).Auteur = étudiant qui réalise son mémoire de fin d’études
(4) La référence bibliographique (= Nom de l’auteur, titre du mémoire, année de soutenance, diplôme, spécialité et
spécialisation/Option)) sera signalée dans les bases de données documentaires sans le résumé (Facultatif)
List of Figures and Annexes
Figure 1: Schema of a microdialysis probe and its principle. Source Wikipedia User:StS83 ... 3
Figure 2: Closeable jar containing a mesocosm and two probes (personal realization, Vienna 2018)... 5
Figure 3: soil core harvesting from a soil core for the microdialysis (treatment and control) (personal realization, Vienna 2018) ... 5
Figure 4 : global view of the microdialysis setup in the lab at Universität Wien (personal realization, Vienna 2018)... 7
Figure 5 : Detailed presentation of the different part from the experimental setup (personal realization, Vienna 2018)... 7
Figure 8 : Timetable of the experiment and pooling plan ... 9
Figure 7 : schema of two microdialysis probes inserted in a mesocosm and of the spatial harvesting of the mesocosm ... 11
Figure 9 graphs of the soil respiration measurements ... 15
Figure 10 : graph of the sugar mixture concentration ... 16
Figure 11 : graph of the transfer rate per timepoint... 19
Figure 12 : graph of the transfer rate (%) per mesocosm per compound ... 19
Figure 13 : plot of the total carbon flux toward the soil in µmol Carbon ... 21
Figure 14 : Bar plot of the amount of substrate added to the soil (µg) ... 21
Figure 15 : Bar plot of the soil water content ... 21
Figure 16 : Plot of the ammonium concentration (mg/l) ... 23
Figure 17 : plot of the anions concentrations in mg/l ... 25
Figure 18 : graph of the formiate concentration (mg/l) ... 27
Figure 19 : Plots of the enzyme activity. ... 27
Figure 20 : Table of the statistical result for enzyme activity ... 30
Annexe 1 : Boxplot of the Benzoic acid concentration (mg/l) ... 45
Annexe 2: boxplot of the butyrate concentration (mg/l) ... 45
Annexe 3 : Boxplot of the citrate concentration (mg/l) ... 46
Annexe 4: Boxplot of the fructose concentration (mg/l) ... 46
Annexe 5 : Boxplot of the Galactose concentration (mg/l) ... 47
Annexe 6 : Boxplot of the oxalate concentration ... 47
SUMMARY
Table des matières
Introduction ... 3
Material and Methods : ... 7
1. Soil Sampling ... 7 2. Microdialyse set up ... 9 3. Timetable experiment: ... 11 4. Soil harvesting ... 11 5. HPLC measurements ... 11 6. Statistical analysis: ... 11
7. Ammonium colorimetric measurement : ... 13
8. Enzyme Measurements ... 13
9. Respiration measurements and Priming effect ... 15
Results ... 17
1. Gas measurements ... 17
1.1. Priming Effect ... 17
1.2. Total Respiration ... 19
1.3. Substrate Respiration ... 19
2. Temporal dynamics of added C compounds: ... 19
2.1. Acetate ... 19
2.2. Succinate & Fructose: ... 21
2.3. Glucose data: ... 21
3. Transfer rate: ... 21
4. Soil Water Content ... 23
5. Amount of sugar input: ... 23
6. Ammonium ... 25 7. Anion data ... 27 7.1. Nitrate data: ... 27 7.2. Sulfate data: ... 27 7.3. Chloride: ... 27 7.4. Formiate ... 29 8. Enzymes ... 29 8.1. Chitinase activity ... 29 8.2. Cellulase activity ... 29 8.3. Protease activity... 29 8.4. Phosphatase activity ... 31 Discussion ... 33 Conclusion ... 39 References ... 41 Sitography ... 45 ANNEXE ... 46
1
Introduction
With the increasing global population and the diminution of agricultural land induced by it, maintaining food security will become a major issue in the next decades. Increasing plant production is therefore a necessity. One step towards that goal could be achieved by better understanding and subsequently improving plant nutrition.
Plant nutrition quality is linked to the quantity and diversity of nutrients available in an agricultural soil. To keep the soil fertility high, farmers use mineral and organic fertilizers. While mineral fertilizers are immediately bioavailable for the plant, organic fertilizers first need to be mineralized by soil microbes to become bioavailable for the crops.
It has been shown that the supply of labile carbon accelerates microbial decomposition of organic matter in the soil (Fontaine, 2004). This effect is called the Priming Effect. The Priming Effect is a change in microbial activity triggered by an external input of bioavailable, labile organic carbon, like, for example root exudates (bladoskaya, 2008). Root exudates, which consist – among others - of a mixture of sugars, amino acids and organic acids, are released at the root tip, where they create a “hot spot” of microbial abundance and activity. As defined by Kuzyakov (2015) a hot spot is “a small soil volume with much faster process rates and much more intensive interactions compared to the average soil conditions”. This effect is also limited in time as “the duration of hot moments in the rhizosphere is limited and is controlled by the length of the input of labile organics” (kuzyakov 2015). Hots spot induced by exudates of a root tip growing (i.e. physically moving) through the soil are temporally limited, leading to “hot moments” in soil. Consequently, rhizosphere priming effects (RPE) induced by root exudates are likely constrained to small soil volumes and short periods of labile C inputs.
The rhizosphere priming effect can alter microbial activity and microbial community composition, which affects mineralization of the native soil organic matter, and consequently nutrient availability for plants. Different temporal phases of the priming effect have been theorised: the apparent priming effect and the real priming effect. The apparent priming effect, which is thought to occur early after labile C input, is an accelerated CO2 evolution in response to a faster microbial turnover triggered by the input of fresh carbon (bladoskaya, 2008). This effect is associated with accelerated growth of r strategist microbes such as gram-negative bacteria. In a later phase, “real priming” is thought to occur, which is a change in the mineralisation rate of the native soil organic matter (bladoskaya, 2008). Real priming is thought to be associated with slower growing K strategist microbes such as fungi.
The priming effect can be positive, which means it would accelerate the decomposition of soil organic matter, or be negative and in the contrary diminish soil organic matter decomposition rate. The underlying mechanisms of the priming effect are still under debate. However, a few hypotheses have been emitted to predict and understand the priming effect.
One of them is on the effect of co-metabolism on SOM mineralization coming from the increase in microbial activity after addition of easily available carbon (Kuzyakov et al., 2000), or the shift in community composition changing the microbial activity and the mineralisation rate caused by the substrate addition (Fontaine et al., 2003). The competition for mineral nutrients in the rhizosphere may enhance the priming effect as it may create a deficiency for a specific nutrient, in response the microbes would increase the SOM mineralisation to balance the deficiency (Cheng & Kuzyakov, 2005).
2 The preferential substrate utilization hypothesis states that in case of an addition of easily available carbon the microbes would preferentially take up the fresh carbon instead of mineralizing the SOM, which would then lead to a negative priming (Cheng, 1999).
The Microbial N-Mining hypothesis states that providing easily available C to C (and energy) limited microbes, will switch their limitation from C (or energy) limitation to Nitrogen limitation. This energy would be used by the microbes to produce enzymes to extract nitrogen from the soil organic matter (Chen, 2014). Another hypothesis that was put forward to understand the priming effect is the stoichiometric decomposition hypothesis, which states that if the C/N ratio of the added substrate matches the microbial demand, the microbial activity and decomposition rate of SOM are higher.
The rhizosphere priming effect intensity and action also changes with the energy delivered by the substrate, which depends on its quantity and composition. A possible mechanism is that complex substrates induce a broader variety of enzymes, with a higher likelihood that some of these enzymes would then be able to degrade the native SOM, thus enhancing SOM co-metabolism (bladoskaya, 2008).
It is complicated to study the conformity of those hypotheses in situ, and there is no clear evidence so far supporting those hypotheses. Although those mechanisms are arguable controlled and occurring at the microscale, the RPE has most often been assessed in studies measuring microbial responses to C addition after soil sieving and substrate addition at the bulk soil level. We hypothesise that we can get new insights into the mechanisms of the priming effect by simulating root exudation, and subsequently investigating in situ microbial and substrate dynamics in a spatially restricted micro-meter scale soil volume within an undisturbed soil core.
To achieve this, we apply a new technique, adapted from neuro-physiology science to soil science, which allows diffusion of soluble molecules over a mm-scale membrane in and out of the soil solution in an undisturbed soil. This technique, “microdialysis”, has previously been used to monitor anions and amino-acids in situ in the soil solution (Inselbacher 2011, 2012,2014). Here, we use it for the first time not only to monitor soluble compounds in the soil solution, but also as a tool to simulate root exudation, by allowing a mixture of sugars and organic acids diffusing out of the microdialysis probe into the soil solution (‘reverse microdialysis’).
The research questions of this master thesis are:
1) Can we use the microdialysis technique to simulate microscale root exudation in an undisturbed soil core?
2) Do microscale “root exudations” trigger an observable rhizosphere priming effect?
3) Can we observe and resolve temporal dynamics of such a priming effect at the microscale?
The microdialysis is a diffusion-based sampling technique of compounds through a semi-permeable membrane (Figure 1: Schema of a microdialysis probe and its principle). A solution called ‘the perfusate solution’ is pumped at a defined rate through a microdialysis probe placed into the soil. This perfusate solution flows through the microdialysis probe, where it comes in contact with the soil solution via the probe’s membrane. Diffusion of compounds small enough to fit through the membrane (cut off: 20 kDalton) occur between the soil solution and the perfusate. The modified perfusate then will flow out of the probe toward the autosampler, the harvested solution is then called ‘the dialysate’. This is the solution which is analysed.
Figure 3: soil core harvesting from a soil core for the microdialysis (treatment and control) (personal realization, Vienna 2018)
3 In our case, we use the gradient base diffusion to perform a ‘reverse microdialysis’, meaning that instead of being a passive sampling solution, the perfusate was replaced for 10 hours by a mixture of sugars and organic acids (sucrose, acetate, succinate and glucose). Those compounds were selected as they are frequently present in root exudates of beech trees (Smith 1976, Ecology), which are the experimental trees used in this project.
The microdialysis technique allowed us for the first time to have an insight of the anions, organic acids and sugars concentration dynamics at a fine temporal (from 2 hours to 4 hours interval per measure) and at microscale, after using the probe to input an easily available organic substrate in the soil.
Material and Methods :
1. Soil Sampling
The sample were harvested from a beech (Fagus sylvatica) forest in Klausen-Leopoldsdorf (Austria) situated at 40 km south-west of Vienna, Austria (510 m altitude) with a soil core (10 cm diameter, 6 cm high, “field soil core”) two days before the start of the experiment. The harvested soil was loamy and very dry. All samples were drawn from a 5 x 5 m sampling area along a transect with distances of about 60 cm between each two samples (T1-T5). At each point, three field soil cores were sampled next to each other (i.e. along a line normal to the transect), one was reserved for sieving for bulk analysis, one for the microdialysis experiment and a backup core. We took two smaller soil cores (28 mm diameter each, “experimental core”), one for the control, and one for the “root exudate” treatment, out of each field soil core reserved for the microdialysis experiment. Each of these experimental cores was placed in a plastic mesocosm, which was made from a xx ml plastic vial. Taking experimental cores for control and treatment from the same field core right next to each other made sure that they were as similar as possible (Figure 3: soil core harvesting from a soil core for the microdialysis (treatment and control)).
This technique allowed us to use undisturbed soil during the experiment. The samples were taken two days before starting. As the soil was very dry, a rewetting was necessary. Sufficient water content of the soil is very important for the use of the microdialysis technique, which requires a liquid connection between the surface of the probe membrane and the soil solution to allow diffusion. The rewetting took place on the day of the harvest. 5mL was poured at 30 minutes interval from both sides of the soil core, which was sealed by lids. The amount of water was calculated from the known water holding capacity of the harvesting site.
During the experiment the mesocosm were kept inside glass jars (Figure 2: Closeable jar containing a mesocosm and two probes) which had a volume of 120 mL and could be tightly closed during the measurements. The gas sampling for respiration measurements was possible through a septum on top of the mesocosms.The perfusate and dialysate tubing were passed through the septums to connect with the pump and the autosampler. To slow the dehydration of the mesocosm, a wet paper was placed under the soil core and rewetted uniformly when dry. Therefore, a high humidity value was present inside the jars.
Figure 4 : global view of the microdialysis setup in the lab at Universität Wien (personal realization, Vienna 2018)
4
2. Microdialyse set up
Three syringe infusion pumps (CMA 404) were equipped with a total of 10 gas-tight microsyringes (5 ml, Hamilton) which provided the perfusate solution (Figure 4). Each syringe was connected to a cross link to split the tubing in two, and via that to two microdialysis probe ( Figure 7) (CMA 20) with a polyarylethersulphone membrane (10 mm long, 0.5 mm outer and 0.4 mm inner diameter) with a 20 kDa molecular weight cut-off. The two-probes outflow were connected back together by a second crosslink, in the end the dialysate from the two probes of one mesocosm were harvested in one vial. The material from the membrane does not interact with the targeted compounds. This membrane was chosen from previous experiments by (Inselbacher 2011) and were proven to be efficient for N monitoring. The perfusate was a
mixture of 3,9µmol/l KCL and 1,9µmol/l MnSO4. The samples (dialysates) were collected with
four microfraction collectors (ref: CMA 142 and CM470) in 300 ml plastic vials. The perfusion
flow rate was set at 5µl.min-1 and dialysates were collected continuously at 1-hour interval for
72 hours, and 3 times 4 hours (Erreur ! Source du renvoi introuvable.). The flow rate at one probe was 2,5µl/min.A minimum amount of ions (KCl and MnSO4) have been added to the perfusate as it has been suggested that a concentration of certain ions in the perfusate close to the outside concentration could increase the recovery rate (Demand et al, 2017). However, this fact has been denied by a second study (Warren et al, 2018) showing that the use of an ionic solution would not benefit the osmotic absorption of compounds.
The dialysate from both microdialysis probes were pooled before being collected in the microfraction collector. In this experiment we used two different type of microfraction collectors. As well, to lower the number of samples coming from the experiment, the 300µL of sample collected per hour were pooled in a different frequency from 2 samples for the first 18 hours to 4 pooled together for the rest of the experiment, leading to different time resolution of the anions and sugar concentration during the experiment (Figure 7).
The insertion of the probe in the soil was possible by digging a hole with a needle having a slightly bigger diameter than the probe membrane. This insertion preparation was necessary due to the highly breakable nature of the semi-permeable membrane. However, this slightly bigger hole did not seem to be an issue for the probe to establish a water bridge with the soil solution.
To investigate the priming effect, we replaced the perfusate solution in the “root exudate”
treatment mesocosms for 10 hours with a solution containing sugars and organic acids. This solution is a mixture of Acetic acid-13C2 (at 3.87 mg/l, APE=99), Succinic acid-13C4 (3.814 mg/l), D-Fructose-13C6 (3.872 mg/l) and D-Glucose-13C6 (3.872 mg/l). We choose those compounds has they are part of the root exudation compounds of the beech tree (Smith et al 1976). The calculation of the amount of root exudation we aimed to release into the soil was based on Phillips et al 2008, functional ecology. They estimated a root exudation rate (for pine trees) of 2 ug C/cm root length per day. We assumed that exudation is heterogeneously distributed within root surface area, with 10% of the area exuding 90-100% of all root exudates. In this way exudation “hot spots” would exude 20 ug C/cm root hot spot length per day, which equals to 13.88 ng C/min, or 1.15 nmol C/min. We assumed that 1 cm root length is roughly equivalent to the microdialysis probe membrane length (4 mm x2). At a 2.5 ul/min flow we thus need to have (assuming a transfer rate of 100%) a concentration of 1.15 nmol C in 2.5 ul, which is 0.46 nmol C/ul , which corresponds to 0.46 mM. Based on this we chose a 0.5 mM C solution, which we produced by mixing 1 :1 :1 :1 C from glucose, fructose, acetate and succinate, each in a 0.125mM C concentration).
5 We used labelled 13C labelled compounds for the “root exudate” solution, as this would allow us to measure the substrate respiration in the gas samples, which is necessary to calculate the Priming effect from the respiration measurements. This substrate was only running inside the probes of the 5 treatment mesocosms and not inside the 5 paired control mesocosms. We calculated the transfer rate (TR) of each added compound as percentage of the respective compound transferred from the perfusate to the soil during the sugar pulse:
TR= 100*(C perfusate -C dialysate)/C perfusate
Where Cdialysate is the concentration of the measured compound in the dialysate, that has traveled across the microdialysis membrane and C perfusate is the concentration of the compound in the perfusate.
3. Timetable experiment:
This timetable explain the overall experiment procedure. After insertion of the probes in the soil, the experiment started with 2 hours of perfusate run for both control and treatment, followed by 10 hours of root exudate mixture input to the treatments while the control continued to run with the perfusate solution. After that both treatment and control ran on the perfusate solution for the next 60 hours continuously. The microdialysis was stopped at hour 72 and started again with the perfusate solution for 4 hours at each of those timepoints 120, 168 and 287.
For the analysis the samples were pooled with two different frequency, every 2 hours for the first 20 hours (in that case one analysed sample represent 2 hours of dialysate), and then every for 4 hours for the rest of the experiment.
4. Soil harvesting
The soil was harvested on the twelfth day of the experiment. After putting away the probes, the soil mesocosm was harvested in two parts with a rectangular (1 x 2 cm) soil core (Figure 7). The aim was to separate the inner part of the mesocosm, influenced by the probe with the outer part of the soil core. To assess for the spatial influence of the probe. The inner core is called ‘in’ and ‘out’ on the enzyme results.
5. HPLC measurements
Ion chromatography (IC) and high pressure liquid chromatography (HPLC) was used to analyse the anions (including organic acids) and sugars from the dialysate samples, respectively. The investigated anions were: Sulfate, Chloride, Nitrate, Phosphate. And the investigated organic acids were: propionate, benzoic acid, citrate, oxalate, succinate, acetate. The investigated sugars were sucrose, glucose, fructose and galactose.
150µl of sample were pipetted per vial for all the analysis.
6. Statistical analysis:
The statistical analysis were carried out using R version 3.4.0 (2017-04-21) -- "You Stupid Darkness", Copyright (C) 2017 The R Foundation for Statistical Computing, Platform: x86_64-w64-mingw32/x64 (64-bit). library(ggplot2)
Figure 7 : schema of two microdialysis probes inserted in a mesocosm and of the spatial harvesting of the mesocosm
6 The following package were used car, MuMIn, nlme, Matrix, lme4, Rcmdr, ggplot2.
Shapiro-Wilk test were lead to attest for the data set normality and Bartlett test were lead to attest for the variance homogeneity, before analysing the data with a single or two-way ANOVA. Wilcoxon test were also lead for non-parametric analysis.
7. Ammonium colorimetric measurement :
An ammonium colorimetric measurement was done to investigate the temporal pattern of ammonium concentrations in the soil solution during the experiment. The samples analysed were the pooled dialysate samples (stored frozen for a week). The principle of the method is the oxidation of Ammonia into chloroamine by sodium dichloroisocyanuric acid which forms a bluegreen indophenol compound in the presence of salicylic acid (phenol) in alkaline medium (Berthelot reaction). Nitroprusside acts as a reaction catalyst. The reagents used were a color reagent (a 1:1:1 mixture ratio of salicylate acid sodium nitroprusside dihydrate [8,5g+64 mg /50mL], super pure water(Milli-Q), NaOH[0,2g/25mL]) and an oxidation reagent (dichlorocyanate [68mg/50mL]). The standard row was a NH4Cl solution with a concentration range from 500µM to 3.9µM. All the samples and blanks were pipetted in a transparent 96-wells microtiter plate. After addition of the colour reagent and the oxidation reagent, the microtiterplate was kept with the lid on and kept at room temperature for 30min. The indophenol absorbance was then measured spectrophotometrically at 660 nm.
8. Enzyme Measurements
The enzyme measurement was done one day after the harvest. The samples were stored over night at 4°C. For each mesocosms of each treatment, the inner and outer part of the mesocosm was separated for the analysis, to compare their respective enzyme activity.
We measured the activity of four different enzymes: Cellulase, Chitinase, Protease, Phosphatase. After harvest of the soil from the mesocosm, 0,5g of soil was weighted in a 50mL Erlenmeyer filled with 50mL of water and ultrasonicated at small intensity to break the aggregates and free the exocellular enzymes without exploding the microbial cells and ‘release’ the intracellular enzymes.
The ultrasonicator was adjusted to deliver the right energy amount in the Erlenmeyer. We ultrasonicated our samples for 50 sec at 80% of maximum power to reach 350 Joule energy input the sample. Once ultrasonicated, the samples were pipetted in a 96-wells black plate with blanks and standards and analysed for fluorescens.
The principle of this technique is to add the specific substrate of the studied enzyme linked to 4-Methylumbelliferyl (MUF). When the enzyme separates the 4-Methylumbelliferyl from the enzyme substrate, the liberated MUF becomes fluorescent. Therefore, to track the enzyme activity, this method track the MUF accumulation rate.
The plates were incubated for 3 hours in the dark and measured every hour. The fluorescent substrates use to track the enzyme activity are the following. After adding the substrate, the plates were measured at an excitation wavelength of 365 nm and an emission wavelength of 450 nm
Substrates for Enzyme
Measurements
Cellulase 4-Methylumbelliferyl β-D-glucopyranoside
Chitinase 4-Methylumbelliferyl N-acetyl-β-D-glucosaminide
Protease L-Leucine-7-amido-4-methylcoumarin hydrochloride
7
9. Respiration measurements and Priming effect
Microbial respiration was measured as CO2 accumulation over a certain time period (i.e. one hour) in the head-space of the closed glass jars. CO2 concentration and 13C signature of the CO2 were measured using a GasBench II system coupled to a Delta V Advantage IRMS. Measuring 13C content of CO2 allowed us to separate total respiration into respiration from the added, 13C-labelled substrate, and respiration from the native SOM using a two-pool mixing model with 13C concentrations of the added substrate (99 atom%) and the native SOM (natural abundance) as end members (Wild et al, SBB, 2014). We calculated the priming effect from the difference between respiration from the native SOM in the controls and the “root exudate” treatments.
The gas sampling was done according to the timetable (Erreur ! Source du renvoi introuvable.) at different timepoints while the microdialysis was running with different solution (the substrate and the perfusate).
For each gas samples 15mL of gas was taken out from a hermetically closed 120mL jar, with a gas tight syringe. The sample taken out was then injected in an evacuated 12mL gas vial with a needle through a septum. The gas in the gas harvesting vials was vacuumed for 45 seconds on a pump, to be free of CO2 ppm contamination. To avoid low pressure inside the jar after taking out 15mL of gas, this one was replaced by 15mL of 200 ppm CO2 artificial gas. After an hour a second gas sample was taken out, to measure the increase of CO2 ppm, and its change of 13C signature, during this time interval. The jar volume and the measured ppm increased for one mesocosm was previously tested in a gas sampling test. The results of this test lead us on choosing the 120mL jar to improve the ppm increase resolution.
During the experiment, the mesocosms receiving the labelled carbon substrate and the control were processed with separated artificial gas bag, needle and syringe to avoid 13-carbon contamination.
Respiration measurments were carried out at different timepoints throughout the experiment as laid out in the timetable (Erreur ! Source du renvoi introuvable.).
During the experiment, the mesocosms receiving the labelled carbon substrate and the control were processed with separated artificial gas bag, needle and syringe to avoid 13-carbon contamination.
Calculation formula for the Priming effect calculation:
Ppm corrected= [(ppmsample x (volume jar – volume harvested )+ volume harvested x ppmgas blank]/ volume jar
Ppm_increase= ppm measuredt1 - ppm corrected t0
Respiration(nmolCO2/hour)= [(ppm_increase/1000000)xvolume jar]/Constant molar volume(ml/µmol)
Atom Percent Excess sample= atom percent 13C treatment - atom percent 13C control
Respiration substrate= (Atom percent excess sample / Atom percent excess substrate) x Respiration treatment
Respiration SOM= [Respiration treatment – Respiration substrate]
Fi g u re 8 g ra p h s o f th e s o il re s p ira ti o n m e a s u re m e n ts
8
Results
1. Gas measurements
1.1. Priming Effect
The priming effect data per time point shows a very high variability, as for some time points the outsider points are both positive and negative (Figure 8). This result is also supported by the plot of the SOM respiration (Figure 8), as at the timepoint 10 and 21 the soil organic matter respiration from the treatment is significantly lower than the control. Our results indicate a negative Priming effect up to time point 55, which becomes slightly positive from point 69 until point 288. However, the variability is still high, and the plot of the SOM respiration does not support this result as respiration values from both soils are not significantly different. The variability could be due to a tightness issue from the jars. The tightness was tested before the experiment, but it was still variable from a jar to another, mostly at the septum junction. Although, the repeated spiking of the harvesting syringe might damage the tightness of the septum.
The negative priming effect observed for the first 48 hours can be linked to the addition of substrate from time 4 until time 13. In fact, the addition of fresh labile carbon to the soil in presence of available nitrogen may change the microbial dynamics, as microbes might preferentially take up the easily available carbon instead of investing energy in enzyme production to degrade soil organic matter. As the preferential substrate utilization theory would predict (Blagodatskaya et al 2008). This lack of exocellular enzymes would explain the slower rate of soil organic matter respiration until timepoint 48.
On the contrary from timepoint 170, the priming effect becomes slightly positive. However, in the plot of the SOM respiration, the difference between treatments for the soil organic matter respiration is not significant. This result may suggest that the observe priming may not be positive, but closer to zero. A positive priming at this moment of the experiment could be due by a real priming from K strategist microbes (kuyakov, 2002). However, we observe an increase of the ammonium concentration curve, acetate and formiate at different timepoints, which could mean that the soil experienced a microbial succession, changing the microbial community and increasing their activity (Blagodatskaya et al 2008).
However, this measured positive priming effect might be due to the high variability in between two gas measurement. It is possible that this variability covers a pattern in the dataset, again as the microdialysis probe is acting at a microscale, the affected area maybe too small compared to the all mesocosm volume. The effect of the substrate may then be diluted because of the small scale where it takes place. In fact, we calculated that the substrate respiration account for about 0.5% of the total respiration of a mesocosm. For a further experiment it could be interesting to use a smaller soil core to increase the ratio [Microdialysis influenced volume/Total soil volume].
As the samples from the microdialysis probe showed an increase in the ammonium concentration around 24 hours after the sugar input in the soil, this effect could be identified because the sampling was done at microscale (Figure 15).
Fi g ure 9 : g rap h o f the su g a r m ix ture con cen tr a ti o n ( m g / l)
9
1.2. Total Respiration
The total respiration plot of means shows that the production of CO2 in the mesocosm in mostly
under 0,2 µmolCO2.gram of dry soil-1.min-1, besides of a few outsider points. The variability is
high for both treatment and at every timepoints. However, on the soil organic matter respiration, at timepoint 10 and 21 the respiration from the treatment mesocosms is significantly lower. At timepoint 10, it supports the hypothesis of an early negative priming and at timepoint 21 this negative priming might still be on. However, these two datapoints are not enough to conclude the occurrence of Priming. At both timepoints, the difference can be significant because of the small variability of the data on the treatment plot of means.
1.3. Substrate Respiration
The substrate respiration plot shows that the substrate is quickly respired by the microbes when added to the soil, as its 13C signature follows closely the sugar pulse time plan. As one timepoint represents the all following hour, we can say from timepoint 6 that the substrate was
observed in the CO2 from the third hour of substrate input (starting at timepoint 4). The time
lag from the release of substrate to CO2 production is around 3 to 4 hours, as the 13C signature
make a jump from hour 7 on. The 13C signature of the substrate is reduced by half one hour after the stop of the pulse at timepoint 13. And the 13C signature disappear in between timepoint 13 and 21. It could be possible that a higher concentration of sugar would produce
a peak of 13C labelled CO2 earlier than 3 hours.
2. Temporal dynamics of added C compounds:
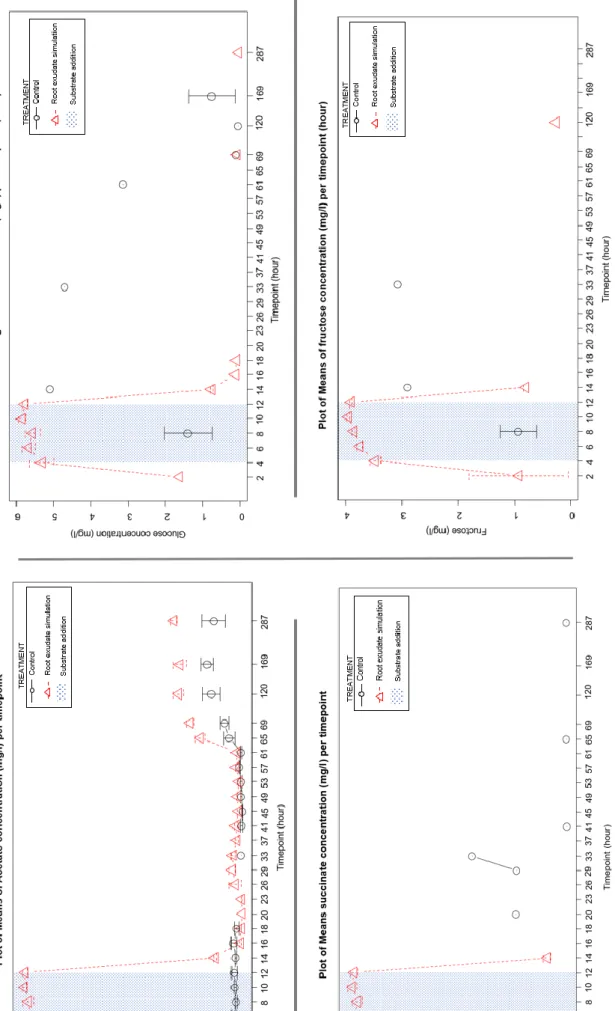
2.1. Acetate
On the plot of mean of the acetate concentration (Figure 9), the input moment is easily observable from time point 4 until 12 (which are exactly the limit timepoints of the substrate input). However, at timepoint 14, the acetate concentration is still significantly higher in the treatment than in the control dialysate. It is likely that a small part of the acetate coming from the probe was still present in the surrounding of the probe up to two hours after the end of the input. However, the concentration drastically diminished within two hours by up to 82%. It is possible that the acetate was being taken up by the microbes or was diffusing away from the probe surrounding. The acetate was not detected in the control samples by the HPLC from timepoint 20 to 37, which could mean that the acetate concentration in the treatment samples remained higher after the sugar in pulse. However, from timepoint 41 on, the acetate is detected again in the control and there is no difference in the concentrations. It is possible that a technical problem occurred for the acetate monitoring during this interval. But from the sample 69 until sample 287, the acetate concentration is significantly higher in the mesocosms that had received the root exudate solution earlier. This represent a long-term effect; this effect could be link to the observed priming effect on the ammonium curve (Figure 15). In fact, we could hypothesise that the substrate pulse triggered a temporal dynamic which led from timepoint 69 to a possible activation of dormant microorganisms. These awaken microbes may cause a change in microbial activity influencing the SOM mineralization and therefore the availability of acetate from it.
Figure 10 : graph of the transfer rate per timepoint
10
2.2. Succinate & Fructose:
The succinate and fructose curve follow the pattern of the input (Figure 9). Those data were used to calculate the transfer rate of the microdialysis setup during the sugar input. These results suggest that the background concentration of both compounds is very low. Also, the succinate content in the dialysate decreased very rapidly. Which could mean that the microbes were taking up the succinate without degrading soil organic matter, which could replace the dissolved succinate.
2.3. Glucose data:
For the glucose, the sugar in pulse can be easily tracked on the graph (Figure 9). The amount of glucose detected during the sugar in pulse are 40 to 50% higher than the target glucose concentration in the sugar mix. This extra-glucose could not come from the soil solution, as it is very unlikely that the surrounding of the probe was more concentrated than the sugar mix. Even in the control mesocosms, glucose could hardly be detected, indicating a very low background concentration of glucose in the soil solution.
In addition, the dialysate analysis did not monitor the glucose concentration after the in pulse, on side of a few punctual high results, with two outsider points (at T4C8=80mg/l and T4C14=23 mg/l). The microdialysis technics was leading to some very outsider points for almost all the analysed compounds from the dialysate. As no real explanation has been admitted yet to explain those results, it is most likely link to the use of microdialysis probe or to the high heterogeneity of decomposition processes happening at microscale. Even though, it is complicated to explain such a punctual result for a dialysate, from the control, pooled with 2 hours of sample harvesting, to be up to 200 times more concentrated than the lowest concentration who seems to draw a baseline. The possibility of extern contamination cannot be excluded.
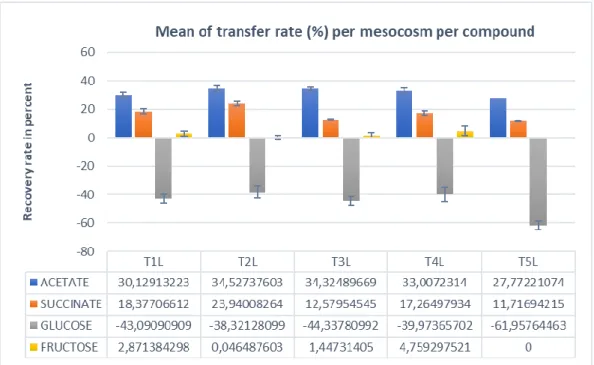
3. Transfer rate:
The transfer rate of the acetate input per timepoint was in between 30 and 40 percent, while the transfer rate from the succinate is lower from 15 until 20 percent (Figure 10). It is interesting to note that the transfer rate was significantly different in between the two compounds. The rate seems to stabilise to its basal value quickly, as the transfer rate seems affected by time only for the first pooled sample. This could be due to the initial concentration of those element in the soil solution which is lower at the first timepoint, thus increasing the gradient driven diffusion.
The transfer rate was differing in between the compounds of the mixture (Figure 11). The compounds showed lower transfer rate than expected, as the perfusate composition was made for an expected 90% transfer rate meanwhile the succinate had a mean transfer rate value of 16%, acetate a mean transfer rate of 31.9% and Glucose a transfer rate of -45.5%, and Fructose’s transfer rate was very low.
Glucose in the dialysate was measured to be of higher concentration than the sugar mixture in the perfusate should have. A plausible explanation could be a higher concentration than expected in the substrate mixture. In fact, the glucose concentration in the soil solution was not higher than the concentration recorded during the sugar pulse. Thus, the only solution to know the actual transfer rate of the glucose is to analyse the original substrate solution added as perfusate to the “root exudation” treatments with the HPLC, unfortunately this could not have been done before the end of the internship.
Figure 14 : Bar plot of the soil water content
Figure 13 : Bar plot of the amount of substrate added to the soil (µg)
Figure 12 : plot of the total carbon flux toward the soil in µmol Carbon 0,056545664 0,029257861 0,002317992 0,088121517 0,007861855 0,69 Acetate input Succinate input Fructose input total soil input total Respired by the microbes total C running through one probe
Calculation of the total Carbon flux toward the soil
11
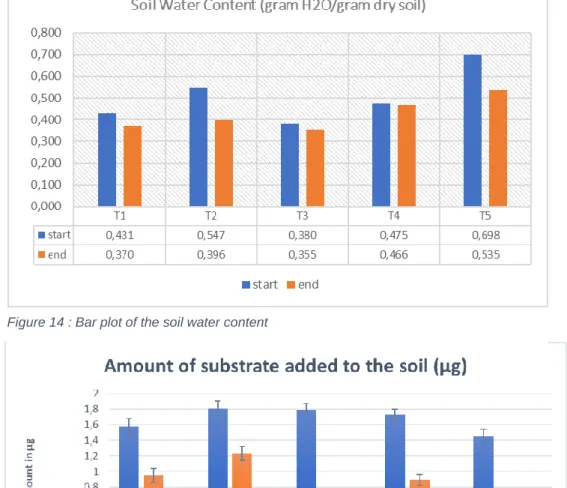
4. Soil Water Content
The mesocosms have had different behaviours towards their ability to keep their moist. In fact, the water losses for the mesocosm are from 2% loss for T4 up to 6% loss for T3, 14% for T1, 23.3% for T5 and 27.6% of loss for T2 as the highest water loss (Figure 14).
Those difference of soil water content (SWC) behaviour can be explained by a heterogeneity from the soil issued from the time series at site the harvesting site. In fact, the starting point of the soil water content values are already very different in between the samples. Even though at the beginning of the experiment the soils were all very dry after harvest and rewetted by addition of the same amount of water.
The transfer rate could be affected by the soil water content of the soil. However, the effect of water content on the transfer rate was not significant (with TR=transfer rate; Anova TRacetate~SWC P-value=0.268).
It is possible that the transfer rate was influenced by factors occurring at microscale, like microscale structure, soil water capacity at microscale, mineralogy, porosity. Even if, the soil cores were harvested right on side of each other to avoid structure differences.
5. Amount of sugar input:
These amounts were calculated from the transfer rate during the 10 hours of sugar pulse for each mesocosms and compounds. This amount accounts for only one probe of a mesocosm. The acetate amount transferred to the soil was the highest, followed by the succinate and the fructose. The glucose transfer rate could unfortunately not be calculated at this state of the data analysis. (Figure 13)
Those amounts were converted in µmol C to compare with the respired substrate and the total amount of C who passed through the probe (Figure 12).
We observe that the percent of carbon passing through one probe diffusing into the soil is 12.8%. This percent is satisfying and confirms the ability of a microdialysis probe to simulate a root exudation. The actual exudation rate was 0.147 nmol C/min, instead of 1.15 nmolC/min. However, this difference is not a problem because of the heterogeneity of the natural root exudation rate. We may be still on a natural range of the exudation rate as it is very variable. The percentage of respired 13C over input represented 8.9% of the actual input in µmol Carbon. This result could mean that the input substrate was preferentially incorporated in the microbial biomass rather than respired for the metabolism. It could mean that the microbial communities present in the soil were growing efficiently by using the labile substrate input. As we worked on an undisturbed forest soil, with a high number of roots in the mesocosm, it could be that the microbial community dynamic history already experienced exudation events. It could explain the efficiency of the response to the sugar pulse.
However, this result needs to be compared with Carbon Use Efficiency results which will come after this internship to be certain of their pertinence.
12
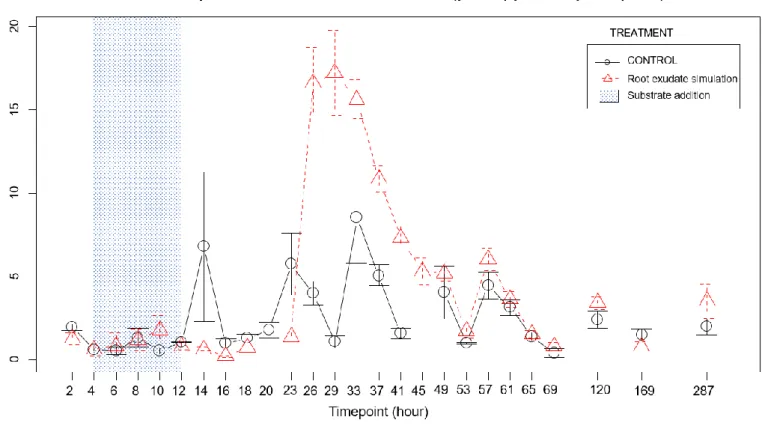
6. Ammonium
This plot (Figure 15) was built after deleting outsider values (extremely high and negative concentration values), such as T3L14 (100.15 µM) and T3C2 (69.8µM).
We can identify different temporal dynamic in those two graphs. For the first 12 hours there is no difference in between the treatment and the control for ammonium concentration. However, in this dataset, we experienced oddly high values from the dialysate analysis. We were not able to explain those results yet. However, it seems to come from the technique itself and such results have already been experienced in past experiments. However, as this problem appears on a periodic time (present at hour 14, and 23, and 33). At time point 14 the ammonium concentration of the control is significantly higher than the treatment (Kruskal-Wallis test for treatment only at timepoint 14, was significant, p-value = 0.7533). This could be the natural up and down nutrient dynamic without the sugar in pulse perturbation, or a technical problem. The next upcoming experiment of the research project will be a good opportunity to investigate this effect on a larger number of sample and replicates.
We see an effect of the labile substrate input on the ammonium concentration (µmol/l) from timepoint 26 until time point 45. In fact, the concentrations increase radically from the background concentration around 2µmol/l to concentration around 16µmol/l. These results are significantly different from the control (Wilcoxon rank sum test with continuity correction [test
from time points 26 until 45 only] p-value = 2.017e-07). These increase in the NH4+
concentration occurs around 24 hours after the start of the sugar and keeps going for another 24 hours. This increase is clearly related to the previous input of labile substrates, and it correspond to a priming effect as this ammonium did not come from the perfusate and had no other exterior source available. Consequently, the ammonium must originate from the degradation of the soil organic matter from the mesocosms. It is possible that the microbial growth triggered by the labile substrate input lead to an ammonium deficiency, enhancing the production of extra-cellular enzymes. This ammonium deficiency could be an explanation for the ammonium concentration periodical pattern, that we observe in the control dot plot line, being absent of the treatment dot plot. As this periodical pattern could be originated from a natural ammonium concentration dynamic. The hypothesis could be that those natural ammonium concentration peaks were consumed by the higher microbial activity induced by the sugar pulse, flattering the line.
It is very interesting to see the potential of the microdialysis to follow the ammonium dynamic, possibly linked to a priming effect, where the traditional gas sampling technic for investigating priming effect did not display any pattern on this particular time frame, certainly because of the difference in the scale resolution.
13
7. Anion data
In total, eleven different anions and organic acids were analysed with the HPLC (chloride, sulfate, phosphate, acetate, succinate, benzoic acid, formiate, oxalate, nitrate, citrate, butyrate, oxalate, propionate).
Unfortunately, out of those eleven molecules, only the four above mentioned (plus acetate and succinate) were appropriately detected to build an analysable dataset. However, the graphs from those anions will be available in the annex.
For the sugar measurement, only the fructose and glucose could be monitored, or at least during the sugar pulse, but the sucrose and galactose were hardly detectable by the HPLC, these graphs are also available in the appendix.
7.1. Nitrate data:
Unlike the ammonium data curve nitrate dot plot, the nitrate results do not show a pattern that could be linked to a priming effect (Figure 16). The global pattern is an increase of the detected concentration and of the variability. The only timepoint showing a difference is at timepoint 287 for which the nitrate concentration completely drops down in the control samples. This sudden decrease of the nitrate concentration at timepoint 287 is not enough to conclude on anything, as it most likely looks like a technical failure. The sugar in pulse did not influence the nitrate
availability in the soil (anova Nitrate~Treatment p-value=0.243).
7.2. Sulfate data:
Both Labelled and Control means of plot line are following the same pattern all along the experiment time (Figure 16). The treatment has no effect on the sulfate concentration in the dialysate for most of the time points. However, the control concentration is significantly lower at time points 29, 45, 49 and 287. It is interesting to link these results with the ammonium concentration dynamic, as the sulfate concentration is higher for timepoints localized during the visible priming effect period. These observations may be originated from the higher soil organic matter mineralisation rate. Therefore, the release of sulfate from the SOM to the soil solution is higher. The higher amount of Sulfate also means that the enzyme activity for sulfate extraction from the soil organic matter is higher.
7.3. Chloride:
The chloride dataset (Figure 16) is unfortunately discontinuous as it was hardly detected by the HPLC in the dialysate samples from timepoint 2 to 18, from timepoint 20 on the chloride becomes detectable, in both treatment and control. However, no significant difference is noticeable in our data. Meaning the chloride concentration temporal dynamic was not affected by the treatment.
Figure 18 : Plots of the enzyme activity.
14 7.4.
Formiate
:The formiate was present all along the experiment in the dialysate(Figure 16). Graphically we can see that the formiate concentration is lower in the treatment mesocosms than in the control for the first 20 hours. Moreover, this change occurred progressively from the start of the sugar pulse. It is possible that the sugar pulse influenced the formiate concentration in the soil solution. We can hypothesize the that this molecule was taken up faster by the microbes in the treatment mesocosms than in the control, due to a higher microbial activity. In fact, if the feeding strategy from the microbes during the sugar pulse shift from enzyme secretion to taking up easily available organic carbon (preferential substrate hypothesis), it may play on the formiate concentrations. then from timepoint 41 to 69 and until 288, the formiate concentration between the control and the treatment is significantly different. This time the formiate concentration is higher in the treatment solution than in the control. As this significant effect start at timepoint 41, during the ammonium peak, it is likely that the priming effect occurring at this moment of the experiment be responsible for the concentration increase of formiate, coming from the higher rate decomposition of the soil organic matter. It is also possible that from timepoint 41 on, a microbial community shift appeared, by the activation of dormant microbial groups decomposing enhancing the SOM decomposition from another way and increasing the concentration of Formiate.
8. Enzymes
The enzyme activity has been measured the day after the harvesting. The inner and outer soil samples from each mesocosm (“in” and “out”) were stored over night at 4°C. The aim of this analysis was to investigate the spatial effect of the sugar input emitted from the microdialysis probes. The ‘in’ stands for the soil harvested around the probe, and ‘out’ stands for the soil harvested further from the probe.
8.1. Chitinase activity
The chitinase activity shows a higher variability in between the mesocosms who received the labelled sugar mix compare to the mesocosms from the control (). The two-way ANOVA tests results on the potential effect of location and treatment lead to non-statistically significant results (Figure 19).
8.2. Cellulase activity
The cellulase activity shows a high variability for both treatments as well, as the values start
from 20 nmol MUF.gram dry soil-1.min-1 up to three times more this value. However, the
statistical analysis did not show any significant different in between both the treatment and location (Figure 19). The non-homogeneity from the dataset variance through a Bartlett-test for Cellulase activity was corrected by a square root transformation to fit the ANOVA analysis.
8.3. Protease activity
The Protease activity dataset shows less variability, and graphically the two treatments seem to be different. However, the results from the ANOVA showed no significant difference in between the two treatment and the two locations. Once more, the variance was non-homogenous through a Bartlett-test and a transformation of the dataset was necessary to perform the ANOVA (Figure 19). The fitting transformation was a ranking of the dataset.
15
8.4. Phosphatase activity
The phosphatase activity dataset shows a high variability of the enzyme activity for both treatment and location. The ANOVA test did not conclude for any significant results for the effect on the enzyme activity of the treatment, location of the harvested soil and intersection of both effects.
Enzyme/Factor Treatment Location Treatment:Location
Chitinase p-value=0.674 p-value=0.444 p-value=0.788
Sqrt(Cellulase) p-value=0.410 p-value=0.655 p-value=0.555
Protease(ranked) p-value=0.129 p-value=0.503 p-value=0.601
Phosphatase p-value=0.961 p-value=0.358 p-value=0.618
Figure 19 : Table of the statistical result for enzyme activity
Thus, in this experiment there were no effect of the microdialysis probe on the enzyme activity from the microbial community inside the mesocosm. It is possible that the estimated zone of influence from the microdialysis probes were smaller than expected. In that case, it would be possible changes in enzyme activity were present at a smaller scale around the probe and therefore this change may not be large enough to be recorded at this resolution. This hypothesis can be supported by the fact that the bio-available ammonium concentration curve shows the occurrence of a priming effect (Figure 19). This increase supposes the secretion of extracellular enzyme increasing the mineralization rate of the SOM. Also, it may be that the investigated enzymes were not the ones who were affected by the probe and treatment. In the next experiment of this project it could be interesting to restrain the area labelled ‘in’ more closely around the probe position to get a better resolution around them, as the effect of the input might have been diluted in a too big harvested sample. In this experiment, the enzyme measurements were made at the end of the experiment only. It could be also interesting to harvest the soils at different time points, as the enzyme activity may change temporally during or shortly after the sugar input 12 days earlier than the enzyme measurement here.
16
Discussion
In this experiment, the microdialysis has proven its ability to investigate the temporal dynamic of the investigated compounds and has delivered very interesting results and information about the microbial and nutrient dynamics after the addition of a local substrate pulse. For the first time the dynamics of anions, sugars and organic acids concentrations could be followed on a fine temporal scale right at the exudation hotspot, revealing different temporal pattern of the investigated compounds whereas the gas sampling did not show the occurrence of an acceleration of the CO2 production in the mineralisation rate of the SOM from timepoint 26 to 45. The ammonium curve gave an interesting information: as in between our treatment and control, the ammonium concentration clearly peaked 26 hours after the sugar pulse. The occurrence of this peak can be linked to a priming effect as the acceleration of microbial SOM mineralisation leads to an increase of available, inorganic N in the soil (Blagodotskaya , 2008). This result tend to approve the microbial N-mining theory (R.CHENA et al.2013). In fact, the addition of substrate seemed to perturbate a natural cycle of the ammonium (up and down on a 12 hours period) for the first 72 hours, and become normal again from hour 121 in ours results. This result needs to be confirmed by the following experiments of the research project, with an higher number of replicates.
The respiration measurement and the microdialysis give complementary information to understand the effect of the added substrate to the soil microbes. In fact, we measured a negative priming effect in the first 48 hours of the experiment which could be explained by the preferential substrate utilisation hypothesis (Cheng, 1999). It is then possible to hypothesise that the microbes were not Carbon limited be timepoint 48 and their limitation switched to Nitrogen limitation as the microbial biomass increased. According to the N-mining theory, this energy would be used by the microbes to produce enzymes to extract nitrogen from the soil organic matter (Chen, 2014). This theory fits very well our results as the ammonium peak appeared before timepoint 48. The combination of the information from both sampling technic leads to far better understanding of the dynamic taking place in the soil. For this reason, the reverse microdialysis has a great potential to help to further understand the mechanism and confront the theories to some quality data.
Besides of the ammonium, the analysis of the dialysate samples could detect temporal changes in the concentration of different organic acids such as the formiate. The formiate dynamic seems to be influenced by the substrate addition. During the labile substrate pulse, its concentration decreases in comparison to the control, before a complete shift in the concentrations in between timepoint 20 and 37 and the concentration in the treatment becomes significantly higher until the end of the treatment. This shift occurs between the end of the labile substrate pulse and the beginning of the ammonium peak. Therefore, this shift can be interpreted as a change in microbial activity, that can be caused by a microbial succession. This community change can be linked to the chemical quality of the substrate, in our case, glucose and fructose are very versatile compounds, same for acetate and succinate as the compounds were chosen for their common presence in the beech tree root exudates. These compounds would not trigger the development of substrate specific microbes (blagodotskaya 2008). However, the input of fresh organic matter may nonetheless activate dormant microbes (blagodotskaya, 2008). This community change could explain the fact that the formiate concentration stays significantly higher from day 3 of the experiment until day 12, compared to the later phase of the experiment. Which could mean that a microbial succession is taking place on a longer term. In fact, this hypothesis can be supported by the acetate measurement,
17 showing a sudden increase in bioavailability of acetate at timepoint 65. This increase is very significant and stable in time (starting on day 3 still there on day 12). This increase could be explained by the changes the microbial succession would imply like change in microbial activity and extracellular enzymes nature.
The fact that at least 42.4% of the labelled carbon from the substrate diffused out of the probe, means that the ‘reverse microdialysis’ technique is effectively suitable to input a substrate solution in the soil, and record its influence at microscale. The fact that these results shows a clear effect of the substrate, and a dynamic fitting to theories adapted to the rhizosphere priming prove that the substrate had an effect on the soil microbes. And therefore, support the hypothesis that the ‘reverse dialysis’ technique created a hot spot around the probe and could investigate the mechanism surrounding the priming effect happening at the microscale. The passive microdialysis technique has the capacity to monitor precisely compounds in situ. (Inselbacher 2011, 2012, 2014). However, the potential use of microdialysis can easily be extended to other areas in environmental and plant sciences. For instance, plant pathologist researcher could use the in situ analysis properties of the microdialysis to investigate the temporal dynamic of key molecules or anions, in the soil or in plant tissues in contact with pathogens, and in early infection stages. Sampling from plant tissues has already been experienced successfully with a microdialysis probe by (Miro et al, 2005).
Tracking the changes anion composition of the phloem, plant tissue or apoplast in situ from a very early stage of infection from different pathogens could bring into light mechanisms occurring at very small spatial and temporal scale. This could lead to an exclusive insight on the temporal dynamic of plant molecular and mechanisms response to a pathogen arrival. Moreover, the microdialysis probe pore sizes on the semi permeable membrane goes from 20kDa until 100kDa (CMA store). It could potentially monitor the protein temporal dynamic of small pathogen-associated molecular pattern in the plant tissues.
This characteristic would made microdialysis a precious tool to investigate temporal succession of protein exchange in early stage infection in the soil or in vitro for root diseases. It could be a way to identify new pathogen associated molecular patterns and their temporal successions by screening the dialysate composition. As microdialysis is a non-invasive technic, the concentration background nearby a root could be monitored without perturbation. It should also be possible to monitor in situ microbial processes if a molecular signature of those processes can be sampled by diffusion in the membrane. This technic could be used to analyse the success and efficiency of PGPR inoculation.
Such as some strains of pseudomonas fluorescens are known to have an interesting biocontrol effect, because of their production of 2,4-Diacetylphloroglucinol and of antibiotics metabolite, which sizes makes possible to harvest with a microdialysis probe (<47kDa) (P Sacherer et al, 1994). Other molecule of interest could be monitored or injected at microscale such as the concentration of N-acetyl homoserine lactone, inhibitor of the quorum sensing, (Adam Schickora et al, 2015) and siderophores such as Deferoxamine, iron chelator having biocontrol effects. Therefore, the microdialysis technique could bring to the plant pathologists a missing tool to understand the spatial and temporal scale of action of the biocontrol agents. And further understand the delay of effect and application technique to possibly adapt these biocontrol agents to a possible use in diseases management.
18 Also the current early stage infection investigation methods are only destructive (Gayer et al, 2015) (Brendan M.O’Leary et al, 2016). Some experiments at microscale involving the insertion of a probe were already led by (Felle, 2002 and 2004), and brought interesting results about the pH evolution in the apoplast after infection. It is therefore very motivating to look into the in situ microscale processes of early stage infections as it is very hard to collect molecular data at high temporal resolution without a non-invasive technic. The adaptation of the microdialysis to those problematics could bring out many very interesting data.
19
Conclusion
:In this study, we investigated the mechanisms behind the Rhizosphere Priming effect after the release of substrate in the soil using a new technic: the ‘reverse microdialysis’. This technic permitted the creation a hotspot by adding in the soil per diffusion a mixture of 13C labelled easily available organic compounds (glucose, fructose, succinate and acetate) and monitor their concentration in situ, at a fine temporal scale the dynamic of the concentrations of fifteen different organic acids, anions and sugars. The microdialysis samples analysis coupled with gas measurement data revealed different responses to the sugar pulse: a negative priming effect initiated by the substrate input was recorded during the first 21 hours of the experiment by the gas measurements. This negative priming effect could be explained by the preferential
substrate use hypothesis. Then the dialysate samples recorded a peak in NH4+ concentration
in the soil solution from hour 26 until 45. This effect could be explained by the microbial N-mining hypothesis. From timepoint 65 on, the acetate concentration increased and was significantly higher than the control until the end of the experiment. This increase took place in long term compared to the other mechanism found and it can be interpreted as the product from a microbial succession triggered by the sugar input. However, the enzyme data did not show any difference in between treatment and control. If this result does not support the occurrence of a microbial succession, data from phospholipid fatty acid (PLFA) analysis of the harvested soils will be available soon to give a better look at the microbial communities. Thus, this study shows the potential of the reverse microdialysis to create a hotspot and investigate the mechanisms induced at a fine spatial and temporal scale. This technique may bring a lot of interesting data to investigate the Priming effect. However, it could also be used in plant pathology to create exclusive insight in the plant infection by a disease or plant response to a pest attack, as it has interesting qualities such as the non-invasive diffusion-based sampling, the microscale resolution and the fine temporal scale resolution. In either case, this technic could bring precious information to understand and promote plant nutrition and health, to answer the great challenges ahead of us: such as developing a sustainable plant production to insure food security in the context of global warming.