HAL Id: tel-01127540
https://tel.archives-ouvertes.fr/tel-01127540
Submitted on 7 Mar 2015
HAL is a multi-disciplinary open access
archive for the deposit and dissemination of sci-entific research documents, whether they are pub-lished or not. The documents may come from teaching and research institutions in France or abroad, or from public or private research centers.
L’archive ouverte pluridisciplinaire HAL, est destinée au dépôt et à la diffusion de documents scientifiques de niveau recherche, publiés ou non, émanant des établissements d’enseignement et de recherche français ou étrangers, des laboratoires publics ou privés.
l’exercice et de l’hormone de croissance : implication du
stress oxydant et de la glucose-6-phosphate
déshydrogénase
Thomas Brioche
To cite this version:
Thomas Brioche. Sarcopenie : mécanismes et prévention : rôle de l’exercice et de l’hormone de crois-sance : implication du stress oxydant et de la glucose-6-phosphate déshydrogénase. Education. Uni-versité Rennes 2; Universitat de Valencia (Espagne), 2014. Français. �NNT : 2014REN20044�. �tel-01127540�
Thomas Brioche
Préparée au sein des laboratoires Free Radical and Antioxidant Research Group (Université de Valencia, Espagne) et Mouvement, Sport, Santé (Université Rennes 2 – ENS Rennes, France)
Sarcopenia: Mechanisms and Prevention
Role of Exercise and Growth Hormone
Involvement of oxidative stress and Glucose-6-phosphate dehydrogenase
sous le sceau de l’Université européenne de Bretagne
pour obtenir le titre de DOCTEUR DE L’UNIVERSITE RENNES 2 Mention : STAPS Ecole doctorale Vie-Agro-Santé
Thèse soutenue le 09 Avril 2014 devant le jury composé de : Angèle CHOPARD
Professeur - UMR 866 DMEM, Montpellier / rapporteur Damien FREYSSENET
Professeur - Laboratoire de Physiologie de l'Exercice, Saint-Etienne / rapporteur
Isabelle PETROPOULOS
Professeur - Laboratoire de Biologie Cellulaire du Vieillissement, Paris / Examinateur
José VINA
What's doesn't kill you makes you stronger…
Table of contents
Abbreviations ... 8
Figures and Tables ... 11
INTRODUCTION ... 13
REVIEW ... 17
Chapter 1: What is Sarcopenia? ... 18
1. Definitions of sarcopenia ... 18
1.1.The origins of the word “Sarcopenia” ... 18
1.2.First definitions based only on muscle mass ... 18
1.3.Limits of only using muscle mass to define sarcopenia ... 19
1.4.Consensus definitions of sarcopenia ... 20
1.5.Convergences and differences of the various definitions ... 22
1.5.1. Sarcopenia as a syndrome not a disease ... 22
1.5.2. Not only muscle mass ... 23
1.5.3. Diagnosis and strategy of case finding ... 24
1.6.Prevalence of Sarcopenia ... 26
2. Making a Diagnosis of sarcopenia ... 28
2.1.Muscle mass assessment ... 28
2.2.Strength assessment ... 30
2.3.Physical performance assessment ... 32
3. Muscle characteristic changes during aging leading to sarcopenia ... 33
3.1.Loss of muscle mass ... 33
3.2.Loss of muscle strength ... 35
Chapter 2: Sarcopenia-related cellular and molecular skeletal muscle alterations ... 38
1. Cellular and molecular mechanisms controlling proteins synthesis and degradation .... 38
1.1.Protein synthesis ... 38
1.1.1. Transcriptional activity of muscle fiber ... 39
1.1.2. Translational activity of muscle fiber ... 39
1.2.Proteolysis systems ... 44
1.2.1. Ca2+-dependent pathway: calpains and caspases ... 44
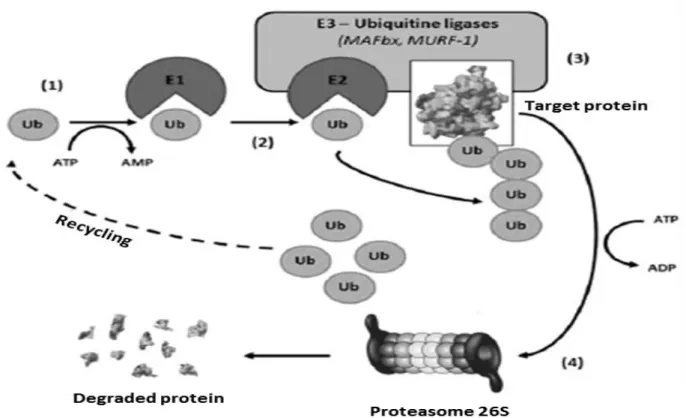
1.2.2. Overview of the ubiquitine-proteasome-dependent system ... 45
1.2.3. Overview of Autophagy ... 47
1.2.4. UPS and autophagy regulation... 49
1.3.Myostatin: master regulator of muscle mass ... 52
2. Role of Mitochondria in Cellular Homeostasis ... 54
2.1.Mitochondrial biogenesis ... 54
2.1.1. Mitochondrial biogenesis pathway ... 54
2.1.2. Mitochondrial biogenesis pathway up-streams ... 56
2.2.Mitochondria as a source of reactive oxygen species ... 58
2.3.The mitochondrial apoptotic machinery ... 58
2.4.The dynamic nature of mitochondria ... 60
3. Sarcopenia-related skeletal muscle alterations ... 61
3.1.Protein turnover alterations ... 62
3.1.1. Sarcopenia-associated protein synthesis impairment... 62
3.1.2. Sarcopenia-associated protein degradation impairment ... 66
3.2.Mitochondria dysfunctions and sarcopenia ... 69
3.2.1. Reduced mitochondrial content and function with age ... 69
3.2.2. The vicious cycle between oxidative stress and mitochondrial dysfunction in the aged muscle ... 70
3.2.3. Possible involvement of mitochondria dynamics in sarcopenia ... 71
3.2.4. Mitochondria-mediated apoptosis in sarcopenia ... 72
3.3.Satellite cells impairment ... 74
Chapter 3: The contribution of oxidative stress to sarcopenia ... 77
1. Generalities on oxidative stress ... 77
1.1.Definitions ... 77
1.2.Theories of aging related to oxidative stress ... 78
2. Oxidative stress in sarcopenic skeletal muscle ... 79
2.1.Increased RONS production in skeletal muscle is associated with sarcopenia ... 79
2.1.1. Mitochondria as sources of RONS ... 80
2.1.2. Free iron accumulation is associated with sarcopenia ... 83
2.1.3. Increased Xanthine oxidase activity as source of RONS... 84
2.1.4. NADPH Oxidase and Nitric oxide Synthase as sources of RONS ? ... 85
2.2.Increased oxidative damage in skeletal muscle is associated with sarcopenia ... 85
2.2.1. Protein oxidative damage: Protein carbonylation and nitrosylation ... 86
2.2.2. Lipid oxidative damage: Lipid peroxidation... 87
2.2.3. Nucleic acids oxidative damage... 87
2.3.Antioxidant defenses, aging and sarcopenia ... 89
2.3.1. Enzymatic antioxidant systems are impaired during aging and sarcopenia 90 2.3.2. Non enzymatic antioxidant systems are impaired during aging and sarcopenia ... 92
2.3.3. Repair systems seem to be impaired during aging... 93
2.4.Mechanistic links between oxidative stress and sarcopenia ... 93
2.4.1. Link between oxidative stress and impaired satellite cells activity ... 93
2.4.2. Oxidative stress could disturb protein turn-over ... 94
2.4.3. Oxidative stress and muscle contractile qualities ... 96
Chapter 4: Strategies against sarcopenia ... 98
1. Exercise as the perfect strategy against sarcopenia ... 98
1.1.Exercise during aging improves protein turnover ... 99
1.2.Exercise during aging decreases apoptosis ... 101
1.3.Exercise during aging stimulates satellite cells ... 102
1.4.Exercise during aging improves mitochondrial functions and dynamics ... 103
1.5.Exercise during aging would restore a young redox status ... 104
2. Alternative strategies to exercise for fighting sarcopenia ... 106
2.1.Possible antioxidant strategies to attenuate sarcopenia ... 106
2.2.Exercise and antioxidant supplementation at old age ... 109
2.3.Hormones replacement-therapies as a possible strategy ... 111
3. The Glucose-6-Phosphate Dehydrogenase as potential target to fight sarcopenia ... 116
3.1.G6PDH biochemistry and regulation in skeletal muscle ... 116
3.2.G6PDH, NADPH, antioxidant defenses and sarcopenia ... 118
3.3.G6PDH, apoptosis and sarcopenia ... 120
3.4.G6PDH, NADPH, ribose-5-phosphate and sarcopenia ... 121
SYNTHESIS AND OBJECTIVES ... 125
PERSONAL CONTRIBUTION ... 129
Study 1: Growth hormone replacement therapy prevents sarcopenia by a dual mechanism: improvement of protein balance and of antioxidant defenses ... 130
Study 2: Glucose-6-phosphate dehydrogenase overexpression improves body composition and physical performance in mice ... 155
Study 3: Redox status in resting conditions and in response to pro-oxidizing stimuli: impact of glucose-6-phospahe dehydrogenase overexpression ... 176
GENERAL DISCUSSION ... 194
CONCLUSION ... 202
REFERENCES ... 205
PUBLICATIONS AND PRIZES ... 233
Abbreviations
3-NT 3-nytrotyrosine Cat Catalase
4E-BP1 Eukaryotic initiation factor 4E
binding protein 1 CKI Cyclin-dependent kinases
4-HNE 4-hydroxynonenal CS Citrate synthase
8-OHdG 8-oxo-deoxyguanosine CSA Cross sectional area
8-OHG 8-oxo-oxyguanosine COX I Cytochrome c oxidase I
γ-GCLC γ-glutamate-cysteine ligase CT Computed tomography
AAS Availability of amino acids CuZn-SOD Copper-Zinc Super oxide dismutase
ADP Adenosine disphosphate CyPD Cyclophilin D
AGS Automatic Grip Strength DHEA Dehydroepiandrosterone Sulphate
AICAR 5-aminoimidazole-4- carboxamide-1-β-D-ribonucleoside
DNA Deoxyribonucleic acid
AIF Apoptosis-Inducing Factor Drp 1 Dynamin-related protein 1
Akt Protein kinase B DXA Dual-energy x-ray absorptiometry
AMP Adenosine monophosphate EDL Extensor digitorum longus
AMPK AMP-activated protein Kinase eEF2 Eukaryotic elongation factor-2
ANT Adenine nucleotide translocator eEF2K Eukaryotic elongation factor-2 kinase
Apaf-1 Apoptosis Protease-activating
factor 1 EGCG Epigallocatechin-3-gallate supplementation
ASM Appendicular skeletal muscle
mass eIF2B Eukaryotic translation initiation factor 2B
ATF2 Activating transcription factor
2 eIF3-f Eukaryotic translation initiation factor 3-subunit F
Atg Atrogin eIF4B Eukaryotic translation initiation factor 4B
ATP Adenosine triphosphate eIF4E Eukaryotic translation initiation factor 4E
ATPase Adenosine triphosphatase EndoG Endonuclease G
Bad Bcl-2-associated death
promoter eNOS Endothelial nitric oxide synthase
Bak Bcl-2 homologous
antagonist/killer EPSESE Established Epidemiologic Studies of the Populations of Elderly
Bax Bcl-2–associated X protein ERK1/2 Extracellular signal Regulated Kinase 1/2
Bcl-2 B-cell lymphoma 2 ESPEN European Society of Clinical Nutrition and Metabolism
Bcl-XL B-cell lymphoma-extra large ETC Electron transport chain
BIA Bioelectric impedance EWGSOP European Working Group on
Sarcopenia in Older People
Bnip3 BCL2/adenovirus
protein-interacting protein3 Fis 1 Fission 1 homolog
Bnip3L BCL2/adenovirus
protein-interacting protein3-like MRFs Myogenic regulatory factors
FoxO Forkhead box O MRI Magnetic resonance imaging
G6PDH Glucose-6-phosphate
dehydrogenase mRNA messenger RNA
GDH Glutamate dehydrogenase Mstn Myostatin
GH Growth hormone mtDNA Mitochondrial DNA
GHRH Growth hormone-releasing
hormone mTOR Mammalian target of rapamycin
Gpx Glutathione peroxidase mTORC1
and 2 Mammalian target of rapamycin complex 1 and 2
GR Glutathione reductase MuRF1 Muscle-specific RING-finger
protein 1
GSH Reducted glutathione MHC Myosin heavy chain
GSK-3 Glycogen Synthase Kinase 3 N Nitrogen
GSSG Oxidized glutathione NAD Nicotinamide adenine dinucleotide
GTPases Guanosine triphosphatases NADPH Nicotinamide adenine dinucleotide phosphate
H2O2 Hydrogen peroxide NAMPT Nicotinamide
phosphoribosyltransferase
HNA 4-hydroxy-2-nonenoic acid nDNA Nuclear DNA
HO• Hydroxyl radical NFAT Nuclear factor of activated T-cells
HPLC High-performance liquid
chromatography NFκB Nuclear Factor Kappa B
HSPs Heat shock proteins nNOS Neuronal nitric oxide synthase
ICDH Isocitrate dehydrogenase NO NO• Nitric oxide IGF-1 Insulin-like Growth Factor I NOS Nitric Oxide synthase
IGF1R Insulin-like Growth Factor I
Receptor NOX NADPH oxidase
IL-6 Interleukin-6 NRF-1 and
2 Nuclear respiratory factor 1 and 2
IM Inner membrane O2 Oxygen
IMS Intermembrane space O2-• Superoxide radical
IRS1 Insulin receptor substrate 1 OGG1 Oxoguanine DNA glycosylase
IWGS International Working Group
on Sarcopenia OH
• Hydroxyl radical
KO Knot out ONOO• Peroxynitrite anion
MAFbx Atrogin-1 Opa 1 Optic atrophy1
MAP
kinase Mitogen-activated kinase protein OS Oxidative stress
MDA Malondialdehyde OXPHOS Oxidative phosphorylation
ME Malic enzyme p70S6K 70-kDa ribosomal protein S6
kinase
MEF2 Myocyte enhancer factor-2 PCR Polymerase Chain Reaction
Mn-SOD Manganese Super oxide
mPTP Mitochondrial permeability
transition pore SOD Superoxide dismutase
PGC-1α PPAR gamma coactivator 1
alpha SPPB Short Battery Physical Performance
PGC1-β PPAR gamma coactivator 1beta SSCWD Society of Sarcopenia, Cachexia and Wasting Disorders
PGD 6-phosphogluconate
dehydrogenase STAT3 Signal Transducer and Activator of Transcription 3
PI3K Phosphatidylinositol-3-kinase TBARS Thiobarbituric acid reactive
PINK1 PTEN-induced putative kinase
1 TFAM Mitochondrial transcription factor A
PIP2
Phosphoinositide-(4,5)-biphosphate TGF-β Transforming Growth Factor beta
PIP3
Phosphoinositide-(3,4,5)-triphosphate TNF-α Tumor Necrosis Factor α
PLA2 Phospholipase A2 Trx Thioredoxin
PPARα Peroxisome
proliferator-activated receptors α TSC1 Tuberous Sceloris protein 1
PPP Pentose phosphate pathway TSC2 Tuberous Sceloris protein 2
PUFA Polyunsaturated fatty acids TUG Timed Get-up-and-go
R5P Ribose-5-phosphate TWEAK TNF-like weak inducer of apoptosis
REDD1
and 2 Regulated in Development and DNA damage responses 1 and 2 Ulk1 Unc-51-like kinase 1
RGPE Red grape polyphenol extract UPS Ubiquitin-proteasome system
RNA Ribonucleic acid VDAC Voltage-dependent anion channel
RNS Reactive species derived from
of nitrogen VO2max Maximal oxygen uptake
ROO• Peroxyl radical Wa Animal’s carcass weight in the air
ROOH Lipid hydroperoxide WT Wild type
RONS Reactive species derived from
of oxygen and nitrogen Ww Animal’s carcass weight in the water
ROS Reactive species derived from
of oxygen XDH Xanthine dehydrogenase
rpS6 Ribosomal protein S6 XO Xanthine oxidase
RyR1 Ryanodine receptor 1 XOR Xanthine oxidoreductase
SC Satellite cells
SCPT Stair climb power test
SD Standard deviations
SDH Succinate dehydrogenase
SERCA2 Sarco/endoplasmic reticulum
Ca2+-ATPase
SGI Specific Gravity Index
-SH Thiols residues
SIRT Sirtuin
Figures and Tables
Figures
Figure 1. EWGSOP-suggested algorithm for sarcopenia case finding in older individuals
(Cruz-Jentoft et al. 2010). ... 25
Figure 2. Overview of the PI3K/Akt/mTOR (inspired by Favier et al. 2008). ... 41
Figure 3. mTORC1 and mTORC2 complexes representation (modified from Adegoke 2012). ... 42
Figure 4. Ubiquitin-proteasome system. ... 45
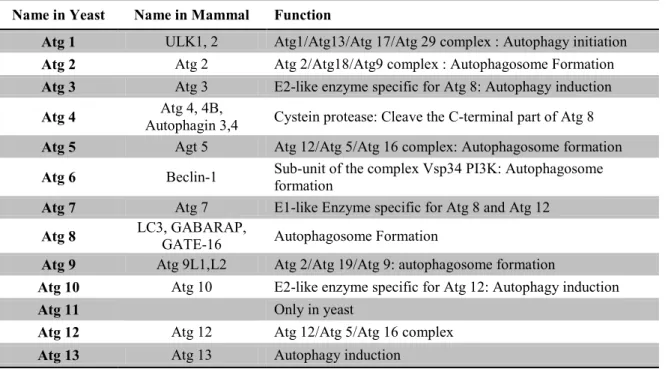
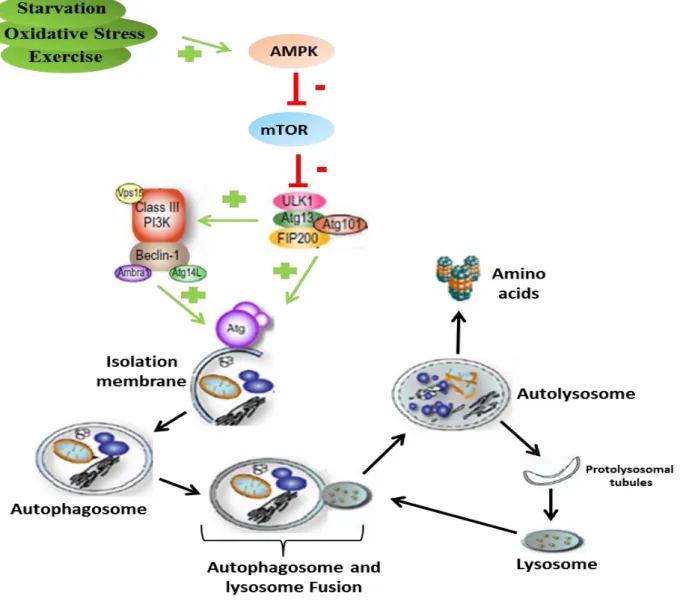
Figure 5. Autophagy proteins degradation mechanisms (inspired by Rautou et al. 2010). ... 48
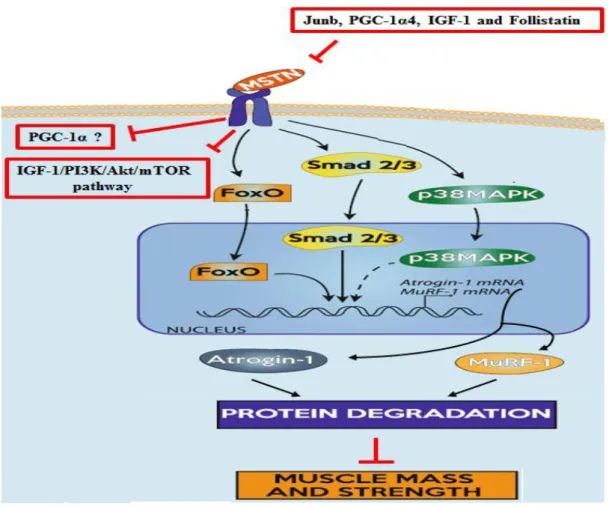
Figure 6. Myostatin mechanism leading to muscle atrophy (inspired by Gumucio & Mendias 2013). ... 53
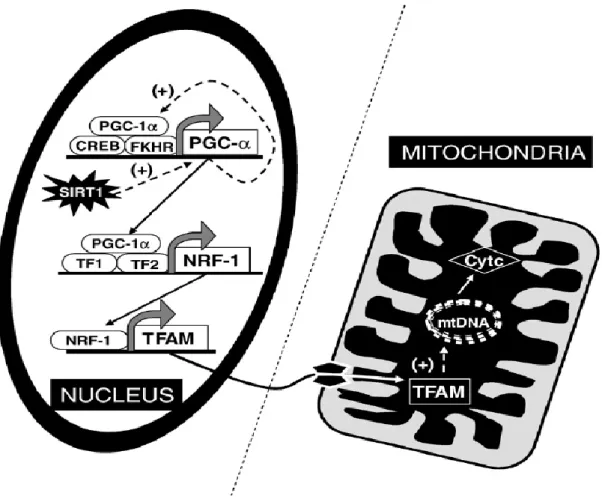
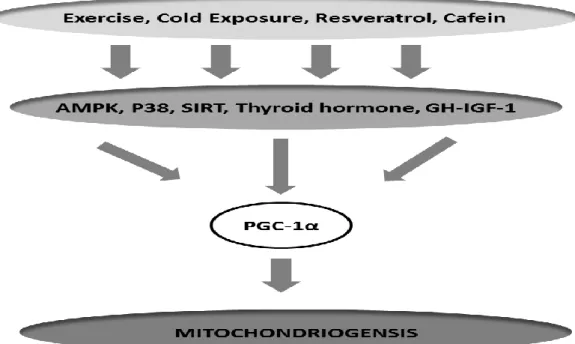
Figure 7. Schematic representation of the regulation of mitochondriogenesis (extracted from Viña et al. 2009). ... 55
Figure 8. PGC-1α and biogenesis mitochondrial up-streams in skeletal muscle. ... 57
Figure 9. Simplified apoptosis pathway in skeletal muscle (inspired by Marzetti et al. 2012). ... 60
Figure 10. The cell signaling disruption theory of aging (extracted from Viña et al. 2013). .. 79
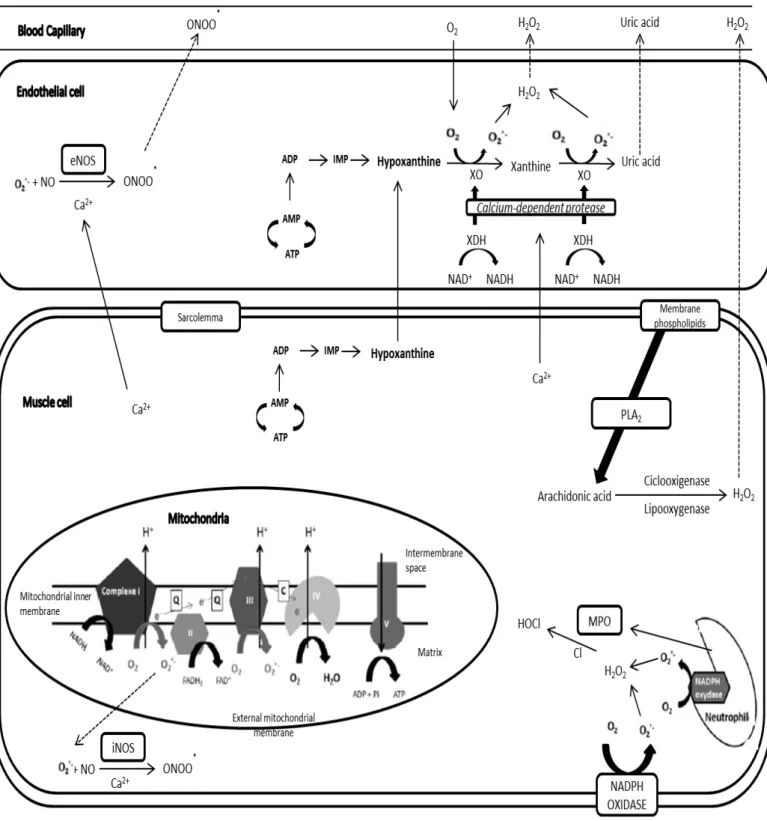
Figure 11. Potential free radicals productions sites in skeletal muscle during sarcopenia. ... 82
Figure 12. Fenton-Haber-Weiss HO• cycle production. ... 83
Figure 13. Schematic representation of RONS source, antioxidant systems and oxidative damage. ... 88
Figure 14. Reactions of the main antioxidant enzymes. ... 89
Figure 15. Gluthatione system representation. ... 92
Figure 16. The penthose phosphate pathway (extracted from Hecker & Leopold 2013). ... 117
Tables
Table 1. EWGSOP conceptual stages of sarcopenia (Cruz-Jentoft et al. 2010). ... 21 Table 2. Suggested categorization of sarcopenia by EWGSOP (Cruz-Jentoft et al. 2010). .... 21 Table 3. Muscle mass assessment technics (adapted from Cruz-Jentoft et al. 2011). ... 29 Table 4. Summary of methodologies used to assess muscle mass, muscle strength and physical performance in humans and rodents. ... 33 Table 5. Muscle fibers specificity and impact of aging on their atrophy. ... 35 Table 6. Ubiquitin ligases and their role in skeletal muscle and muscle cell other than MuRF1 and MAFbx. ... 46 Table 7. Equivalent Atg proteins between yeast and mammals and their functions (extracted from Mizushima 2007). ... 47 Table 8. Positive and Negative known FoxOs family regulators. ... 51 Table 9. Sarcopenia-associated mitochondria RONS production. ... 81 Table 10. Sarcopenia-associated enzymatic antioxidant defenses impairment in skeletal muscle. ... 91 Table 11. Positive and Negative regulators of G6PDH (modified from Stanton 2012). ... 118
Around eighty years ago, MacDonald Critchley was the first to recognize that muscle mass decreases with aging and noted that it is most noticeable in intrinsic hand and foot muscles (Critchley 1931). Almost sixty years later, in 1988, during a meeting convened in Albuquerque (USA) which provided information and updated the assessment of health and nutrition in older populations, Rosenberg, noted that ‘no decline with age is more dramatic or potentially more functionally significant than the decline in muscle mass’. He highlighted the interest that to provide recognition by the scientific community, this phenomenon needed a name and proposed the term ‘sarcopenia’ (Greek ‘sarx’ or flesh + ‘penia’ or loss). Thereafter, sarcopenia was defined as the progressive general decline in muscle mass that occurs with aging (Roubenoff & Hughes 2000). However, this definition was not accepted by all the clinicians and investigators and has been evolved a lot until few years. Finally, the actual consensus defines sarcopenia as ‘a geriatric syndrome initially characterized by a decrease in muscle mass that will get worse causing a deterioration in strength and physical performance’ (Muscaritoli et al. 2010; Cruz-Jentoft et al. 2010; Fielding et al. 2011; Morley et al. 2011).
Due to social, technological and medical progress, the life expectancy has been increasing since the 19th century in our modern Western societies, leading to the aging of the general population. Currently, it is projected that the number of elderly will double worldwide from 11% of the population to 22% by 2050 (UN 2007). Inevitably, due to this aging population, prevalence of sarcopenia is growing, and currently it is estimated that one-quarter to one-half of men and women aged 65 and older are likely sarcopenic (Janssen 2004). The consequences of the increasing prevalence of sarcopenia are generally considered as catastrophic on the public health costs. Thus, the total cost of sarcopenia to the American Health System has been reported to be approximately $18.4 billion (Janssen et al. 2004). This cost would worse in the future since individuals over the age of 69 years are the largest growing segment of the American population (Manton and Vaupel 1995). These healthcare costs are linked to a general deterioration of the physical condition resulting in an increased risk of falls, a progressive inability to perform basic activities of the daily life and loss of independence of the elderly (Goodpaster et al 2006, Delmonico et al 2007).
However, several strategies are acknowledged as effective to prevent, delay, or treat age-related sarcopenia. Thus, developing therapies will not only help to enhance the quality of life for individual sarcopenic patients but also reduce the economic and productivity burdens associated with sarcopenia, and would be beneficial to society as a whole. Exercise training is surely the most effective in counteracting sarcopenia since it can lead to increase muscle mass, strength and physical performance (Pillard et al. 2011; Di Luigi et al. 2012; Wang &
Bai 2012; Montero & Serra 2013). However, the large scale implementation of such intervention is hampered by the lack of motivation of most persons. In addition, many elderlies are non-ambulatory or have co-morbidities such as moderate to severe osteoarthritis (Bennell & Hinman 2011) or certain forms of unstable cardiovascular disease that would preclude participation in resistance training exercises (Williams et al. 2007). To overcome such barriers, developing alternative therapies such as antioxidant strategies and hormone replacement therapies (testosterone and GH) appear to be necessary.
Skeletal muscle is an organ which has specific properties that give it a central role in locomotion, performing activities of the daily life and the maintenance of posture and balance. In order to ensure these essential functions, it must have a sufficient mass and seek to preserve it. As previously described, some of the most serious consequences of ageing are its effects on skeletal muscle particularly the progressive loss of mass and function which impacts on quality of life, and ultimately on survival (Cruz-Jentoft 2012). The underlying mechanisms of sarcopenia are still under investigation. However, a negative protein turnover (Combaret et al. 2009), impaired mitochondrial dynamics (Calvani et al. 2013), a decreased muscle regeneration capacity (Snijders et al. 2009; Hikida 2011), as well as an exacerbation of apoptosis (Marzetti et al. 2012) are usually considered to be cellular mechanisms involved in muscle atrophy leading to sarcopenia.
These mechanisms are themselves dependent on a multitude of systemic and cellular factors such as decreased production of anabolic hormones (GH, IGF-1, testosterone, insulin). Links and interactions between these depleted hormones and the cellular dysfunctions previously cited remain partly unknown. A potential candidate could be the age-related chronic oxidative stress, whose recent studies emphasized its involvement in sarcopenia (Semba et al. 2007; Safdar et al. 2010). Thus, sarcopenic muscle exhibits increased free radicals derived from oxygen and nitrogen (RONS) production (Capel et al. 2004; Capel, Rimbert, et al. 2005; Capel, Demaison, et al. 2005; Chabi et al. 2008; Jackson et al. 2011; Andersson et al. 2011; Miller et al. 2012). This overproduction of RONS is mainly due to mitochondrial dysfunctions (Capel, Rimbert, et al. 2005; Chabi et al. 2008) and increased xanthine oxidase activity (Lambertucci et al. 2007; Ryan et al. 2011), and leads to an increase in oxidative damage to skeletal muscle cellular components. These oxidative damage reflect the inability of antioxidant systems to contain this RONS overproduction and attests an imbalance of the "oxidants-antioxidants" balance leading to an impaired redox homeostasis. It seems that the restoration of redox homeostasis by the different preventive strategies previously exposed involves an up-regulation of the glucose-6-phosphate dehydrogenase
(G6PDH) enzyme muscle protein content and/or activity (Kovacheva et al. 2010; Sinha-Hikim et al. 2013). G6PDH is the first and rate-limiting enzyme of the pentose phosphate pathway which would supply NADPH to several antioxidant systems (M. D. Scott et al. 1993). Moreover, few data in vitro or in vivo have suggested that G6PDH would play an important role in muscle mass regulation. However, these data need to be confirmed.
In this context, this thesis will attempt to answer three general objectives. The first objective is to determine in vivo to what extent a pro-oxidant redox status within the aged muscle tissue may modulate signaling pathways involved in cellular mechanisms underlying sarcopenia. The second objective is to show that return to normal functioning of these signaling pathways requires a restoration the redox homeostasis. Finally, the third objective of this thesis is to identify actors and their possible cellular mechanisms in the maintenance and/or the restoration of the redox status.
Chapter 1: What is Sarcopenia?
1.
Definitions of sarcopenia
1.1. The origins of the word “Sarcopenia”
A reduction in lean body mass and an increase in fat mass is one of the most striking and consistent changes associated with advancing age. Skeletal muscle and bone mass are the principal components of lean body mass to decline with age (Tzankoff & Norris 1978). These changes in body composition appear to occur throughout life and have important functional and metabolic consequences. In 1931, MacDonald Critchley was the first to recognize that muscle mass decreases with aging and noted that it is most noticeable in intrinsic hand and foot muscles (Critchley 1931). At the beginning of the 1970’s, Forbes was the first researcher to report prospective data on the age-related decrease in muscle mass in a small group of adults using potassium40 counting data (Forbes & Reina 1970). The reported decline was -0.41% per year as obtained in 13 men and women aged between 22 and 48 years old. Evidence suggests that up to 40% of muscle mass may be lost between the ages of 20 and 70 years (Rogers & Evans 1993) and can exceed over 50% among those aged 80 years and older (Baumgartner et al. 1998). The decline of skeletal muscle mass may accelerate along with aging, which is 6% per decade between 30 and 70 years of age (Fleg & Lakatta 1988), 1.4% to 2.5% per year after age 60, and could start as early at 35 years of age (Frontera & Hughes 2000).
In 1988, Irwin Rosenberg noted that ‘no decline with age is more dramatic or potentially more functionally significant than the decline in muscle mass’ and proposed for the first time, the term ‘sarcopenia’ (Greek ‘sarx’ or flesh + ‘penia’ or loss) to describe this age-related decrease of muscle mass (Rosenberg 1989).
1.2. First definitions based only on muscle mass
So, sarcopenia was first defined as the progressive general decline in muscle mass that occurs with aging (Roubenoff & Hughes 2000).
The first epidemiological studies fixed to a strict definition of sarcopenia as loss of muscle mass. In this context, some studies have suggested criteria based on the use of dual-energy x-ray absorptiometry (DXA) to quantify muscle mass. For instance, Baumgartner et al. (1998) summed the muscle mass of the four limbs as appendicular skeletal muscle mass
(ASM), and expressed muscle mass as ASM/height² (as kg/m²). Individuals with a ASM/height² two standard deviations (SD) below the mean of a middle-age reference male and female population (aged 18-40 years) from the Rosetta study (Gallagher et al. 1997) were defined as gender-specific cutpoints for sarcopenia. Later, others proposed the use of a skeletal muscle mass index (SMI) based on the total skeletal muscle mass divided by the body weight and multiplied by 100 (Janssen et al. 2002). With this definition, two stages of sarcopenia are considered: a stage 1 when the index is between 1 and 2 standard deviations compared to a younger population of reference, a stage 2 when the index is less than 2 standard deviations (Janssen et al. 2002). Another method based on appendicular skeletal muscle mass adjusted for height and body fat mass (also called residuals) was proposed by Newman et al. in 2003 and showed that fat mass should be considered in estimating prevalence of sarcopenia in women and in overweight or obese individuals (Newman et al. 2003). This method began to show some limits of a definition based only on muscle mass.
1.3. Limits of only using muscle mass to define sarcopenia
There are many crucial aspects of sarcopenia that are missed by the unique use of muscle mass. Relevant patient outcomes of sarcopenia include mortality and physical disability (i.e. the inability to walk or perform activities of daily living). Some studies have shown that reduced skeletal muscle mass is predictive of disability and mortality but numerous studies have shown that muscle mass by itself is a weak predictor of outcomes (Visser et al. 2000; Visser et al. 2005; Newman et al. 2006; Gale et al. 2007; Hairi et al. 2010; Goodpaster et al. 2006). It has also been shown that the relation between muscle mass, muscle function (strength and power) is not linear (Goodpaster et al. 2006; Janssen 2004). Indeed, although loss of strength tends to track with loss of muscle mass with aging without any pathologies, the decline in muscle strength is steeper than the decline in muscle mass (Frontera & Hughes 2000; Doherty 2003). Moreover, interventions that increase muscle mass do not necessarily increase muscle strength (Wittert et al. 2003). Furthermore, changes in muscle strength that occur with resistance training precede measurable changes in muscle mass temporally and exceed them in size (Sillanpää et al. 2009). On the other hand, loss in strength is not necessarily present with voluntary weight loss despite the associated loss of skeletal muscle (Wang et al. 2007). Finally, correlations between change in muscle mass and change in strength in older adults are inconsistent and not very robust (Goodpaster et al. 2006).
Some reasons can explain this dichotomy between muscle mass and strength such as age-related infiltration into skeletal muscle by fat, which is a powerful predictor of future disability and mortality (Visser et al. 2005).
Finally, the limit of only using skeletal muscle mass to define sarcopenia is the variety of measures available to evaluate this compartment. Each of these leads to slightly different cutoffs for muscle mass and are indirect measures. As such, they can be influenced by adiposity and total body water (Dumler n.d.; Heyward 1996; Omran & Morley 2000). These different methods (DXA, Computed Tomography, Magnetic Resonance Imagery, and Bioelectrical Impedance) will be presented in another chapter.
Given the inconsistency of the sarcopenia definition based only on muscle mass, and the evidence that this latest has practical limitations, since 2005 several groups from the United States and Europe have redefined sarcopenia.
1.4. Consensus definitions of sarcopenia
Four working groups (the European Society of Clinical Nutrition and Metabolism: ESPEN; the European Working Group on Sarcopenia in Older People: EWGSOP; the International Working Group on Sarcopenia: IWGS; the Society of Sarcopenia, Cachexia and Wasting Disorders: SSCWD) published recently international consensus definitions (Muscaritoli et al. 2010; Cruz-Jentoft et al. 2010; Fielding et al. 2011; Morley et al. 2011) that will be presented in chronological order of publication. Other study groups, such as the Biomarkers Consortium, have convened for the same purpose of developing a consensus statement but have not yet published their findings.
The ESPEN defined sarcopenia as “a condition characterized by loss of muscle mass and muscle strength” (Muscaritoli et al. 2010). They introduce sarcopenia as a disease of the elderly but stipulate that its development may be associated with other conditions that are not exclusively seen in older persons like disuse (due to immobility, physical inactivity, bed rest…), malnutrition, neurodegenerative diseases and cachexia. Consequently, younger people can be sarcopenic especially those with inflammatory diseases.
The EWGSOP defined sarcopenia as “a syndrome characterized by progressive and generalized loss of skeletal muscle mass and strength with a risk of adverse outcomes such as physical disability, poor quality of life and death” (Cruz-Jentoft et al. 2010). To assess the severity of sarcopenia, muscle strength and physical performance are added to the muscle mass evaluation. These authors suggested a conceptual staging as ‘presarcopenia’, ‘sarcopenia’ and ‘severe sarcopenia’ (see table 1). The ‘presarcopenia’ stage is characterized
by low muscle mass without impact on muscle strength or physical performance. The ‘sarcopenia’ stage is characterized by low muscle mass, plus low muscle strength or low physical performance. ‘Severe sarcopenia’ is the stage identified when all three criteria of the definition are met (low muscle mass, low muscle strength and low physical performance).
Table 1. EWGSOP conceptual stages of sarcopenia (Cruz-Jentoft et al. 2010).
Stage Muscle Mass Muscle Strength Physical Performance
Presarcopenia -
Sarcopenia - - Or -
Severe Sarcopenia - And - And -
EWGSOP recognizes sarcopenia as a condition with many causes and varying outcomes and although sarcopenia is mainly observed in older people, it can also develop in younger adults. Moreover, this group suggests recognizing sarcopenia as a geriatric syndrome. Based on the identification of the cause of sarcopenia, two categories are proposed. Sarcopenia can be considered ‘primary’ (or age-related) when no other cause is evident but aging itself, while sarcopenia can be considered ‘secondary’ when one or more other causes are evident (see table 2). In many older people, the etiology of sarcopenia is multi-factorial so that it may not be possible to characterize each individual as having a primary or secondary condition.
Table 2. Suggested categorization of sarcopenia by EWGSOP (Cruz-Jentoft et al. 2010). Primary Sarcopenia
Age-related sarcopenia No other cause evident except aging
Secondary Sarcopenia
Inactivity-related
sarcopenia Can result from bed rest, sedentary lifestyle, deconditioning or zero gravity conditions
Disease-related sarcopenia
Associated with advanced organ failure (heart, lung, liver, kidney, brain), inflammatory disease, malignancy or endocrine disease
Nutrition-related sarcopenia
Results from inadequate dietary intake of energy
and/or protein, as with malabsorption,
gastrointestinal disorders or use of medications that cause anorexia
IWGS defines sarcopenia as “the age-associated loss of skeletal muscle mass and function” (Fielding et al. 2011). Sarcopenia is presented by these authors as a multifactorial syndrome that can include disuse, altered endocrine function, chronic disease, inflammation, insulin resistance, and nutritional deficiencies.
SSCWD provides a definition more directly applicable in the clinical world. Indeed, these authors decided that “sarcopenia with limited mobility” would be an acceptable term to define persons with a need for therapeutic intervention and presented it as a syndrome not a disease (Morley et al. 2011). Finally, sarcopenia with limited mobility was defined as “a person with muscle loss whose walking speed is equal to or less than 1 m/s or who walk less than 400 m during a 6 minutes walk test”. The limitation in mobility should not be clearly attributable to the direct effect of specific disease (e.g. peripheral vascular disease, dementia or cachexia).
1.5. Convergences and differences of the various definitions
Although all these definitions are different, they present a high level of agreement in some aspects of sarcopenia.
1.5.1. Sarcopenia as a syndrome not a disease
In the literature, sarcopenia can be presented as an age-related process of normative aging, a disease or a syndrome.
Among these four groups, only the ESPEN considers the sarcopenia as a disease of the elderly whereas the other three groups present it as a syndrome. It is thus clear that sarcopenia (or “sarcopenia with limited mobility”) is a syndrome but there is still a debate around the fact of considering it as only a geriatric syndrome.
Indeed, although the four groups agree that sarcopenia is strongly related to age, they also agree on the fact that other factors not related to age (e.g. malnutrition, bed rest, cachexia, and endocrine disease) could be the cause of sarcopenia in subjects not considered old. EWGSOP would speak about a secondary sarcopenia as described previously. On the other hand, a minority of SSCWD would support the use of the term ‘‘myopenia’’ to indicate the presence of clinically relevant muscle wasting owing to any illness at any age (Morley 2007; Fearon et al. 2011) and would reserve the use of ‘‘sarcopenia’’ for older persons. Some have argued that the term dynapenia is better suited to describe age-associated loss of muscle strength and function. Finally, sarcopenia is already a widely recognized term, so replacing it might lead to further confusion (Cruz-Jentoft et al. 2010).
The term of geriatric syndrome refers to a frequent, complex and expensive condition at the origin of the deterioration of the health during aging. The consideration of several criteria is generally used to consider a set of clinical signs characterizing a geriatric syndrome. These criteria include prevalence of these signs at the elderly, multifactorial causes as well as the negative consequences which these clinical signs have on the physical independence of the individual. Sarcopenia represents an impaired state of health with a high personal toll-mobility disorders, increased risk of falls and fractures, impaired ability to perform activities of daily living, disabilities, loss of independence and increased risk of death (Cawthon et al. 2007; Lauretani et al. 2003; Rolland et al. 2008; Topinková 2008; Hartman et al. 2007).
With regard to these various criteria, it thus seems obvious that sarcopenia must be considered as a real geriatric syndrome as supported by EWGSOP but some particularly situations may raise doubts this.
1.5.2. Not only muscle mass
The clinical relevance of sarcopenia depends on its being a marker of impaired outcomes, mortality being the most striking, but perhaps not the most relevant. Physical disability is a major concern in old people (Cruz-Jentoft 2012), and from a practical point of view, appears as a more relevant outcome. Furthermore, as presented previously, numerous studies showed that the muscular mass is a weak predictor of outcome (Visser et al. 2000; Visser et al. 2005; Newman et al. 2006; Gale et al. 2007; Hairi et al. 2010; Goodpaster et al. 2006) and that the relation between muscle mass and muscle function (strength and power) is not linear (Goodpaster et al. 2006; Janssen 2004). Thus, measurement of muscle strength and/or physical performance appears essential parameters in the diagnosis of sarcopenia because they reflect the actual physical capacity of the individual to deal with demands of everyday life. This is why, the four groups all added besides the muscular mass at least a criterion of physical performance and/or muscular function. All groups suggest a criterion based on walking speed and only EWGSOP recommends also assess muscle strength but does not specify a method to use. Muscle fatigue could be another parameter in the diagnosis of sarcopenia but there is no standardized tool to evaluate it.
1.5.3. Diagnosis and strategy of case finding
Identifying subjects with sarcopenia, both for clinical practice and for selection of individuals for clinical trials, seems to be an important task.
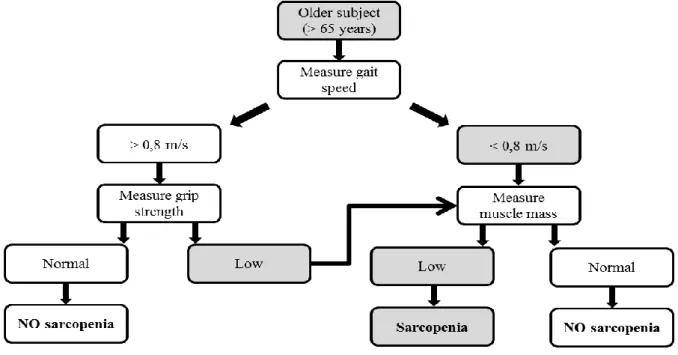
ESPEN suggests diagnosing sarcopenia when two criteria are fulfilled: a low muscle mass and a low gait speed. For their part, normal muscle mass is defined using data derived from young subjects aged 18–39 years from the Third NHANES population (Janssen et al. 2002), and the requirement for a diagnosis of sarcopenia is the presence of a muscle mass ≥2 standard deviations below the mean of this reference population. This value can normally be calculated automatically by equipment such as DXA. A low gait speed is defined as a walking speed below 0.8 m/s in the 4-m walking test (Guralnik et al. 2000). However, this working group provides no guidance on the population that would need to be evaluated. As mentioned earlier, EWGSOP suggested diagnosing sarcopenia when at least two of three criteria apply: low muscle mass, low muscle strength, and/or low physical performance. To diagnose sarcopenia, these authors have developed a gradual approach based on gait speed measurement as the easiest and most reliable way to begin sarcopenia case finding or screening in practice (Figure 1) and chose a cut-off point of >0,8 m/s (identified as a predictive risk factor for adverse outcomes, Abellan van Kan et al. 2009). Here, all people aged over 65 should be evaluated starting with the measure of gait speed. If it is strictly lower than 0,8m/s, grip strength will be performed. In the case of a normal value, people are considered as non sarcopenic. On the other hand, muscle mass will be evaluated. If it reaches a low value, people are considered as sarcopenic. Otherwise, people are considered as non sarcopenic. Cut-off point for grip strength and muscle mass depend on the measurement technique chosen and this is probably why EWGSOP just provides a table with some of them extracted from articles.
Figure 1. EWGSOP-suggested algorithm for sarcopenia case finding in older individuals
(Cruz-Jentoft et al. 2010).
For IWGS, diagnosis of sarcopenia should be based on having a low whole body or appendicular fat free mass in combination with poor physical functioning. Current methods index appendicular fat free mass to height squared or whole body fat free mass to height squared. In patients with poor functional capacity, most easily identified using gait speed of than 1 m/s, sarcopenia can be diagnosed when the lean mass is less than 20% tile of values for healthy young adults. Currently objective cut points can be made for sarcopenia in men at an appendicular fat free mass/ ht2 of ≤ 7.23 kg/m2 and in women at ≤ 5.67 kg/m2 (Newman et al. 2003). For these authors, presence of sarcopenia should be evaluated in older patients (no age specified) who have clinically observed declines in physical functioning, strength, or health status. Sarcopenia should also be considered in patients who present difficulties in performing activities of daily living, have a history of recurrent falls, have documented recent weight loss, have recently been hospitalized, or have chronic conditions associated with muscle loss (e.g. Type II diabetes, chronic heart failure, chronic obstructive pulmonary disease, chronic kidney disease, rheumatoid arthritis, and malignancies). Sarcopenia should be considered in patients who are bedridden, non-ambulatory, or who cannot rise from a chair unassisted. In addition, for patients who are ambulatory and can arise from a chair, gait speed should be assessed across a 4 meter course. Patients with a measured gait speed less than 1.0 m/s should be referred for body composition assessment using whole body DXA.
SSCWD use the term “sarcopenia with limited mobility” and diagnose it when “a person with muscle loss whose walking speed is equal to or less than 1 m/s or who walk less than 400 m during a 6 minutes walk test”. The person should also have a lean appendicular mass corrected for height squared of more than two standard deviation below that of persons between 20 to 30 years of age of the same ethnic group (Morley et al. 2011). This working group recommends that all patients older than 60 years who are falling, who feel that their walking speed has decreased, who were recently hospitalized, who have been on prolonged bed rest, who have problems arising from a chair, or who need to use an assistive device for walking should be screened for sarcopenia with mobility impairment.
Again, there is no real consensus because diagnosis and strategy of case finding are directly linked with the definition used but two different approaches appear. One is based on screening the general population (EWGSOP) whereas the others look for identifying some risk groups (SSCWD and IWGS). The age to investigate the presence of sarcopenia is still in debate (EWGSOP: ≥65years; IWGS: ≥60years) but would be around the sixties. For any given parameter included in a definition, there is a need to identify cutoff points that separate normal from abnormal values. The choice of cutoff values is arbitrary by nature, as it depends upon the measurement technique and the reference population chosen. There is not yet well-defined reference population but the trend would be to use a normative (healthy young adult) rather than other predictive reference population, with cutoff points at two standard deviations below the mean of healthy persons between 20 to 30 years of age of the same ethnic group. For the parameters directly related to the diagnosis of sarcopenia, all authors agree on assessing muscle mass and employing gait speed to assess physical performance. EWGSOP recommends completing physical performance assessment by measuring muscle strength.
1.6. Prevalence of Sarcopenia
Currently, the prevalence of sarcopenia varies extensively when different definitions, instruments of measurements, reference population (when one is used), skeletal muscle mass expression, methods of determining cutoff values are considered. This fact supports the need for a universal consensus of sarcopenia with full considerations of the aforementioned factors.
First, the prevalence of sarcopenia will depend on the used definition. Recently, Abellan van Kan et al. (2013) applied to the EPIDOS French cohort (3,025 women aged 75 years and older) six different definitions commonly used in literature (Baumgartner et al. 1998; Newman et al. 2003; Delmonico et al. 2007; Cruz-Jentoft et al. 2010; Fielding et al. 2011; Morley et al. 2011). Definitions based only on muscle mass (Baumgartner et al. 1998;
Newman et al. 2003; Delmonico et al. 2007) showed a higher prevalence than definition taking into account muscle mass, strength and physical performance (Cruz-Jentoft et al. 2010; Fielding et al. 2011; Morley et al. 2011). In the first case, values range from 9,4% to 18,8% whereas in the second case they are ranged between 3,3% and 14,2%. Very recently, authors have shown that the values obtained with the EWGSOP definition are higher than those obtained by the definition of IWGS. This result persisted whatever the index of muscle mass used (Lee et al. 2013).
The technique used to measure muscle mass also influence the prevalence of sarcopenia. In the New Mexico Elder Health Survey, sarcopenia defined as ASM/height² and measured by bioelectrical impedance affected 20% of men between 70 and 75 years, 50% of those over 80 years and between 25 and 40% in women in the same age groups (Baumgartner et al. 1998). Using DXA, the same authors published data from the same population of 8.8% in women and 13.5% in men aged 60-69 years and 16% in women and 29% in men over 80 years (Baumgartner 2000).
Using the same definition but with two different reference populations (National Health and Nutrition Examination Survey III and Cardiovascular Health Study), Janssen et al. showed different results. In the first case, the prevalence of sarcopenia was lower in men than women (7% vs 10%) while the opposite occurred in the second case (17% vs 11%).
The prevalence values will vary depending on the used method to express muscle mass: ASM divided by height² or by size and fat (residual method) (Baumgartner et al. 1998; Newman et al. 2003; Coin et al. 2013; Figueiredo et al. 2013; Dufour et al. 2013; Lee et al. 2013); total muscle mass divided weight and multiplied by 100 (Janssen et al. 2002; Janssen 2004; Janssen 2006). Thus, in men over 70 years, prevalence data reached 13.5% using ASM/height² and 19.8% with the residuals method (Figueiredo et al. 2013). In the same way, Dufour et al. (2013) reported prevalence values of 19% among men and 13% among women with ASM/height² and a value of 25% for men and women with residuals. From these studies, it appears that ASM/height² would be better to use with underweight people while residuals method would be more appropriate with normal and overweight people.
On the other hand, the used methods to determine cutoff values can influence the prevalence of sarcopenia. For example, one Italian group applied to the same population (men and women aged between 20 and 80 years) three different cutoff values for ASM/height² (Coin et al. 2013). The first cutoff points were obtained by subtracting 2 SDs from the mean ASM/height² value for their 20-39 years old healthy subjects. With these cutoff points (6.54 kg/m² in men and 4.82 kg/m² in women), prevalence of sarcopenia was 0% in men and 0,3%
in women. In the second case, the 15th percentile of the distribution of the ASM/height² for their young population (corresponding to about 1 SD below the mean) was used. Then, the cutoff points for sarcopenia were 7,59 kg/m² in men and 5.47 kg/m² in women, giving rise to a prevalence of 19.2% and 12.6%, respectively. In the third case, the cutoffs were obtained instead for an elderly population (older than 65 years) using the 20th percentile of the distribution of the ASM/height² (Health ABC Study: white and black American men and women aged 70 to 79 years, Delmonico et al. 2007). A cutoff of 7.64 kg/m² in men and 5.78 kg/m² in women was obtained. Then, prevalence of sarcopenia was 20% for both genders. Finally, compared with the classical definition of sarcopenia, modern diagnostic criteria added considerations of muscle strength and physical performance to the muscle mass, which lowered the prevalence of sarcopenia (Abellan van Kan et al. 2013; Lee et al. 2013).
2.
Making a Diagnosis of sarcopenia
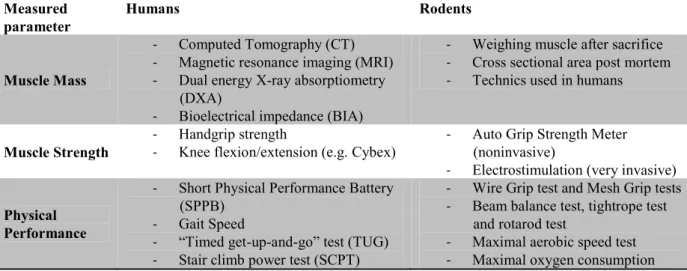
To diagnose sarcopenia and the degree of it, it should be based on specific indicators of muscle mass and strength as well as physical performance. One of the current problems is to determine these parameters as precisely as possible. This part is devoted to outline the different measurement techniques in humans and rodents that can be implemented to diagnose sarcopenia. Table 4 resumes all these techniques.
2.1. Muscle mass assessment
Table 3 resumes the most used methods to assess muscle mass which are well reviewed in the following papers: Woodrow 2009; Lustgarten & Fielding 2011; Cooper et al. 2013.
Three imaging techniques can be used to estimate muscle mass or lean body mass of a person: computed tomography (CT) scan, magnetic resonance imaging (MRI) and DXA. CT and MRI are the most precise imaging systems and the only able to measure fat infiltration and non-contractile components into skeletal muscle and therefore determine muscle quality (Simoneau et al. 1995; Kent-Braun et al. 2000). Despite their cost, these methods are the actual gold standards for estimating muscle mass in research.
Then, DXA constitutes an attractive alternative method both for research and for clinical use to distinguish fat, bone mineral and lean tissues (Cruz-Jentoft et al. 2011) because it is cheaper, faster and expose to a lesser levels of radiation than MRI and CT with a good
scale epidemiological studies (Chien et al. 2008).
Thanks to validated prediction equations for multiethnic and baseline populations, men and women, including the elderly (Roubenoff et al 1997. Janssen et al 2000) make bioelectric impedance (BIA) a good tool for epidemiological studies and clinical practice. The test is perfectly appropriate for both ambulatory and bedridden patients as many of the elderly are.
Anthropometric measures (e.g. skinfold thickness, calf circumference) can be possibly used to evaluate body composition but related-age changes of fatty deposits and loss of skin elasticity contribute to generate errors in older populations. Finally, anthropometric measures are considered as not relevant in the elderly because of the risk of confusion in the analysis of these parameters (Rolland et al. 2008).
In the context of research carried out in rodents, the mass of one or several muscles (soleus, gastrocnemius) or cross sectional areas (CSA) are conventionally measured post-mortem. Generally, these estimations are considered as reference methods for sarcopenia studies but imaging techniques or BIA usually used in humans are more and more used in rodents.
Table 3. Muscle mass assessment technics (adapted from Cruz-Jentoft et al. 2011).
Methods Advantages Drawbacks Principal Field of
application
TC and MRI Gold Standard
Muscle quality assessment Qualified personal requirement Very Expensive High radiation exposure (CT)
Few equiments No immediate results
Investigation
DXA Moderate cost Moderate radiation exposure
Very good precision No experimented personal
Not portable
No information about muscle quality Influenced by hydration status
No immediate results
Clinical practice Investigation
BIA Inexpensive Good precision Portable (bedridden patients)
No radiation exposure No experimented personal
Immediate results
No information about muscle quality Less sensitive than earlier techniques
Influenced by hydration status
Clinical practice Epidemiological
studies
Anthropometry Inexpensive
Easy to realize Portable (bedridden patients)
Low precision and sensibility
Difficulty in interpreting the results Neither CT: computed tomography; MRI: magnetic resonance imaging; BIA: bioelectric impedance
2.2. Strength assessment
The assessment of muscle strength (the maximum capacity of a muscle to generate force in a very short time) is now a parameter in its own right of diagnosis of sarcopenia. There are fewer well-validated techniques to measure muscle strength. On the other hand, the muscle fatigue (defined as ‘‘the inability of the muscle to generate or maintain the levels of strength required for a given work rate’’ by Vøllestad 1997) is also a parameter which should be taken into account in the diagnosis of this syndrome (Theou et al. 2008). Indeed, the activities of daily life ensuring independence of elderly or inactive person require maintaining or repeating submaximal muscular effort and rarely produce maximum muscle effort (Petrella et al. 2005). Again, cost, availability and ease of use can determine whether the techniques are better suited to clinical practice or are useful for research. It must be remembered that factors unrelated to muscle (e.g. motivation or cognition) may hamper the correct assessment of muscle strength.
In humans, lower limbs strength can be measured under isometric or isokinetic conditions. The assessment of maximal isometric strength is usually measured as the maximum force applied to the ankle (Edwards et al. 1977). Assessment of muscle fatigue can be performed by determining the force-holding time curve during isometric contraction for a given percentage of the maximum force (e.g. 40%). Nevertheless, choice of isokinetic conditions appears more relevant but did not appear functional because they required the subject to consistently achieve maximum effort until fatigue, which is not really a task performed by elderly people in their daily life (Lindström et al. 1997). This is why more recent studies assess muscle fatigue under isotonic conditions by measuring for example the ability to maintain or repeat an exercise as quickly as possible for a given sub maximal strength (McNeil & Rice 2007). Nowadays, isokinetic dynamometers (e.g. Cybex) permit to assess isometric, isotonic and isokinetic strength, as the couple concentric strength developed at different angulations (Hartmann et al. 2009). Some data are now available in older populations for maximum strength and muscle fatigue in isotonic or isokinetic condition (Neder et al. 1999; Goodpaster et al. 2001). If isokinetic appears appropriate for research, its use in clinical practice is limited due to a specific and expensive equipment requirement. Although lower limbs are more relevant than upper limbs for gait and physical function, handgrip strength has been widely used and is well correlated with most relevant outcomes. Isometric hand grip strength is strongly related with lower extremity muscle power, knee extension torque and calf CSA (Lauretani et al. 2003). Thus, low handgrip strength is a
clinical marker of poor mobility and a better predictor of clinical outcomes than low muscle mass (Lauretani et al. 2003). In practice, there is also a linear relationship between baseline handgrip strength and incident disability for activities of daily living (Al Snih et al. 2004). Finally, low cost, availability and ease of use make this method is widely used in both clinical practice and research.
In rodents, grip strength tests are a widely-used non-invasive method designed to evaluate mouse limb strength. It is based on the natural tendency of the mouse to grasp a bar or grid when it is suspended by the tail. During these tests the mouse grips with both forelimbs and/or hind-limbs a single bar or a mesh. Three different tests are commonly used. The Mesh Grip Test measures the ability of the mouse to remain clinging to an inverted or tilted surface such as a wire grid or a cage lid for a period of time. This test shows that the muscle endurance is altered at 24 months in rats (Joseph et al. 1983; Spangler et al. 1994). The Wire Grip Test (or Rod suspension test) measures the ability of the mouse to hang on a wire with its forepaws for a preset length of time or until grip fails. This test appears to be a useful indicator for the diagnosis of sarcopenia since the time of suspension in rats from 22-24 months decreases (Spangler et al. 1994; Goettl et al. 2001). Finally, with the Automatic Grip Strength (AGS) the mouse grasps a horizontal metal bar or grid while is pulled by the tail. The bar or grid is attached to a force transducer that peak pull-force achieved on its digital display. The AGS is the unique noninvasive test giving a numeric value. In the three tests, the value obtained has to be relativized by the animal weight.
However, the strength and muscle fatigue are generally assessed invasively. More specifically, the muscle is removed and the tendon ends are connected to a dynamometer and two electrodes. A suitable electric current is sent in order to generate a maximum tetanic stimulation considered developable maximum force by the muscle. Muscle fatigue is itself estimated by the difference in maximum force developed by the muscle between the beginning and 4-5 minutes from electrical stimulation (Ryall et al. 2007; Ljubicic & Hood 2009). These approaches in animals have the advantage of assessing the intrinsic muscle strength, regardless of neural factors.
2.3. Physical performance assessment
The gait speed is now the recommended parameter to assess physical performance to diagnose sarcopenia (Cruz-Jentoft et al. 2010; Fielding et al. 2011; Morley et al. 2011) but others test provided specifically for elderly people are also accepted. The most commonly used are the Short Physical Performance Battery (SPPB) (standardized battery of short physical tests), the timed Get-up-and-go (TUG) or the Stair climb power test (SCPT).
Gait speed is usually evaluated by the six meters test recommended by IWGS and SSCWD (Fielding et al. 2011; Morley et al. 2011) or the four meters test recommended by EWGSOP (Cruz-Jentoft et al. 2010). Cutoff points for sarcopenia are defined as a speed lesser than 1m/s in first case and lesser than 0,8m/s in the second case (Cesari et al. 2009). Gait speed can be used in clinical practice and research. The SPPB evaluates balance, gait speed, strength and endurance by examining an individual’s ability to stand with the feet together in side-by-side, semi-tandem and tandem positions, time to walk 8 feet and time to rise from a chair and return to the seated position five times (Guralnik et al. 1994). Each event allows get a performance score and the sum of the scores of all tests provides an overall performance. A score below 8 is in favor of sarcopenia (Guralnik et al. 2000). SPPB is a standard measure for research and clinical practice. The TUG is a test to measure the time required to perform a series of basic motor tasks. The subject must stand up from a chair, walk a short distance, turn around and come back to sit. It allows the estimation of the dynamic balance that is assessed on a scale of 1 to 5 (Mathias et al. 1986). A score below 3 would be in favor of sarcopenia (Mathias et al. 1986). Finally, the SCPT used clinically estimates the power of the lower limbs (Bean et al. 2007). The subject must perform the rise of 10 markets as soon as possible. The power of the lower limbs is then calculated in relation to the height of the market, the rate of rise and standardized with the weight of the subject (Bean et al. 2007). It may be useful in some research settings but cutoff point in sarcopenia context needs to be not defined.
In rodents, a number of tests are also available to assess the physical performance in old animals (Table 4). One of them consists in measuring the time that the rodent can stay in balance on a narrow beam (Beam Balance Test) or a tightrope (tightrope test). A significant reduction in maintenance time is observed in rats from 23-24 months testifying alterations in the balance and coordination of the animal (Altun et al. 2007; Emerich et al. 2008). As previously described, Mesh Grip, Wire Grip and Auto Grip strength tests can be used to evaluate muscle function. Endurance capacity can be assessed by maximal aerobic speed tests (Derbré et al. 2012) or maximal oxygen consumption tests (Høydal et al. 2007).
Table 4. Summary of methodologies used to assess muscle mass, muscle strength and
physical performance in humans and rodents.
Measured
parameter Humans Rodents
Muscle Mass
- Computed Tomography (CT) - Magnetic resonance imaging (MRI) - Dual energy X-ray absorptiometry
(DXA)
- Bioelectrical impedance (BIA)
- Weighing muscle after sacrifice - Cross sectional area post mortem - Technics used in humans
Muscle Strength - - Handgrip strength Knee flexion/extension (e.g. Cybex)
- Auto Grip Strength Meter (noninvasive)
- Electrostimulation (very invasive)
Physical Performance
- Short Physical Performance Battery (SPPB)
- Gait Speed
- “Timed get-up-and-go” test (TUG) - Stair climb power test (SCPT)
- Wire Grip test and Mesh Grip tests - Beam balance test, tightrope test
and rotarod test
- Maximal aerobic speed test - Maximal oxygen consumption
3.
Muscle characteristic changes during aging leading to sarcopenia
3.1. Loss of muscle mass
It is considered that a reduction of about 40% of the CSA of occurs between 20 and 80 years in humans (Doherty et al. 1993; Vandervoort 2002). Works on the topic are mainly based on data obtained from the lower limbs using various techniques mentioned above (see table 3). Via ultrasound imaging, Young et al. (1985) reported such reductions of 25 to 35% beyond the quadriceps CSA in elderly men by an average of 30-70 years. Similar results were observed by CT in the quadriceps (Klitgaard et al. 1990) and in the biceps and triceps (Rice et al. 1989; Klitgaard et al. 1990). These results are also confirmed by measurements made directly on the CSA post-mortem muscle with a decrease of approximately 40% in elderly subjects on average 20 to 80 years (Lexell et al. 1988).
Rodents, especially rats, are experimental animal models particularly useful for the study of sarcopenia. Depending on the species, rats are considered as aged between 18 and 30 months (Hopp 1993). Fischer 344 Brown Norway F1 hybrid rats with a higher life expectancy than other species of rats (40 months) are one of the most used specie to study sarcopenia. In this strain, a decrease from 30 to 50% by weight of the gastrocnemius was observed between 6 and 30 months (Haddad et al. 2006; Hofer et al. 2008; Marzetti, Wohlgemuth, et al. 2008; Siu et al. 2008). The Wistar strain has also been very well used. A significant reduction in muscle mass is observed after 24 months in mixed fiber type muscles such as gastrocnemius (Capel et al. 2004; Mosoni et al. 2004). Significant decreases were also reported in this species in the soleus muscle from 28 months old animals (Mosoni et al. 2004; Degens et al.
2008). Usually, nevertheless the strain, around 18 months (middle age for rats), the weight of the soleus, extensor digitorum longus (EDL), gastrocnemius but also quadriceps, tibialis anterior and plantaris is reduced compared to animals aged 6 or 12 months (Kimball et al. 2004; Paturi et al. 2010; Ibebunjo et al. 2013). This decrease is relatively slow and low at 18 months (about 10%) but accelerates thereafter to reach -30 to -40% at 24 months (old age) (Kimball et al. 2004; Paturi et al. 2010; Ibebunjo et al. 2013). In very old animals, this decrease can reach up to 60% in some muscles notably the gastrocnemius (Kimball et al. 2004; Ibebunjo et al. 2013).
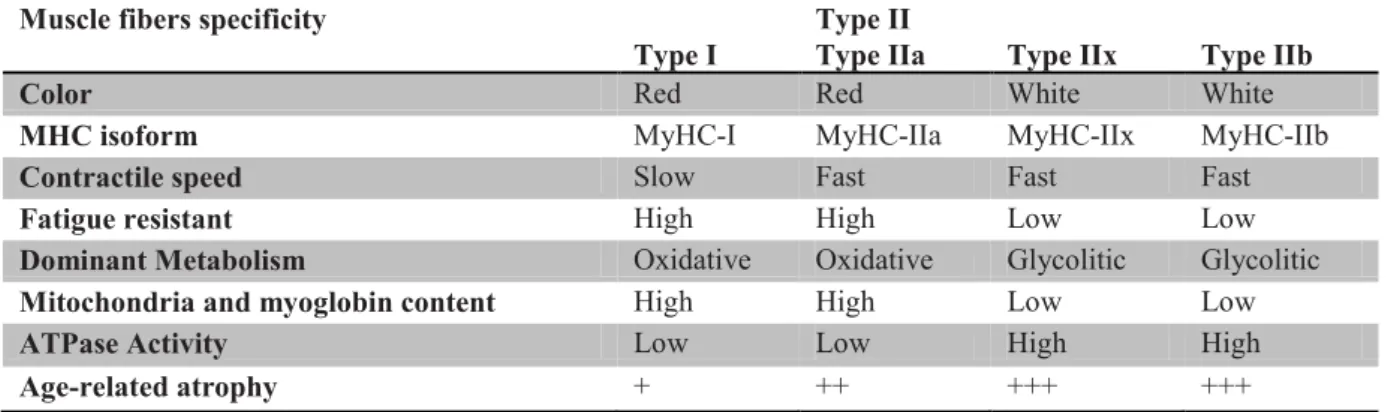
Skeletal muscles are heterogeneous at the level constituent muscle fibers. Physiological properties, such as contractile speed, resistance to fatigue, metabolism, mitochondria myoglobin content and ATPase activity and various enzyme content vary among types of muscle fibers (see table 6). In skeletal muscle, it is possible to distinguish four major fiber types, called type I, IIa, IIx and IIb, based on the presence of specific myosin heavy chain (MyHC) isoforms: MyHC-I, MyHC-IIa, MyHC-IIx and MyHC-IIb (Schiaffino & Reggiani 2011). These fibers also differ in oxidative/glycolytic metabolism. These four fiber populations are present in mice, rats and many other mammalian species, however only type I, IIa and IIx fibers are present in human muscles (Smerdu et al. 1994). In addition, intermediate hybrid fibers, containing type I and IIa, or IIa and IIx, or IIx and IIb MyHCs, are frequent in normal muscles (DeNardi et al. 1993) and become more numerous whenever fiber type shifts take place (Klitgaard et al. 1990; Maier et al. 1988; Patterson et al. 2006).
The age-related decrease in muscle mass is mainly due to a loss of muscle fibers affecting both fiber types I and II (Young et al. 1985; Aniansson et al. 1986; Lexell et al. 1988). While a decrease of only 5% of the number of fibers occurs between 24 and 50 years, a reduction of 30 to 40% is reported between 50 and 80 years (Aniansson 1992). These results in reduction of about 1% per year of the total CSA beyond 50 years (Kent-Braun 1999; Frontera et al. 2000b). However, atrophy of the muscle fiber (reduction of its diameter) is also implicated in the decrease of muscle mass associated with age (Aniansson et al. 1986; Lexell et al. 1988; Lexell and Downham 1992). Atrophy does not affect similarly all types of muscle fibers. Indeed, it is the fast type II fibers that appear to be most affected by aging, with a decline from 20 to 60% of their size (Larsson et al. 1978; Essen-Gustavsson and Borges 1986; Lexell et al. 1988; Singh et al. 1999; Hikida et al. 2000). This phenomenon seems differentiated itself in different type II fibers with larger reductions in fiber IIb and IIx type compared to type IIa fibers (Aniansson et al. 1986; Coggan et al. 1992).