HAL Id: hal-01598491
https://hal.inria.fr/hal-01598491
Submitted on 29 Sep 2017
HAL is a multi-disciplinary open access
archive for the deposit and dissemination of
sci-entific research documents, whether they are
pub-lished or not. The documents may come from
teaching and research institutions in France or
abroad, or from public or private research centers.
L’archive ouverte pluridisciplinaire HAL, est
destinée au dépôt et à la diffusion de documents
scientifiques de niveau recherche, publiés ou non,
émanant des établissements d’enseignement et de
recherche français ou étrangers, des laboratoires
publics ou privés.
Reliable and Reproducible Radio Experiments in
FIT/CorteXlab SDR testbed: Initial Findings
Leonardo Sampaio Cardoso, Othmane Oubejja, Guillaume Villemaud, Tanguy
Risset, Jean Gorce
To cite this version:
Leonardo Sampaio Cardoso, Othmane Oubejja, Guillaume Villemaud, Tanguy Risset, Jean Gorce.
Re-liable and Reproducible Radio Experiments in FIT/CorteXlab SDR testbed: Initial Findings.
Crown-com, Sep 2017, Lisbon, Portugal. �hal-01598491�
Reliable and Reproducible Radio Experiments in
FIT/CorteXlab
?SDR testbed: Initial Findings
Leonardo S. Cardoso, Othmane Oubejja, Guillaume Villemaud, Tanguy Risset, and Jean Marie Gorce
Univ Lyon, INSA Lyon, Inria, CITI, F-69621 Villeurbanne, France [email protected]
Abstract. The FIT/CorteXlab platform is a wireless testbed situated in Lyon, France, where all radio nodes are confined to an electro-magnetically (EM) shielded environment and have flexible radio-frequency (RF) front-end for experimenting on software defined radio (SDR) and cognitive radio (CR). A unique feature of this testbed is that it offers roughly 40 SDR nodes that can be accessed from anywhere in the world in a reproducible manner: the electro-magnetic shield prevents from exter-nal interference and channel variability. In this paper we show why it is important to have such a reproducible radio experiment testbed and we highlight the reproducibility by the channel characteristics between the nodes of the platform. We back our claims with a large set of mea-surements done in the testbed, that also refines our knowledge on the propagation characteristics of the testbed.
Keywords: reproducibility, software defined radio, Cognitive Radio, Wire-less testbed, FIT/CorteXlab
1
Introduction
Low cost and accessible SDR platforms have fostered more than a decade of ra-dio communication proof of concepts and experiments, as of the writing of this work. This development is comparable to the early days of personal computers, back in the mid 1970s. These platforms span a wide audience, be it radio ama-teurs, enthusiasts, hackers, and of course, wireless communications researchers. In particular, wireless communications researchers have greatly gained from us-ing these devices, allowus-ing a complete development cycle, that now spans from theoretical development of techniques and algorithms all the way to a proof of concept. This ability was once restricted to industries, military and government institutes, due to their hard and expensive nature.
As communications systems and techniques evolve, so do radio platforms re-quired to test them. The new era of radio communication systems relies on their
?
The FIT/CorteXlab testbed is a part of the Future Internet of Things (FIT) project and federation of testbeds. This work has been supported by the FIT project.
multi-user capabilities, including interference avoidance, cooperation, relaying, or simple co-existence. Many interesting research topics are under investigation in a multi-user context, from its most fundamental aspect in network information theory, or on the use of machine learning for radio system design [OH17], to more practical designs, including new waveforms, cooperative multi-user communica-tions, caching for wireless systems [FTB+17], massive simultaneous transmission
of very smallpackets for the Internet of things (IoT), massive multiple input -multiple output (MIMO) systems [AFGP16] and distributed MIMO, physical layer (PHY) network coding, millimeter wave, and agile spectrum sensing sys-tems. All these topics can profit from the evaluation on real syssys-tems. To reflect these advances, the market for radio platforms is quickly adapting to accom-modate the needs of wireless researchers. In the specific case of multi-user tech-niques, a researcher must own and control experiments over a multitude of radio platforms, which can become prohibitively expensive and complex to manage. This is where wireless testbeds come in. Wireless testbeds allow anyone aiming to experiment with multi-user wireless techniques to access a large number of high performance radio nodes in a controlled environment and with an accessible interface, that takes care of all non-essential aspects of running these kinds of experiments.
In recent years, a number of large-scale wireless radio testbeds have been developed. Most of these testbeds focus on computation and networking as-pects, with only a few targeting the wireless PHY layer. Consequently, only a few of them count with full SDR capabilities. It was with the development of high end flexible transceivers, such as the USRP, the PicoSDR, and more recently the BladeRF, that the opportunity to build larger SDR testbeds be-came a reality. The software part of SDR also played an essential role in its growing popularity. The development of signal processing and communication toolkits and frameworks such as GNU Radio [Blo04], IRIS [FTD+11] or OpenAir Interface [NMM+14] enabled the easy development of communication systems for these testbeds, that can now be prototyped by wireless communications re-searchers all over the world.
There are several PHY-centric testbeds in operation today. A pioneer wireless testbed was ORBIT [RSO16]. Initially a network level testbed, ORBIT quickly updated its nodes with SDRs as soon as they became available. It counts with hundreds of nodes, not all being SDR capable. The Cornet testbed was among the first testbeds fully dedicated to SDR. It counts with 48 SDR nodes de-ployed in one of Virginia Tech’s buildings, spread over 4 floors. Stemming from the Cornet testbed, the CREW project [DDF+10] offers a facility that
concen-trates on the IRIS toolkit to offer waveform development capabilities over its approximately 16 SDR nodes. On these testbeds, registered users can remotely access and run experiments on flexible radio platforms. These testbeds are cer-tainly among the most advanced in the world, however none of them propose an electro-magnetically shielded environment.
Focus of this work, the FIT/CorteXlab1 testbed is a facility situated at the
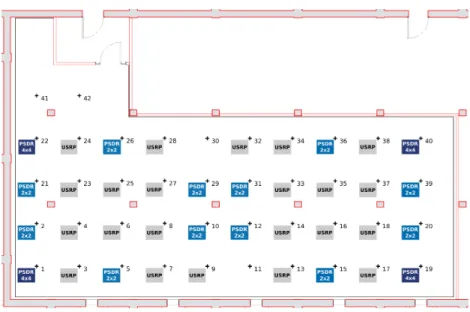
INSA Lyon campus in France, in the basement of the Telecommunications De-partment, and operated by Inria. It is composed of 38 SDR nodes that can be accessed remotely and freely from anywhere in the world. Currently, its SDR nodes can be divided into two types: 22 USRP model 2932 and 16 PicoSDR (four of them 4×4 MIMO, 12 of them 2×2 MIMO). Keeping the spirit of an open testbed, GNU Radio is used as its main SDR toolkit. One very important aspect of the FIT/CorteXlab testbed is its experiment room, of roughly 180 m2,
where all the radio nodes were deployed in a confined EM shielded environment, as seen in Fig. 1. FIT/R2Lab is a sister testbed to FIT/CorteXlab, also belong-ing to the FIT banner, and countbelong-ing with some models of USRPs in a shielded room. It was partly inspired by FIT/CorteXlab, with the main difference being that focuses on 5G, and to that end, OpenAirInterface was made available as the standard radio framework. To the best of our knowledge this is the only other large-scale testbed that offers a shielded environment.
Choosing a shielded environment for radio experimentation allows for re-laxed experimentation frequencies and scenarios, while contributing to repro-ducible experiments as well. This decision comes from fact that non-shielded radio experiments are subject to interference as well as to non-stationary radio propagation characteristics, hence being inherently random in nature. This be-comes a critical issue when these experiments are necessary to validate wireless communications algorithms, since the scientific method relies on reproducibility of experiments. Furthermore, how can we compare the results of different al-gorithms when we can not distinguish its effects, from uncontrollable effects of the surroundings? As we see, reproducibility is a key aspect of experimenting in wireless communications.
In a previous work [MCB+15], we have provided initial findings of a
chan-nel sounding campaign in FIT/CorteXlab’s experimentation room. We focused on the channel impulse response in time and frequency, trying to understand how the shielding influences the diversity of the channels in the room. That work has not studied the coverage profiles of nodes in the room as well as the path-loss between any pair of nodes. In this work, by means of a measurement campaign, we provide further information on the propagation environment of FIT/CorteXlab’s experimentation room as well as the coverage-to-transmitted-power relation of the communications done in FIT/CorteXlab for the USRP nodes. Finally, we take a step back and provide results that corroborate our claim that FIT/CorteXlab’s experimentation room can indeed be used for re-producible experiments.
The remainder of this work is divided as follows. In section 2 we discuss on when and how FIT/CorteXlab can provide reproducibility. Section 3 describes the characterization of the path-loss for FIT/CorteXlab and details the exper-imentation setup used. On section 4 we present some initial results to support
1
For more information on FIT/CorteXlab, please refer to the web-site:http://www.cortexlab.fr/.
our claims. Finally, we draw some conclusions and delineate further steps in section 5.
Fig. 1: Node positions in the FIT/CorteXlab testbed.
2
Experimental Reproducibility
The bridge between theory and experimentation is always hard to build prop-erly. Reproducibility is a key point to ensure an effective analysis of experimen-tations. Field testing is, of course, always necessary to perform a final validation of a wireless system or a complete network. But in a real radio environment, it is impossible to ensure reproducibility, and the overwhelming amount of un-controlled parameters increase the complexity of analysis. The main intent of a controlled environment like FIT/CorteXlab experimentation room is to offer both EM isolation and reproducibility and this is the main focus of this section. The first point is EM isolation. It guarantees no external signals are received during an experimentation, which in turn means that all signals measured in the testbed could only be generated in the testbed. This avoids interference from outside wireless systems, and ensures that all received interference is created by radio nodes (or other equipment) inside the experimentation room of the testbed. To that intent three measures were taken to ensure EM shielding: 1) the FIT/CorteXlab experimentation room was installed in the underground of the building that hosts it; 2) it is entirely shielded with a metallic tissue that covers all sides and; 3) partially covered with EM absorbers. Furthermore, all net-working connections enter the room through fiber optics and there is a 13.2 kW power filter installed in the incoming electrical circuit. The outside-to-inside (and vise-versa) attenuation is greater than 80 dB on the whole frequency range of
operation (roughly 300 MHz to 4 GHz). This value is large enough to consider that any signal coming from outside will be attenuated to under the noise floor of the receivers installed in the room. This environment allows experiments on any frequency within the capabilities of the SDR platforms, while protecting from outside interference, as well as from generating interference on sensitive frequencies, i.e., military, radar, mobile, etc.
The second point is on reproducibility. Of course, isolation is already a nec-essary condition to offer reproducibility, but not sufficient. We also need that the global link budget is both stable and reversible. Many PHY and MAC layer mechanisms rely on an evaluation of the link budget quality, i.e., radio signal strength indicator (RSSI), signal-to-noise ratio (SNR) or signal-to-interference plus noise ratio (SINR). Therefore, to analyze the behavior of such wireless systems, it’s essential to build experimentation with a fine control on this link budget, and with the capability of reproducing the same link budget several times with different scenarios.
In section 4 we will see that FIT/CorteXlab offers a very good reproducibil-ity in terms of global path-loss between each nodes. This reproducibilreproducibil-ity comes from several characteristics that will be detailed here. The first one is the iso-lation of the room, already explained before. EM absorbers also contribute and are considered not only for isolation, but also to reduce multi-paths reflexions in the testbed. Without absorbers, the FIT/CorteXlab room would face exces-sive reflexions, creating an unrealistic radio channel. Thus, the semi-anechoic characteristic enables the wireless path-losses to be stable, while preserving a few reflexions in order to avoid a complete free-space propagation. Two other important aspects are the fixed node positions and omni-directional wide-band antennas. They allow a fixed link budget, irrespective of the relative position of nodes and selected transmission frequency. Finally, the nodes’ transceivers are of high quality and possess relatively stable RF characteristics. Section 3.1 will deal with the RF transceivers in more detail.
Last but not least, a reproducible testbed is crucial for the analysis of interfer-ence issues. Interferinterfer-ence control is a key optimization issue for large-scale wireless networks, be it inter-standard interference or intra-standard interference. If all individual link budgets between all nodes are sufficiently stable, then we can also assess that interference level can be managed, tuned and reproduced. This is clearly impossible in a real world experimentation, striving to build a bridge between theory, simulation and experimentation.
3
Path-Loss Characterization in FIT/CorteXlab
To provide reliable path-loss measurements for the FIT/CorteXlab experimen-tation room, we must first properly characterize the overall transmitter (TX) and receiver (RX) chains used for the measurements. We must be able to clearly estimate the absolute transmission and reception powers, in decibel-milliwatt (dBm), taking into account the antenna gains and RF characteristics of the ra-dio nodes. As we will see in the following, all characterization and path-loss
measurements were done for the USRPs only. The PicoSDRs, with its 3-stage RF amplifier and filtering, require a more complex approach and will be the focus of a future work.
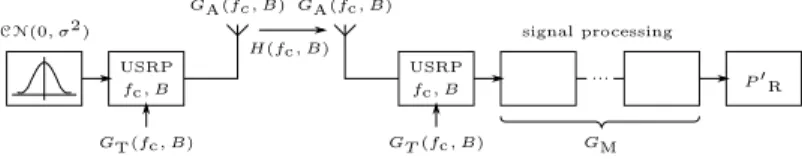
A simple TX and RX chain was devised to aid in characterizing the radio nodes under transmission and reception and can be seen in Fig. 2. The power at the TX side PT in dBm, whose signal is at central frequency fc and bandwidth
B, can be modeled as:
PT= GA(fc, B) + GT(fc, B) + Ps, (1)
where GA is the antenna gain in dB, GT is the USRP TX gain in dB, Ps is
the power of the Gaussian circularly symmetric transmitted signal s ∼CN(0, σ). Then, Ps= 10 log(σ2), with log the logarithm function on base 10. A Gaussian
source signal was selected for its flat power spectrum density and will give a flat response whatever band used in the measurements. For the receiver part, the following model was adopted
P0R= GA(fc, B) + GR(fc, B) + GM(fc, B) + H(fc, B) + PT, (2)
where P0R is the measured received power in dBm, GR is the USRP RX gain
in dB, GM is the gain of the signal processing part of the measurement chain
(filtering, FFT, etc.) in dB, and H is channel gain in dB. Since the same antennas are used at both sides of the link, GAis the same for the TX and the RX.
3.1 TX-RX Gain-Power Characterization
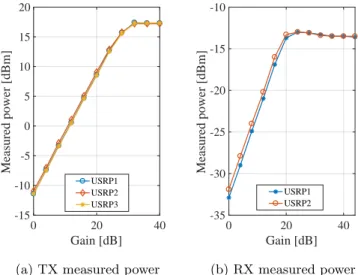
Measurements were performed initially for the TX followed by the RX side. A summary of the relevant parameters for both set of measurements are shown in table 1. All USRPs were pre-calibrated using the universal hardware driver (UHD) calibration tool. The TX and RX chains were developed in GNU Radio following the description in Fig. 2. The same attenuator and RF cable were used throughout the study, to guarantee a constant connector and cable loss reference. For the TX measurements, a spectrum analyzer was connected through the attenuator to the RF output port of the USRP. This can be seen as taking GA = 0 dBi in (1). The TX gain was configured in the “UHD sink” GNU
Radio block. Finally, three individual USRPs were tested to check for significant differences in the measurements. In Fig. 3a, we see the measured TX powers with
CN(0, σ2) GT(fc, B) GA(fc, B) fc, B GT (fc, B) GA(fc, B) ... GM P 0 R signal processing USRP fc, B USRP H(fc, B)
Parameter Range of values source type 0-mean Gaussian noise amplitude (of I and Q) 1
B (sample rate) 1 MHz fccentral frequency 2.45 GHz
channel bandwidth (filter) 10 MHz attenuator 30 dB
RF cable RADIALL R286300752 (1 m) TX and RX gain values GRand GT 0 to 44 dB
signal processing gain GMat the RX -12 dB
Table 1: Configured parameters for the TX and RX characterization.
respect to the gain GT(fc, B), set at the TX. The measured powers already take
into account the attenuation in the measurements (-30 dB for the attenuator). The expected behavior can be seen, with the power linearly increasing with the gain, until it reaches the non-linear region where the amplifier saturates. Interestingly, all measured USRPs never reach the maximum power given in the specifications, of 20 dBm, for this specific model. Nevertheless, all three USRPs deliver the same behavior with very little variation. We can also notice that for the different USRPs used in this study, a measured power difference of at most 1 dB can be observed. This suggests that for precise power measurements, a more refined study is necessary to better characterize these measured power levels. This study is however, out of the scope of this work.
For the RX, a Gaussian signal with the fixed characteristics and a known power of 9.1 dBm was provided at the input port of the USRP through the attenuator. As for the TX case, this can be seen as taking GA = 0 dBi in (2).
The RX gains were configured in the “UHD source” GNU Radio block. Unlike in the TX study, only two USRPs were evaluated. We can see in Fig. 3b, that the
0 20 40 Gain [dB] -15 -10 -5 0 5 10 15 20 Measured power [dBm] USRP1 USRP2 USRP3
(a) TX measured power
0 20 40 Gain [dB] -35 -30 -25 -20 -15 -10 Measured power [dBm] USRP1 USRP2 (b) RX measured power
Fig. 3: TX and RX characterization for the USRP NI 2932 at fc = 2.45 GHz
USRPs also behave as expected in RX mode. Here, the measured powers also take into account the attenuation in the measurements (-30 dB for the attenuator). The same pattern of amplification, with a linear increase and a non-linear part can be observed. As for the TX case, we can also notice a difference in the received powers, of approx. 1 dBm, between both tested USRPs for a given gain value.
3.2 Path-loss Measurement Campaign
Having characterized the TX and RX powers with respect to the TX and RX gains, we can now proceed to measuring the path-loss H(fc, B). As stated before,
the path-loss measurements were made only for the USRPs. They were performed pairwise, considering every TX - RX combination possible in the FIT/CorteXlab experimentation room. To that aim, 22 experimentation tasks were created in which each one of the 22 USRP nodes behave as a TX while the remaining USRP nodes behaving as RXs. The TXs send the signal described in section 3.1 with a constant power, given for a transmit gain of GT= 20 dB. Each RX measures P0R
and calculates H(fc, B) from (2), by replacing all known gain values. For these
experiments air was used as the transmission medium, and therefore the cable and the attenuator were not used. The antenna gain considered is GA(fc, B) =
−4.3 dBi, given by the antenna manufacturer. Finally, the physical positions of each node is given in Fig. 1. The actual antenna positions are marked by a “+” in Fig. 1, along with the node number. The horizontal and vertical steps between adjacent nodes are regular and equal to 1.8 m.
4
Experimental Results
With the exception of the attenuator, cable and TX and RX gain values, all experimentation parameters are the same as in table 1. In Figs. 4, and 5 we see three examples of selected TX - RX settings, namely with node 3, 16 and 38 as TXs, respectively. Each bar corresponds to the measured path-loss for each one of the receiving USRPs. The PicoSDR’s path-losses are set to zero in these figures, to highlight the fact that they were not measured. The behavior of the observed path-losses are as expected and increase with the distance of the transmitter nodes, going from around 67 to 73 dB, when next to the transmitter, to 85 to 104 dB, when farthest away from the transmitter, depending on the position of the node. It should be noted that the presence of structural columns (seen in Fig. 1 as grey squares surrounded by a red line) affect the path-loss, as expected. Take for example, the path-loss between TX 3 and RX 34 in Fig. 4 with respect to several other neighboring nodes, as seen in table 2. We clearly see that the path-loss between TX 3 and RX 34 is of the same order as the path-loss between TX 3 and RX 38, which is in stark contrast with the path-loss between TX 3 and RXs 32 and 33, the immediate neighbors of 34. A similar behavior can be observed over all experiments and can also be seen in Fig. 5a and 5b.
Path-loss [dB] 40 39 36 20 38 30 19 31 10 12 37 34 10 35 32 29 26 18 15 9 33 0 16 8 28 14 17 22 11 7 50 1 Nodes position 27 6 24 13 100 21 25 5 2 8 23 5 4 2 9 6 TX 3 3 3 3 7 4 1 2 4 1 0 10 20 30 40 50 60 70 80 90 100
Fig. 4: Example of path-loss measured between node 3 and all other USRP nodes.
40 39 36 38 20 30 19 18 TX 16 31 10 12 37 34 16 35 10 32 29 33 26 15 9 0 8 17 20 28 14 22 40 11 7 1 60 Path-loss [dB] Nodes position 6 80 13 27 21 24 5 2 25 5 4 8 2 23 9 3 6 3 7 1 2 4 4 1 3 0 10 20 30 40 50 60 70 80 90 (a) TX 16 40 TX 38 38 39 36 20 37 30 31 19 10 12 34 35 10 32 29 33 18 26 15 9 16 0 8 28 14 22 17 11 7 50 1 Path-loss [dB] Nodes position 27 6 13 24 100 21 5 2 25 5 4 23 8 2 9 3 6 3 7 1 2 4 4 1 3 0 10 20 30 40 50 60 70 80 90 100 (b) TX 38
Fig. 5: Example of path-loss measured between node 16 and all other USRP nodes (left) and between node 38 and all other USRP nodes (right).
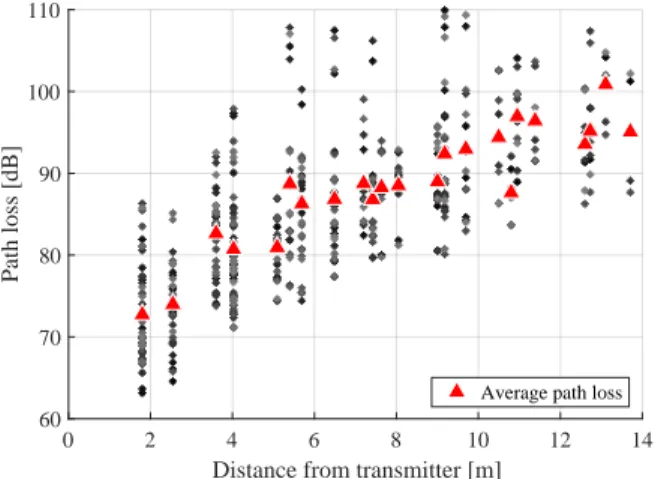
To sum up all path-loss findings, Fig. 6 shows the path-loss distribution over same-distance pairs of nodes. This figure was compiled over all experimentation runs and all TX configurations, for a total of 176 measurement runs (3696 indi-vidual measurements). The horizontal axis compiles the distance from the TX in each run to a RX. The discrete distances in this figure account for the grid structure of the FIT/CorteXlab experimentation room. On the vertical axis all path-loss measurements for nodes of a certain distance are given, as well their the average value, marked with a triangle. As we can see, the relatively high spread in path-losses for same-distance pairs of nodes, take into consideration different propagation characteristics, such as multipath fading (reflexions) and shadowing due to the structural columns. Even though these characteristics highly affect the average, we can still observe a rather linear tendency over distance as ex-pected. Moreover, the slope of this tendency shows that the path-loss exponent experienced in that room is greater than 2, thus showing that the propagation
RX node number Distance Path-loss 34 10.5 m 102 dB 32 9.0 m 89 dB 33 9.7 m 89 dB 38 13.7 m 104 dB
Table 2: Path-losses of several nodes with respect to TX node 3
0 2 4 6 8 10 12 14
Distance from transmitter [m]
60 70 80 90 100 110 Path loss [dB]
Average path loss
Fig. 6: Compilation of all path-losses measured between same-distance pairs of nodes
conditions are harder than free-space. The high variability of these measured path-losses indicate that a FIT/CorteXlab user might want to take this infor-mation into consideration before planning his or her experiment scenario.
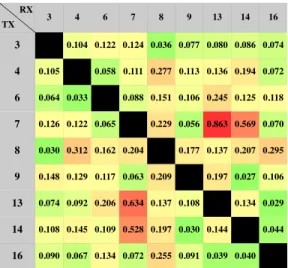
Finally, we fixed the TX configuration and looked over the 8 runs of the same configuration. Each measurement run took place at least 1 hour apart from the previous run. This time, instead of looking at the actual values of the path-losses in dB, we looked at their variability between same node pairs over each run. The idea is to see the impact of consecutive runs over the actual value of the path-loss. Fig. 7 presents the standard deviation of the measured path-loss around the average value, for any pair of TX-RX nodes. The diagonal values are missing from the figure since we have restricted a node from simultaneously being a TX and an RX. A color code was added to enhance the readability of the figure, with colors toward the red meaning a higher standard deviation, while colors leaning toward the green mean a lower one. Due to size restrictions only the first 9 USRP nodes are present in the figure, however, the observations and conclusions are extensible to all nodes. We can see that all standard deviations are confined to within several tenths or hundredths of a dB (aways less than 1 dB), which indicate the tightness of the loss measurements. This means that the path-losses remain rather stable throughout experiments spanning several hours apart. Interestingly, when looking at a specific pair of nodes, we observe a symmetric pattern in the standard deviation of the path-loss. This happens in spite of different TX and RX chain characteristics for a given radio node, which also
RX 3 4 6 7 8 9 13 14 16 TX 3 0.104 0.122 0.124 0.036 0.077 0.080 0.086 0.074 4 0.105 0.058 0.111 0.277 0.113 0.136 0.194 0.072 6 0.064 0.033 0.088 0.151 0.106 0.245 0.125 0.118 7 0.126 0.122 0.065 0.229 0.056 0.863 0.569 0.070 8 0.030 0.312 0.162 0.204 0.177 0.137 0.207 0.295 9 0.148 0.129 0.117 0.063 0.209 0.197 0.027 0.106 13 0.074 0.092 0.206 0.634 0.137 0.108 0.134 0.029 14 0.108 0.145 0.109 0.528 0.197 0.030 0.144 0.044 16 0.090 0.067 0.134 0.072 0.255 0.091 0.039 0.040
Fig. 7: Standard deviation of the measured path-loss for over all experiment runs, for a selected pair of TX-RX.
explains why the values are not exactly the same. If we account only for the channel and the TX and RX antennas (each node share the same antenna for TX and RX), we see that the channel is rather reversible. These two results clearly corroborate our claim that the FIT/CorteXlab experimentation room is indeed a reproducible experimentation environment and are in accordance to what previously stated in section 2.
5
Conclusions and Perspectives
In this work we have provided experimental measurements that clarify the path-loss distribution in the FIT/CorteXlab experimentation room. These results will serve as a reference for users wanting to better understand their experimental results with respect to the radio environment, as well as for users willing to properly decide on a scenario configuration for their experiments. Furthermore, we have provided additional findings that complement the ones published be-fore [MCB+15], that points toward a reproducible environment inside of the FIT/CorteXlab experimentation room. The ensemble of these findings will help FIT/CorteXlab users to move onto experimentation on advanced radio tech-niques for future wireless communications. Finally, we have provided all raw measurements and related code as an open-source downloadable package, that can be explored by users aiming to better understand the propagation envi-ronment in the FIT/CorteXlab experimentation room, producing insights more relevant to them.
The forthcoming goal will be twofold. Firstly, we need to implement this path-loss evaluation as a routine of the FIT/CorteXlab testbed, in order to regularly update the coverage map of each node, taking into consideration the
maintenance related replacement of equipment. This routine will also serve as benchmarking purposes, allowing FIT/CorteXlab administrators and users to quickly identify radio nodes with faulty or underperforming RF stages. Secondly, the findings herein are a part of an ongoing study, that will eventually include a time-frequency characterization to complete our knowledge about the various radio channels that can be encountered in this testbed as well as the PicoSDR nodes. As stated before, in [MCB+15] we have already performed some channel
sounding based on OFDM waveforms. This preliminary work has demonstrated that, even if in most cases are LOS (line of sight) conditions with a flat chan-nel on the whole usable bandwidth, in some particular combinations we have NLOS (non line of sight) with more diversity (and lower coherence bandwidth). Reversely, finding ways of increasing the diversity of links in our testbed while preserving the reproducibility of experimentation is also an interesting perspec-tive.
References
[AFGP16] George C Alexandropoulos, Paul Ferrand, Jean-Marie Gorce, and Con-stantinos B Papadias. Advanced coordinated beamforming for the downlink of future lte cellular networks. IEEE Communications Magazine, 54(7):54– 60, 2016.
[Blo04] Eric Blossom. Gnu radio: Tools for exploring the radio frequency spectrum. Linux J., 2004(122), June 2004.
[DDF+10] Luiz A. DaSilva, Linda Doyle, Danny Finn, Justin Tallon, Ingrid Moerman,
and Stefan Bouckaert. Crew: Building a cognitive radio federation. In IC0902, Bologna, Italy, 11/2010 2010.
[FTB+17] Yasser Fadlallah, Antonia M Tulino, Dario Barone, Giuseppe Vettigli, Jaime Llorca, and Jean-Marie Gorce. Coding for caching in 5g networks. IEEE Communications Magazine, 55(2):106–113, 2017.
[FTD+11] Danny Finn, Justin Tallon, Luiz A. DaSilva, Peter Van Wesemael, Sofie
Pollin, Wei Liu, Stefan Bouckaert, Jono Vanhie-Van Gerwen, Nicola Michailow, Jan-Hinrich Hauer, Daniel Willkomm, and Christoph Heller. Experimental assessment of tradeoffs among spectrum sensing platforms. In Wintech 2011, Las Vegas, Nevada, 09/2011 2011.
[MCB+15] Achille Mouaffo, Leonardo Cardoso, Herv´e Boeglen, Guillaume Villemaud, and Rodolphe Vauzelle. Radio link characterization of the CorteXlab testbed with a large number of software defined radio nodes. In Anten-nas and Propagation (EuCAP), 2015 9th European Conference on , Lisbon, Portugal, April 2015.
[NMM+14] Navid Nikaein, Mahesh K. Marina, Saravana Manickam, Alex Dawson,
Raymond Knopp, and Christian Bonnet. Openairinterface: A flexible plat-form for 5g research. SIGCOMM Comput. Commun. Rev., 44(5):33–38, October 2014.
[OH17] Timothy J O’Shea and Jakob Hoydis. An introduction to machine learning communications systems. arXiv preprint arXiv:1702.00832, 2017.
[RSO16] Dipankar Raychaudhuri, Ivan Seskar, and Max Ott. ORBIT: Wireless Experimentation, pages 63–95. Springer International Publishing, Cham, 2016.