Supporting Information
Rapid and convenient oxidative release of thiol-conjugated forms of
microcystins for chemical analysis
Christopher O. Miles1,2,*
1
Norwegian Veterinary Institute, P. O. Box 750 Sentrum, N-0106 Oslo, Norway 2
National Research Council, 1411 Oxford Street, Halifax, NS, B3H 3Z1, Canada
*Author to whom correspondence should be addressed: Phone +1 (902) 426-7263
Fax +1 (902) 426 9413 Email chris.miles@nrc.ca
Figure S1 LC-MS showing oxidation of 10a to 10a(O2) and basic elimination S2
Figure S2 LC–MS of oxidation of 9 with Oxone showing degradation products S3 Figure S3 LC–MS of deconjugation of 10a contaminated with 10a(O) S4 Figure S4 Kinetic analysis of deconjugation of 10a and 10a(O) to 10 at pH 9.2 S5 Figure S5 LC–MS of deconjugation of 8b(O), 8b(O2) and 11b(O) S6
Figure S6 LC–MS of deconjugation of 1a(O)–7a(O) + 9a(O) from H2O2 oxidation S7 Figure S7 LC–MS of deconjugation of products from oxidation of MC-LW S8 Figure S8 LC–MS of deconjugation of 8b(O) + 9c(O) from experiment E S9
Figure S9 LC–MS2 spectrum of 8 S10
Figure S10 LC–MS2 spectrum of 8b S11
Figure S11 LC–MS2 spectrum of 8b(O) from Oxone treatment S12 Figure S12 LC–MS2 spectrum of 8b(O2) ex Oxone treatment S13
Figure S13 LC–MS2 spectrum of 8b(O) from H2O2 treatment S14 Figure S14 LC–MS3 spectrum of 8b(O)→m/z 1031 from H2O2 treatment S15 Figure S15 LC–MS3 spectrum of 8b(O)→m/z 1031 ex Oxone & LC–MS2 of 8 S16 Figure S16 LC–MS3 spectrum of 8b(O2)→m/z 1031 & LC–MS2 spectrum of 8 S17
Figure S17 LC–MS2 spectra of 9c S18
Figure S18 LC–MS2 spectrum of 9c(O) & LC–MS3 spectrum of 9c(O)→m/z 981 S19 Figure S19 LC–MS3 spectrum of 9c(O)→m/z 981 & LC–MS2 spectrum of 9 S20
Figure S20 LC–MS2 spectra of 9c(O) S21
Figure S21 LC–MS3 spectrum of 9c(O2)→m/z 981 & LC–MS2 spectrum of 9 S22
Figure S22 LC–MS2 spectra of 9d S23
Figure S23 LC–MS2 spectra of 9d(O) S24
Figure S24 LC–MS3 spectrum of 9d(O)→m/z 981 & LC–MS2 spectrum of 9 S25
Figure S25 LC–MS2 spectra of 9d(O2) S26
Figure S26 LC–MS3 spectrum of 9d(O2)→m/z 981 & LC–MS2 spectrum of 9 S27
S2
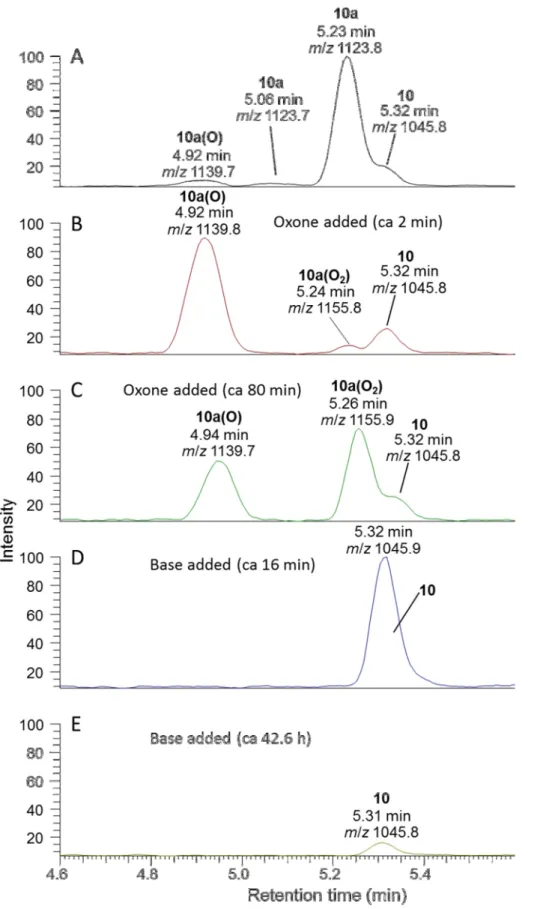
Figure S1. LC–MS analysis of step-wise oxidation with Oxone, followed by addition of carbonate buffer. (experiment A, #2). The rate of oxidation of sulfide 10a to sulfoxide 10a(O) was too fast to measure with LC–MS2 (t½ < 5 min). However oxidation of sulfoxide 10a(O) to sulfone 10a(O2) followed first-order kinetics with t½ 68 min. Chromatograms are at the same vertical scale, corrected for dilution by addition of reagents, extracted at m/z for [M+H]+ of 10, 10a, 10a(O) and 10(O2).
Figure S2. LC–MS analysis of treatment of [Dha7]MC-LR (9) in MeOH–H2O with Oxone, showing the reduction in intensity of 9 and production of oxidized microcystin degradation products (experiment A, #3). Chromatograms are at the same absolute vertical scale, but with an expansion (showing 0–30%) for oxidized samples.
S4
Figure S3. LC–MS2 analysis of the first 4 h of deconjugation of 10a contaminated with ca 15% of its sulfoxide (10a(O)) (experiment B). Chromatograms are at the same vertical scale, extracted at m/z for [M+H]+ of 10, 10a, and 10a(O).
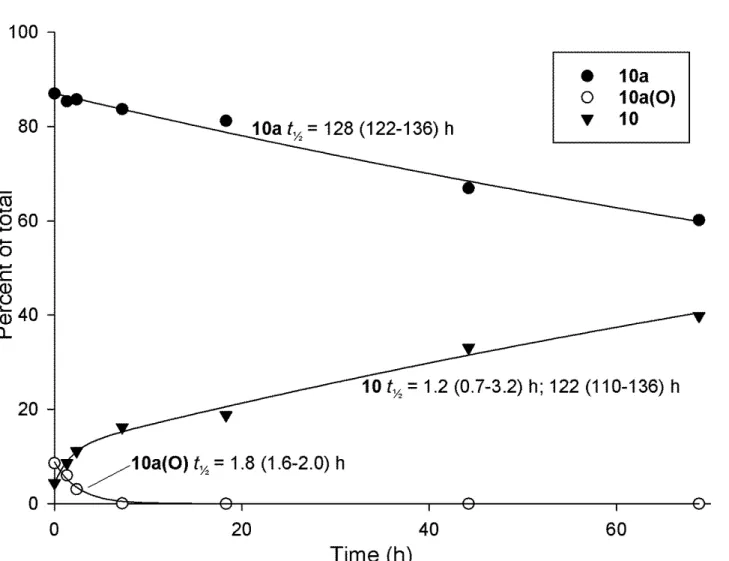
Figure S4. Reanalysis of LC–MS2 data for the deconjugation of 10a and production of 10 at pH 9.2 with Me2SO,1 but including the presence of sulfoxide-10a(O). Concentrations of 10a and 10a(O) are fitted to 2-parameter exponential decay curves, and the concentration of 10 is fitted to a 5-parameter exponential increase to a maximum (resulting in two rate constants). Values in parentheses show t½ ± SE.
S6
Figure S5. LC–MS analysis of the base-catalyzed deconjugation of methanethiol-conjugate 8b via its sulfoxide (8b(O)) and sulfone (8b(O2)) (left panels) after treatment with H2O2 followed by SPE (experiment C). Note the presence of a small amount of 11b(O) in the reaction mixture (panels on right), which was deconjugated in a similar manner to 8b(O) but at a slower rate. Only trace levels of 11b(O2) were present.
Chromatograms are extracted at m/z for [M+H]+ of the marked compounds, and are presented at the same absolute vertical scale corrected for dilution by addition of reagents, but with an expansion (showing 0–2%) for the region showing 11b(O) and 11b.
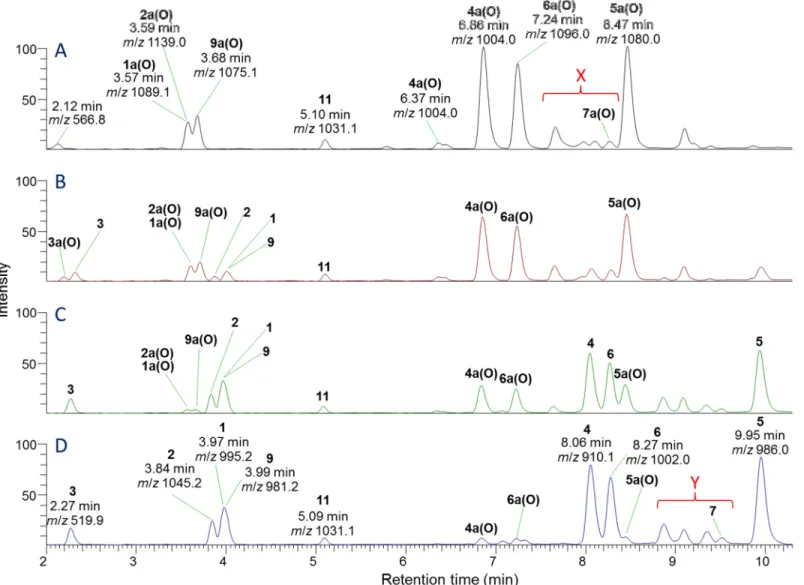
Figure S6. LC–MS2 analysis of the base-catalyzed deconjugation of sulfoxides 1a(O)–7a(O) and 9a(O), produced by H2O2 oxidation of the mercaptoethanol adducts of a mixture of MC followed by SPE separation (experiment C). The regions marked X and Y contain peaks arising from oxidation of the mercaptoethanol adduct of MC-LW (7a), and expansions are shown in Figure S7.
S8
Figure S7. Expansion from LC-MS2 analysis (Figure S6) showing the deconjugation of the sulfoxides of the mercaptoethanol adduct of MC-LW and its oxidation products at various times after addition of carbonate buffer (experiment C). Chromatograms on the left are extracted for m/z for [M+H]+ of 7a(O) and its Oia-, Nfk- and Kyn-derivatives, while those on the right are extracted for m/z for [M+H]+ of 7a and its Oia-, Nfk- and Kyn-derivatives. All chromatograms are shown with the same absolute vertical scale.
Figure S8. LC-MS2 chromatograms of the deconjugation of the sulfoxides of Cys-conjugate 9c and MeSH-conjugate 8b (experiment E). All chromatograms are extracted for m/z for ([M+H]+ + [M+2H]2+) of 8, 8b, 8b(O), 9, 9c, and 9c(O) and are shown at the same absolute vertical scale. Peaks are labelled with retention time and m/z for [M+H]+.
E
9c(O) + 8b(O), 2.87 h after addition of pH 10.7 buffer9c(O)
8b(O)
9
8
3.0 3.5 4.0 4.5 5.0 5.5 Retention time (min)
20 40 60 80 100 R e la ti v e A b u n d a n c e 20 40 60 80 100 R e la ti v e A b u n d a n c e 20 40 60 80 100 R e la ti v e A b u n d a n c e 20 40 60 80 100 R e la ti v e A b u n d a n c e 20 40 60 80 100 R e la ti v e A b u n d a n c e 3.40 min m/z 1118.1 4.85 min m/z 1095.1 5.09 min m/z 1031.1 4.00 min m/z 981.1 4.69 1118.3 3.44 min m/z 1118.0 4.86 min m/z 1095.1 5.11 min m/z 1031.1 4.02 min m/z 981.1 5.11 min m/z 1031.1 4.01 min m/z 981.1 3.42 min m/z 1118.1 4.85 min m/z 1095.1 5.09 min m/z 1031.1 4.00 min m/z 981.1 3.39 min m/z 1118.1 4.83 min m/z 1095.1 4.01 min m/z 981.1 5.10 min m/z 1031.1 4.69 min m/z 1031.1
8
9
9c(O)
9
8
8b(O)
9c(O)
9
8
8b(O)
9c(O)
9
8
8b(O)
iso-8
A
9c + 8b + DMSO + Oxone (after 1.12 h)B
9c(O) + 8b(O), 2 min after addition of pH 10.7 bufferC
9c(O) + 8b(O), 16 min after addition of pH 10.7 bufferS10
S12
Figure S11. LC–MS2 spectrum of [M+H]+ of the sulfoxide of the methanethiol adduct of [Asp3]MC-RY (8b(O)) at m/z 1095.2, produced by oxidation of 8b with Oxone.
Figure S12. LC–MS2 spectrum of [M+H]+ of the sulfone of the methanethiol adduct of [Asp3]MC-RY (8b(O2)) at m/z 1111.2, produced by
S14
Figure S13. LC–MS2 spectrum of [M+H]+ of the sulfoxide of the methanethiol adduct of [Asp3]MC-RY (8b(O)) at m/z 1095.2, produced by oxidation of 8b with H2O2.
Figure S14. LC–MS3 spectrum of [M+H]+ of the sulfoxide of the methanethiol adduct of [Asp3]MC-RY (8b(O)) at m/z 1095.2→1031.2, produced by oxidation of 8b with H2O2.
S16
Figure S15. Top, LC–MS3 spectrum of [M+H]+ of the sulfoxide of the methanethiol adduct of [Asp3]MC-RY (8b(O)) at m/z 1095.2→1031.2, produced by oxidation of 8b with H2O2; bottom, LC–MS2 spectrum of [M+H]+ of [Asp3]MC-RY (8) at m/z 1031.2.
Figure S16. Top, LC–MS3 spectrum of [M+H]+ of the sulfone of the methanethiol adduct of [Asp3]MC-RY (8b(O2)) at m/z 1111.2→1031.2, produced by oxidation of 8b with Oxone; bottom, LC–MS2 spectrum of [M+H]+ of [Asp3]MC-RY (8) at m/z 1031.2.
S18
Figure S17. Top, LC–MS2 spectrum of [M+H]+ of the Cys adduct of [Dha7]MC-LR (9c) at m/z 1102.1; bottom, LC–MS2 spectrum of [M+2H]2+ of the Cys adduct of [Dha7]MC-LR (9c) at m/z 551.8.
Figure S18. Top, LC–MS2 spectrum of [M+H]+ of the sulfoxide of the Cys adduct of [Dha7]MC-LR (9c(O)) at m/z 1118.0; bottom, LC–MS3 spectrum of [M+H]+ of the sulfoxide of the Cys adduct of [Dha7]MC-LR (9c(O)) at m/z 1118.0→981.1 (note, low signal-to-noise).
S20
Figure S19. Top, LC–MS3 spectrum of [M+H]+ of the sulfoxide of the Cys adduct of [Dha7]MC-LR (9c(O)) at m/z 1118.0→981.1 (note, low signal-to-noise); bottom, LC–MS2 spectrum of [M+H]+ of [Dha7]MC-LR (9) at m/z 981.1.
Figure S20. Top, LC–MS2 spectrum of [M+H]+ of the sulfone of the Cys adduct of [Dha7]MC-LR (9c(O2)) at m/z 1134.1; bottom, LC–MS2
S22
Figure S21. Top, LC–MS3 spectrum of [M+H]+ of the sulfone of the Cys adduct of [Dha7]MC-LR (9c(O2)) at m/z 1134.1→981.1; bottom, LC– MS2 spectrum of [M+H]+ of [Dha7]MC-LR (9) at m/z 981.1.
Figure S22. Top, LC–MS2 spectrum of [M+H]+ of the GSH adduct of [Dha7]MC-LR (9d) at m/z 1288.1; bottom, LC–MS2 spectrum of [M+2H]2+ of the GSH adduct of [Dha7]MC-LR (9d) at m/z 644.8.
S24
Figure S23. Top, LC–MS2 spectrum of [M+H]+ of the sulfoxide of the GSH adduct of [Dha7]MC-LR (9d(O)) at m/z 1304.0; bottom, LC–MS2 spectrum of [M+2H]2+ of the sulfoxide of the GSH adduct of [Dha7]MC-LR (9d(O)) at m/z 652.8.
Figure S24. Top, LC–MS3 spectrum of [M+H]+ of the sulfoxide of the GSH adduct of [Dha7]MC-LR (9c(O)) at m/z 1304.0→981.1; bottom, LC–MS2 spectrum of [M+H]+ of [Dha7]MC-LR (9) at m/z 981.1.
S26
Figure S25. Top, LC–MS2 spectrum of [M+H]+ of the sulfone of the GSH adduct of [Dha7]MC-LR (9d(O2)) at m/z 1320.1; bottom, LC–MS2
Figure S26. Top, LC–MS3 spectrum of [M+H]+ of the sulfone of the GSH adduct of [Dha7]MC-LR (9c(O2)) at m/z 1320.1→981.5 (note, low signal-to-noise); bottom, LC–MS2 spectrum of [M+H]+ of [Dha7]MC-LR (9) at m/z 981.1.
S28
References
(1) Miles, C. O., Sandvik, M., Nonga, H. E., Ballot, A., Wilkins, A. L., Rise, F., Jaabæk, J. A. H., and Loader, J. I. (2016) Conjugation of microcystins with thiols is reversible: base-catalyzed deconjugation for chemical analysis. Chem. Res. Toxicol. 29, 860− 870.

![Figure S2. LC–MS analysis of treatment of [Dha 7 ]MC-LR (9) in MeOH–H 2 O with Oxone, showing the reduction in intensity of 9 and production of oxidized microcystin degradation products (experiment A, #3)](https://thumb-eu.123doks.com/thumbv2/123doknet/14064198.461750/3.892.117.787.118.1069/analysis-treatment-reduction-intensity-production-microcystin-degradation-experiment.webp)


![Figure S9. LC–MS 2 spectrum of [M+H] + of [Asp 3 ]MC-RY (8) at m / z 1031.2.](https://thumb-eu.123doks.com/thumbv2/123doknet/14064198.461750/10.1263.197.1060.102.690/figure-s-lc-ms-spectrum-asp-mc-ry.webp)
![Figure S10. LC–MS 2 spectrum of [M+H] + of the methanethiol adduct of [Asp 3 ]MC-RY (8b) at m/z 1079.2](https://thumb-eu.123doks.com/thumbv2/123doknet/14064198.461750/11.1263.202.1059.108.678/figure-lc-ms-spectrum-methanethiol-adduct-asp-mc.webp)