HAL Id: tel-00789816
https://tel.archives-ouvertes.fr/tel-00789816
Submitted on 18 Feb 2013
HAL is a multi-disciplinary open access
archive for the deposit and dissemination of sci-entific research documents, whether they are pub-lished or not. The documents may come from teaching and research institutions in France or abroad, or from public or private research centers.
L’archive ouverte pluridisciplinaire HAL, est destinée au dépôt et à la diffusion de documents scientifiques de niveau recherche, publiés ou non, émanant des établissements d’enseignement et de recherche français ou étrangers, des laboratoires publics ou privés.
Organisation of audio-visual three-dimensional space
Marina Zannoli
To cite this version:
Marina Zannoli. Organisation of audio-visual three-dimensional space. Psychology. Université René Descartes - Paris V, 2012. English. �NNT : 2012PA05H109�. �tel-00789816�
ORGANISATION OF AUDIO-VISUAL
THREE-DIMENSIONAL SPACE
PhD Thesis, Université Paris Descartes
ORGANISATION DE L’ESPACE
AUDIOVISUEL TRIDIMENSIONEL
Thèse de Doctorat, Université Paris Descartes
Marina Zannoli
Directeur: Pascal Mamassian
Membres du Jury:
Rapporteurs: Pr Julie Harris (University of St Andrews), Dr Eli Brenner (Vrije Universiteit) Examinateurs: Dr Wendy Adams (University of Southampton), Pr Patrick Cavanagh (Université Paris Descartes), Dr Jean-Baptiste Durand (CNRS)
Date de soutenance: 28 septembre 2012
Laboratoire Psychologie de la Perception
ED 261: Cognition, Comportement, Conduites Humaines Université Paris Descartes, Sorbonne Paris Cité et CNRS UMR 8158! ""!
Abstract
Stereopsis refers the perception of depth that arises when a scene is viewed binocularly. The visual system relies on the horizontal disparities between the images from the left and right eyes to compute a map of the different depth values present in the scene. It is usually thought that the stereoscopic system is encapsulated and highly constrained by the wiring of neurons from the primary visual areas (V1/V2) to higher integrative areas in the ventral and dorsal streams (V3, inferior temporal cortex, MT). Throughout four distinct experimental projects, we investigated how the visual system makes use of binocular disparity to compute the depth of objects. In summary, we show that the processing of binocular disparity can be substantially influenced by other types of information such as binocular occlusion or sound. In more details, our experimental results suggest that:
(1) da Vinci stereopsis is solved by a mechanism that integrates classic stereoscopic processes (double fusion), geometrical constraints (monocular objects are necessarily hidden to one eye, therefore they are located behind the plane of the occluder) and prior information (a preference for small disparities).
(2) The processing of motion-in-depth can be influenced by auditory information: a sound that is temporally correlated with a stereomotion-defined target can substantially improve visual search.
Stereomotion detectors are optimally suited to track 3D motion but poorly suited to process 2D motion.
(3) Grouping binocular disparity with an orthogonal auditory signal (pitch) can increase stereoacuity by approximately 30%.
Key words: stereopsis, da Vinci stereopsis, stereomotion, visual search, audio-visual integration, stereoacuity.
! """!
Résumé
Le terme stéréopsie renvoie à la sensation de profondeur qui est perçue lorsqu’une scène est vue de manière binoculaire. Le système visuel s’appuie sur les disparités horizontales entre les images projetées sur les yeux gauche et droit pour calculer une carte des différentes profondeurs présentes dans la scène visuelle. Il est communément admis que le système stéréoscopique est encapsulé et fortement contraint par les connexions neuronales qui s’étendent des aires visuelles primaires (V1/V2) aux aires intégratives des voies dorsales et ventrales (V3, cortex temporal inférieur, MT). A travers quatre projets expérimentaux, nous avons étudié comment le système visuel utilise la disparité binoculaire pour calculer la profondeur des objets. Nous avons montré que le traitement de la disparité binoculaire peut être fortement influencé par d’autres sources d’information telles que l’occlusion binoculaire ou le son. Plus précisément, nos résultats expérimentaux suggèrent que :
(1) La stéréo de da Vinci est résolue par un mécanisme qui intègre des processus de stéréo classiques (double fusion), des contraintes géométriques (les objets monoculaires sont nécessairement cachés à un œil, par conséquent ils sont situés derrière le plan de l’objet caché) et des connaissances à priori (une préférence pour les faibles disparités).
(2) Le traitement du mouvement en profondeur peut être influencé par une information auditive : un son temporellement corrélé avec une cible définie par le mouvement stéréo peut améliorer significativement la recherche visuelle.
Les détecteurs de mouvement stéréo sont optimalement adaptés pour détecter le mouvement 3D mais peu adaptés pour traiter le mouvement 2D.
(3) Grouper la disparité binoculaire avec un signal auditif dans une dimension orthogonale (hauteur tonale) peut améliorer l’acuité stéréo d’approximativement 30%.
Mots-clés: stéréopsie, stéréo de da Vinci, mouvement stéréo, recherche visuelle, intégration multisensorielle, acuité stéréo.
! "#!
Acknowledgements
!
First, I would like to deeply thank the members of my PhD committee for giving me the honour to evaluate my work.
Second, I am extremely grateful to Pascal Mamassian for giving me the opportunity to work under his supervision during the past five years. He was able to make time for me in his incredibly busy schedule (including emails at one in the morning or during the weekends). I thank him for sharing his bright ideas with me. He suffered my twisted humour during five years with bravery and patience.
Along with Pascal are the members of the LPP lab in Paris. I am thankful to Adrien Chopin, Simon Barthelmé, Thomas Otto, Mark Wexler, Trevor Agus, Victor, Francis and Agnès Léger for their constructive comments on my work.
A very special thank you goes to Marie de Montalembert and Agnès Léger. You have been the most supporting friends in the world.
Then, come the Australians. I think that my visit in David Alais’s lab would have been far less rewarding if I haven’t met Emily Orchard-Mills, Susan Wardle and Johahn Leung. You have been so welcoming and have run so many of my experiments. Johahn: a special thank you for proofreading! Of course, I am deeply thankful to David Alais and John Cass for their time, intelligence and enthusiasm in our collaborations.
I am also very thankful to Katharina Zeiner, Inna Tsirlin and especially Laurie Wilcox for hours spent discussing why monocular occlusions are so fascinating.
I thank my family for their constant support during the past three years.
Finally, I would like to thank Pierre for his help, support, patience and love during this PhD. You’re the best!
! #!
Articles
¥ Zannoli, M., & Mamassian, P. (in preparation). The effect of audio-visual grouping on stereoacuity.
¥ Zannoli, M., Cass, J., Alais, D. & Mamassian, P. (submitted to Journal of
Vision). Stereomotion detectors are poorly suited to track 2D motion.
¥ Zannoli, M., Cass, J., Mamassian, P. & Alais, D. (2012) Synchronized Audio-Visual Transients Drive Efficient Visual Search for Motion-in-Depth. PLoS
ONE, 7 (5): e37190.
¥ Zannoli, M., & Mamassian, P. (2011). The role of transparency in da Vinci stereopsis. Vision Research, 51, 2186–2197.
! #"!
Table of contents
! $%&'()*'!+++++++++++++++++++++++++++++++++++++++++++++++++++++++++++++++++++++++++++++++++++++++++++++++++++++++++++++++++++++++++++++++++++++++++++++++++++++++++++++!""! ,-&./-!+++++++++++++++++++++++++++++++++++++++++++++++++++++++++++++++++++++++++++++++++++++++++++++++++++++++++++++++++++++++++++++++++++++++++++++++++++++++++++++!"""! $*012345675/51'&!+++++++++++++++++++++++++++++++++++++++++++++++++++++++++++++++++++++++++++++++++++++++++++++++++++++++++++++++++++++++++++++++++++++!"#! $('"*45&!+++++++++++++++++++++++++++++++++++++++++++++++++++++++++++++++++++++++++++++++++++++++++++++++++++++++++++++++++++++++++++++++++++++++++++++++++++++++++++++++!#! 8)%45!29!*21'51'&!++++++++++++++++++++++++++++++++++++++++++++++++++++++++++++++++++++++++++++++++++++++++++++++++++++++++++++++++++++++++++++++++++++++++++!#"! "#$%!&!'(%$)*+,%-)(!#(*!.-%/$#%+$/!$/0-/1!2222222222222222222222222222222222222222222222222222222222222222!3! '!4/(/$#.!-(%$)*+,%-)(!22222222222222222222222222222222222222222222222222222222222222222222222222222222222222222222222222222222222222!&! ''!5-(),+.#$!0-6-)(!2222222222222222222222222222222222222222222222222222222222222222222222222222222222222222222222222222222222222222222222!7! :! ;"&'2(<!++++++++++++++++++++++++++++++++++++++++++++++++++++++++++++++++++++++++++++++++++++++++++++++++++++++++++++++++++++++++++++++++++++++++++++++++++!=! >! ?.&"21!29!%"12*.4)(!"/)75&!+++++++++++++++++++++++++++++++++++++++++++++++++++++++++++++++++++++++++++++++++++++++++++++++++++++++++!@! A! B"12*.4)(!&.//)'"21!++++++++++++++++++++++++++++++++++++++++++++++++++++++++++++++++++++++++++++++++++++++++++++++++++++++++++++++++++++!@! =! B"12*.4)(!("#)4(<!++++++++++++++++++++++++++++++++++++++++++++++++++++++++++++++++++++++++++++++++++++++++++++++++++++++++++++++++++++++++++++++!C! =+:! D<5E!#5(&.&!F)''5(1E("#)4(<!+++++++++++++++++++++++++++++++++++++++++++++++++++++++++++++++++++++++++++++++++++++++++++++++++++++++++++++!:G! =+>! H5(*5F'.)4!'()1&"'"21&!"1!%"12*.4)(!("#)4(<!++++++++++++++++++++++++++++++++++++++++++++++++++++++++++++++++++++++++++++++!:A! =+A! D995*'&!29!&.FF(5&&56!"/)75&!++++++++++++++++++++++++++++++++++++++++++++++++++++++++++++++++++++++++++++++++++++++++++++++++++++++++++!:A! =+=! B"12*.4)(!("#)4(<!"1!'I5!%()"1!+++++++++++++++++++++++++++++++++++++++++++++++++++++++++++++++++++++++++++++++++++++++++++++++++++++++++!:=! J! B"12*.4)(!("#)4(<!)16!&'5(52F&"&!++++++++++++++++++++++++++++++++++++++++++++++++++++++++++++++++++++++++++++++++++++++++++++!:=! '''!8%/$/)96-6!22222222222222222222222222222222222222222222222222222222222222222222222222222222222222222222222222222222222222222222222222222!&:! :! K')75&!29!&'5(52&*2F"*!F(2*5&&"17!+++++++++++++++++++++++++++++++++++++++++++++++++++++++++++++++++++++++++++++++++++++++++!:@! >! KF)'")4!)16!'5/F2()4!4"/"'&!29!&'5(52F&"&!+++++++++++++++++++++++++++++++++++++++++++++++++++++++++++++++++++++++++++!:@! >+:! KF)'")4!4"/"'&!29!&'5(52F&"&!+++++++++++++++++++++++++++++++++++++++++++++++++++++++++++++++++++++++++++++++++++++++++++++++++++++++++++++++!:L! >+>! 85/F2()4!4"/"'&!+++++++++++++++++++++++++++++++++++++++++++++++++++++++++++++++++++++++++++++++++++++++++++++++++++++++++++++++++++++++++++++++++++++!>J! A! 8I5!FI<&"2427<!29!&'5(52F&"&!+++++++++++++++++++++++++++++++++++++++++++++++++++++++++++++++++++++++++++++++++++++++++++++++++++!>M! A+:! N"&F)("'<!65'5*'2(&!++++++++++++++++++++++++++++++++++++++++++++++++++++++++++++++++++++++++++++++++++++++++++++++++++++++++++++++++++++++++++++++!>M! A+>! ?(2/!O:!'2!O>!++++++++++++++++++++++++++++++++++++++++++++++++++++++++++++++++++++++++++++++++++++++++++++++++++++++++++++++++++++++++++++++++++++++++!>@! A+A! N"&F)("'<!"1!'I5!#51'()4!)16!62(&)4!&'(5)/&!+++++++++++++++++++++++++++++++++++++++++++++++++++++++++++++++++++++++++++++!>L! =! P26544"17!++++++++++++++++++++++++++++++++++++++++++++++++++++++++++++++++++++++++++++++++++++++++++++++++++++++++++++++++++++++++++++++++++++++++++!AG! =+:! K24#"17!'I5!*2((5&F21651*5!F(2%45/!3"'I!P)((Q&!*2/F.')'"21)4!)FF(2)*I!++++++++++++!A:! =+>! H2&"'"21!#&+!FI)&5!6"&F)("'<!+++++++++++++++++++++++++++++++++++++++++++++++++++++++++++++++++++++++++++++++++++++++++++++++++++++++++++++!A>! =+A! R2/F45S!*544&!)16!'I5!6"&F)("'<!515(7<!/2654!+++++++++++++++++++++++++++++++++++++++++++++++++++++++++++++++++++++++!A=! =+=! K24#"17!'I5!*2((5&F21651*5!F(2%45/!3"'I!*(2&&E*2((54)'"21!++++++++++++++++++++++++++++++++++++++++++!AM! J! R21*4.&"21&!+++++++++++++++++++++++++++++++++++++++++++++++++++++++++++++++++++++++++++++++++++++++++++++++++++++++++++++++++++++++++++++++++++++!A@! "#$%!;!<=9/$->/(%#.!?)$@!2222222222222222222222222222222222222222222222222222222222222222222222222222222222222222222!A3! 'B!C/9%D!9/$,/9%-)(!E$)>!>)(),+.#$!),,.+6-)(!22222222222222222222222222222222222222222222222222222222222!AF! :! T1'(26.*'"21!++++++++++++++++++++++++++++++++++++++++++++++++++++++++++++++++++++++++++++++++++++++++++++++++++++++++++++++++++++++++++++++++++++!AC! :+:! ;"&'2(<!++++++++++++++++++++++++++++++++++++++++++++++++++++++++++++++++++++++++++++++++++++++++++++++++++++++++++++++++++++++++++++++++++++++++++++++++++++++!AC! :+>! 6)!O"1*"!&'5(52F&"&!)16!2**4.&"21!752/5'(<!++++++++++++++++++++++++++++++++++++++++++++++++++++++++++++++++++++++++++++!=:! :+A! 6)!O"1*"!&'5(52F&"&!)16!62.%45!9.&"21!++++++++++++++++++++++++++++++++++++++++++++++++++++++++++++++++++++++++++++++++++++++++!=J! :+=! P212*.4)(!7)F!&'5(52F&"&!++++++++++++++++++++++++++++++++++++++++++++++++++++++++++++++++++++++++++++++++++++++++++++++++++++++++++++++++!=@! :+J! K'5(52!/2654&!"1*4.6"17!.1F)"(56!95)'.(5&!+++++++++++++++++++++++++++++++++++++++++++++++++++++++++++++++++++++++++++++!=C! :+M! R21*4.&"21!+++++++++++++++++++++++++++++++++++++++++++++++++++++++++++++++++++++++++++++++++++++++++++++++++++++++++++++++++++++++++++++++++++++++++++++++!J:! >! 8I5!(245!29!'()1&F)(51*<!"1!6)!O"1*"!&'5(52F&"&!++++++++++++++++++++++++++++++++++++++++++++++++++++++++++++++!J>!! #""! B!G6-(H!6)+(*!#6!#!%)).!%)!6%+*I!>)%-)(J-(J*/9%D!22222222222222222222222222222222222222222222222222222222!KA! :! T1'(26.*'"21!++++++++++++++++++++++++++++++++++++++++++++++++++++++++++++++++++++++++++++++++++++++++++++++++++++++++++++++++++++++++++++++++++++!JA! :+:! 832!"165F51651'!*.5&!92(!&'5(52/2'"21!++++++++++++++++++++++++++++++++++++++++++++++++++++++++++++++++++++++++++++++++++!J=! :+>! U'"4"'<!29!RNV8!)16!TVON!"192(/)'"21!++++++++++++++++++++++++++++++++++++++++++++++++++++++++++++++++++++++++++++++++++++++++!M>! :+A! D#"651*5!92(!&F5*"9"*!/2'"21E"1E65F'I!/5*I)1"&/&!++++++++++++++++++++++++++++++++++++++++++++++++++++++++++++!MA! :+=! U1(5&24#56!W.5&'"21&!+++++++++++++++++++++++++++++++++++++++++++++++++++++++++++++++++++++++++++++++++++++++++++++++++++++++++++++++++++++++++!M@! >! K<1*I(21"X56!).6"2E#"&.)4!'()1&"51'&!6("#5!599"*"51'!#"&.)4!&5)(*I!92(!/2'"21E "1E65F'I!+++++++++++++++++++++++++++++++++++++++++++++++++++++++++++++++++++++++++++++++++++++++++++++++++++++++++++++++++++++++++++++++++++++++++++++++++++++!MC! A! K'5(52/2'"21!65'5*'2(&!)(5!F22(4<!&."'56!'2!'()*0!>N!/2'"21!+++++++++++++++++++++++++++++++++!@G! B'!LD/!/EE/,%!)E!#+*-)J0-6+#.!H$)+9-(H!)(!6%/$/)#,+-%I!2222222222222222222222222222222222222222222222!M&! :! T1'(26.*'"21!++++++++++++++++++++++++++++++++++++++++++++++++++++++++++++++++++++++++++++++++++++++++++++++++++++++++++++++++++++++++++++++++++++!@>! :+:! Y5.(2FI<&"2427<!29!/.4'"&51&2(<!"1'57()'"21!++++++++++++++++++++++++++++++++++++++++++++++++++++++++++++++++++++++++!@>! :+>! B5I)#"2.()4!/5)&.(5&!29!).6"2E#"&.)4!"1'57()'"21!+++++++++++++++++++++++++++++++++++++++++++++++++++++++++++++++!@J! :+A! B5159"'&!29!*(2&&E/26)4!"1'5()*'"21&!+++++++++++++++++++++++++++++++++++++++++++++++++++++++++++++++++++++++++++++++++++++++++++!@M! :+=! P)S"/./EZ"054"I226!D&'"/)'"21!+++++++++++++++++++++++++++++++++++++++++++++++++++++++++++++++++++++++++++++++++++++++++++++++++!@@! :+J! $"/!29!'I5!F(5&51'!&'.6<!+++++++++++++++++++++++++++++++++++++++++++++++++++++++++++++++++++++++++++++++++++++++++++++++++++++++++++++++++++!@L! >! P5'I26!++++++++++++++++++++++++++++++++++++++++++++++++++++++++++++++++++++++++++++++++++++++++++++++++++++++++++++++++++++++++++++++++++++++++++++++!@L! >+:! H)('"*"F)1'&!+++++++++++++++++++++++++++++++++++++++++++++++++++++++++++++++++++++++++++++++++++++++++++++++++++++++++++++++++++++++++++++++++++++++++++++!@C! >+>! K'"/.4.&!F(5&51')'"21!++++++++++++++++++++++++++++++++++++++++++++++++++++++++++++++++++++++++++++++++++++++++++++++++++++++++++++++++++++++++!@C! >+A! K'"/.4"!+++++++++++++++++++++++++++++++++++++++++++++++++++++++++++++++++++++++++++++++++++++++++++++++++++++++++++++++++++++++++++++++++++++++++++++++++++++++!@C! >+=! H(2*56.(5!++++++++++++++++++++++++++++++++++++++++++++++++++++++++++++++++++++++++++++++++++++++++++++++++++++++++++++++++++++++++++++++++++++++++++++++++!L>! A! ,5&.4'&!+++++++++++++++++++++++++++++++++++++++++++++++++++++++++++++++++++++++++++++++++++++++++++++++++++++++++++++++++++++++++++++++++++++++++++++++!L>! =! N"&*.&&"21!++++++++++++++++++++++++++++++++++++++++++++++++++++++++++++++++++++++++++++++++++++++++++++++++++++++++++++++++++++++++++++++++++++++++!LA! J! R21*4.&"21!+++++++++++++++++++++++++++++++++++++++++++++++++++++++++++++++++++++++++++++++++++++++++++++++++++++++++++++++++++++++++++++++++++++++!LM! B''!4/(/$#.!*-6,+66-)(!#(*!,)(,.+6-)(!2222222222222222222222222222222222222222222222222222222222222222222222222222!3M! N/E/$/(,/6!222222222222222222222222222222222222222222222222222222222222222222222222222222222222222222222222222222222222222222222222222222222!3F! !
! L!
Part 1
! :!
I General introduction
“To my astonishment, I began to see in 3D. Ordinary things looked extraordinary. Sink faucets reached out toward me, hanging light fixtures seemed to float in mid-air, and I could see how the outer branches of trees captured whole volumes of space through which the inner branches penetrated. Borders and edges appeared crisper; objects seemed more solid, vibrant, and real. I was overwhelmed by my first stereo view of a snowfall in which I could see the palpable pockets of space between each snowflake.”
Sue Barry Psychology Today
Susan Barry, professor of neurobiology, was stereoblind from birth due to congenital strabismus until she gained stereovision after several years of optometric training. In her book “Fixing My Gaze”, “Stereo Sue” describes her first experiences of stereoscopic vision. In an interview given to Psychology Today (see citation above), she tries to capture the ineffable sensation of stereopsis and how it affects our global visual experience. Stereoscopic vision is involved in various complex visual tasks. In her own words, she describes how stereoscopic 3D shape discrimination is used for object recognition (“I could see how the outer branches of trees captured whole volumes of space through which the inner branches penetrated.”) and guiding of rapid precise actions such as eye movements
or hand reaching (“Sink faucets reached out toward me.”). She also explains how the
acute sensitivity of the stereoscopic system to depth discontinuities allows fine object segmentation (“borders and edges appeared crisper”). By referring to the spatial
configuration of snowflakes (“I could see the palpable pockets of space between each snowflake”), Sue Barry gives a practical example of the extraordinary acuity of the
stereoscopic system.
The impact of Sue Barry’s book on the scientific community was ultimately substantial but lukewarm at first. Over forty years ago, Hubel & Wiesel (1962) demonstrated the existence of a critical period in the development of the visual system during which equal binocular inputs are necessary of normal
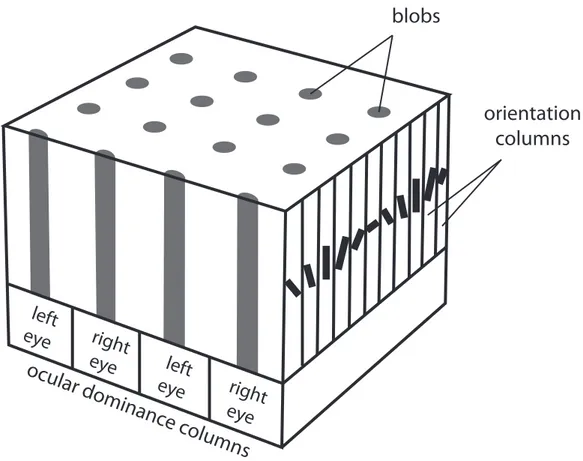
! >! development of cortical and perceptual binocularity. Their discovery was based on induced strabismus in kittens. If caused during the first days of life, it resulted in massive loss of binocular cells in the primary visual cortex. Cortical columns of neurons (Fig. I.1) normally receiving inputs from the two eyes were instead activated only by the healthy eye. Ocular dominance columns connected to the strabismic eye were small and columns connected to the non-deviating eye abnormally large. This unequal ocular dominance distribution was still found after the three-months critical period.
Figure I.1 | Normal ocular dominance columns in the primary visual cortex. Each point in the visual field produces a response in a 2x2 mm area of the primary visual cortex called a hypercolumn. Each of these areas contains two pairs of ocular dominance columns. Within one ocular dominance column, an alternation of blobs and interblobs contains neurons sensitive to all possible orientations across 180°
In 1981, Hubel & Wiesel were awarded a Nobel prize for their work on the development of the visual system and the description of ocular dominance
left
eye
blobs
right
eye
left
eye
right
eye
orientation
columns
ocular dominanc
e columns
! A! columns. Since then, it was accepted truth that a critical period of normal binocular input is required for healthy stereoscopic development. As a result, congenital strabismic patients never received optometric rehabilitation.
The publication of Sue Barry’s book was closely followed by an article by Ding & Levi (2011) reporting that human adults with abnormal binocular vision (due to strabismus or amblyopia) recovered stereopsis through perceptual learning. Stereopsis, the same visual attribute used over forty years ago to demonstrate the existence of a critical period for the visual system, now bears striking evidence of functional plasticity. Because it is highly dependent on the wiring of neurons spread throughout several regions of the visual cortex and because it is involved in a significant number of various visual tasks, stereopsis can be considered as a canonical representation of visual processing.
Lately, the study of stereopsis has benefited from the recent development of 3D movies, television and 3D gaming consoles that have drawn attention to specific issues such as the vergence-accommodation conflict or visual plasticity.
Throughout the introduction of this thesis, we will first briefly introduce the basic concepts of binocular vision (fusion, binocular summation and binocular rivalry) and then move on to a more detailed review of stereopsis. The purpose of the literature review on stereopsis is to give a broad overview of the current knowledge on the field, highlight apparent contradictions and stress unsolved issues using results from the psychophysics, neurophysiology, imaging and modelling literature. The experimental work conducted during the past three years is detailed in the three experimental chapters. Each chapter comprises an Introduction section followed by an experimental report in the form of a scientific article. The goal of these Introduction sections is to give a critical review of the literature on the topic of the studies presented in each chapter and present the issue addressed in the study. In the second chapter, we present a series of experiments on the role of monocular regions in stereoscopic processing. In the third chapter we present two experimental projects on the processing of motion-in-depth. In the fourth chapter, we describe a series of experiments on auditory facilitation of stereoacuity. Finally, in the General
! =! discussion and Conclusion sections we discuss altogether the results obtained in the four experimental projects presented in this thesis.
II Binocular vision
1
History
By means of mathematics and individual introspection, the ancient Greeks were among the first to expound theories about the optics of the eyes and the transformation of light into visual percepts. Around the 5th century BC, the
distance of an object was thought to be sensed by the length of the light rays arriving to the eyes. The first mention of binocular disparity was made by Aristotle (384-322 BC). He realized that one sees double when an object does not fall on corresponding points in the two eyes, for example as a result of misconvergence. Euclid (323-285 BC) was the first to suggest a potential role of occlusion geometry in spatial perception. He observed that a far object is occluded by a nearer object by a different extent in the two eyes and therefore that two eyes see more of an object than either eye alone when the object is smaller than the interocular distance. Ptolemy (c. AD 100-175) hypothesized that binocular vision is used to actively bring the visual axes onto the object of interest, making the first mention of vergence eye movements. Based on anatomical observations, Galen (c. AD 129-201) proposed that the combination of the optic nerves in the chiasma unites impressions from the two eyes.
Almost one century later in Egypt, Alhazen (c. AD 965-1040) confirmed that the movements of the eyes are conjoint to converge on the object of interest. He also explained that the lines of sight for objects close to the intersection of the visual axes fall on corresponding points of the two retinas.
Interest in visual perception was lost during six centuries and regained in Europe by the end of the middle ages. Based on previous observations from the Greeks, artists such as da Vinci (1452-1519) became interested in the issue of
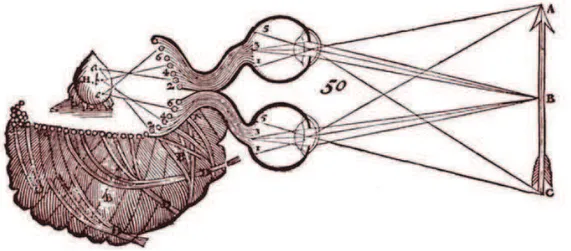
! J! representing three-dimensional space into pictorial space. Da Vinci demonstrated that what can be seen from two vantage points cannot be faithfully represented on a canvas. He also reported that an object occludes a different part of the scene to each eye and that occlusion disparity can be a source of information to depth. Descartes (1596-1650) extended Galen’s conclusions and hypothesized that the united image from the two eyes is projected back onto the brain (on the pineal gland, Fig. II.1).
Figure II.1 | Illustration of the stereoscopic visual system by Descartes. Corresponding points of the arrow are projected upon the surface of the cerebral ventricles and then to the pineal gland, H (“seat of imagination and common sense”). (reproduced from Polyak, 1957)
Furthermore, Descartes and Rohault (1618-1672) made the first reference to retinotopy by suggesting that corresponding points in the retina are spatially mapped onto the pineal gland. This assumption was enriched with Newton’s (1642-1727) proposition that visual paths are segregated: the temporal half of the retina is treated ipsilaterally while the nasal part is treated contralaterally. Prévost (1751-1839) was the first to describe the horopter (locus of points in space that can be correctly fused and yield single vision) whose geometry was established by Vieth and Müller a few years later.
In 1838, Wheatstone designed the first mirror stereoscope (Fig. II.2) and demonstrated that binocular disparity (horizontal separation between the
! M! projections of an object’s image in the left and right eyes) plays a crucial role in depth perception.
Figure II.2 | Illustration of Wheatstone’s first mirror stereoscope. (reproduced from Wheatstone, 1838)
Before 1960, it was believed that stereopsis is the product of high-level cognitive processes. According to Helmholtz (1821-1894) and his student Wundt (1832-1920), a united image of the world was produced by a “mental act” and not by “any anatomical process”. The existence of neurons sensitive to binocular inputs was first suggested by Ramon & Cajal in 1911 and then demonstrated by Hubel & Wiesel (1959; 1962). A few years later, Pettigrew, an undergraduate student, recorded cells sensitive exclusively to binocular disparity in the Cat’s cortex in the University of Sydney (Pettigrew, Nikara, & Bishop, 1968) and in the University of Berkeley (Barlow, Blakemore, & Pettigrew, 1967). This provided the first evidence of the existence of disparity detectors.
At the same time, Julesz (1964a) used random-dot stereograms (RDSs — pairs of images of random dots which produce a sensation of depth when seen separately by the two eyes) to demonstrate that binocular disparity is sufficient for the perception of depth. RDSs were then used by Marr & Poggio (1979; 1976) to develop the first algorithm capable to solving stereoscopic depth exclusively on the basis of binocular disparity. (For an exhaustive review on the history of binocular vision, see Howard, 2002).
! @!
2
Fusion of binocular images
By the time Wheatstone demonstrated the importance of binocular disparity in depth perception, there co-existed two theories of how binocular images are combined into a single percept. In the fusion theory, similar images that fall on corresponding points of the retinas access the visual system simultaneously and are fused to form a unitary percept while dissimilar images are suppressed alternatively. According to the suppression theory, both similar and dissimilar images engage in alternating suppression at an early stage of visual processing. The discovery of binocular cells in the striate cortex of the cat by Hubel & Wiesel (1962) favoured the idea that the fusion of similar images happen at a low level of processing and fusion became the prevailing theory.
The fusion of binocular images brings several advantages in addition to stereoscopic vision. For example, complex visual tasks such as reading or visuo-motor coordination are better with binocular viewing even if the visual stimuli do not contain any stereoscopic depth information (R. K. Jones & Lee, 1981; Sheedy, Bailey, Buri, & Bass, 1986). As we will see in the following section, detection and discrimination of visual stimuli are better when performed by two eyes instead of one. This phenomenon is called binocular summation. However, when images are too different they compete for access to higher levels of visual processing, resulting in alternating perception of the two. This phenomenon is called binocular rivalry. In the last section, we will overview the main issues concerning binocular rivalry: what rivals during rivalry, what triggers alternation and what survives suppression. The mechanisms underlying stereoscopic vision will be the subject of a separate chapter of this introduction.
3
Binocular summation
Binocular summation refers to the process by which binocular vision is enhanced compared to what would be expected with monocular viewing. Binocular summation results in increased sensitivity in detection and discrimination tasks. For example, Blake & Fox (1973) showed that visual
! L! resolution measured with high-contrast gratings was slightly higher with binocular vision.
Different causes for binocular summation have been suggested. First, a series of psychophysical studies reveal that low-level factors can contribute to binocular summation. For example, it has been shown that pupil size in one eye is influenced by illumination in the other eye, suggesting that subcortical centres that control pupillary dilatation combine inputs from the two eyes (Thomson, 1947). Increased binocular acuity could also be due to binocular fixation being steadier.
Apart from low-level facilitation, binocular summation is thought to be the main product of probability summation. There is a statistical advantage of having two detectors (eyes) instead of one. Between the sixties and the eighties, there were two alterative accounts of probability summation, both assumed that binocular summation was achieved through a single channel and posited a summation ratio of 40% between monocular and binocular thresholds. Campbell & Green (1965) proposed that monocular signals are linearly summed and that the signal-to-noise ratio is decreased because the two sources of noise are uncorrelated. Alternatively, Legge (1984a; 1984b) posited that the binocular contrast of a grating is the quadratic sum of the monocular contrasts. Monocular signals are squared prior to combination. Anderson & Movshon (1989) used adaptation and noise to refute the single-channel assumption and proposed that there are several ocular-dominance channels of binocular summation. The maximum summation ratio of 40% was then questioned by several studies that found substantially larger summation ratios (Meese, Georgeson, & Baker, 2006).
More recent multi-stage models of binocular summation have been proposed. For example, the models by Ding and Sperling (2006) and Meese, Georgeson, & Baker (2006) are based on contrast gain control mechanisms before and after combination of the two monocular signals.
! C!
4
Binocular rivalry
When the images arriving to the two eyes are too dissimilar in colour, orientation, motion, etc., the visual system fails to fuse them into a single coherent percept. The images from the two eyes then rival for dominance and access to perceptual awareness, and the observer’s perception alternates every few seconds between one image and the other (Fig. II.3).
Various aspects of the visual stimulation are known to influence binocular rivalry. For example, Levelt (1965; 1966) proposed that the strength of a stimulus determines the duration of its suppression: the weaker it is the longer it is suppressed. He proposed that the strength of a stimulus is proportional to the density of contour in the image. Mueller & Blake (1989) later showed that the contrast of rival patterns had an effect on the rate of alternation. Blur is also known to affect binocular rivalry: Humphriss (1982) demonstrated that defocussed images tend to be suppressed in favour of sharp images.
! :G!
Figure II.3| Examples of binocular rivalry stimuli. The left and right columns show images presented to the left and right eyes respectively. A. Dichoptic orthogonal gratings. B. Stimuli used to study interocular grouping, adapted from Tong, Nakayama, Vaughan, & Kanwisher (1998). C. Rivalry using complex objects, adapted from Kovács, Papathomas, Yang, & Fehér (1996). (reproduced from Tong, Meng, & Blake ,2006)
4.1 Eye- versus pattern-rivalry
Traditionally, two alternative conceptions of binocular rivalry co-existed until the mid-nineties. According to one view, competition occurs between neurons in the primary visual cortex (Blake, 1989; Tong, 2001) or in the lateral geniculate nucleus (Lehky, 1988) that represent local corresponding regions in the two eyes. Alternatively, binocular rivalry could take place in later stages of
A.
B.
! ::! visual processing and reflect competition between incompatible patterns (e.g. Diaz-Caneja, 1928; Kovács et al., 1996) that could be distributed between the two eyes (Fig. II.4).
Figure II.4 | Eye- versus pattern-rivalry. When composite images as seen in the lower pair of images are presented to the left and right eyes, perception alternates between the two coherent percepts shown in the upper pair of images. (reproduced from Kovács, Papathomas, Yang & Fehér, 1996)
More recently, models incorporating elements of both views have been proposed, promoting the idea that rivalry is based on neural competition at multiple stages of visual processing (Freeman, 2005; Wilson, 2003). Neural competition is mediated by reciprocal inhibition between visual neurons. A group of neurons dominates temporarily until they can no longer inhibit the activity of competing neurons. When inhibition breaks down, perceptual dominance is reversed. This competition is thought to take place both between monocular and pattern-selective neurons (Fig. II.5).
! :>!
Figure II.5 | Schematic diagram of inhibitory and excitatory connections in a hybrid rivalry model. Reciprocal inhibitory connections between monocular neurons and binocular neurons (blue lines) account for eye-based and pattern-based visual suppression, respectively. Reciprocal excitatory connections (red lines). These lateral interactions might account for eye-based grouping, low-level grouping between monocular neurons with similar pattern preferences including interocular grouping, and high-level pattern-based grouping between binocular neurons. Excitatory feedback projections (green lines) might account for top-down influences of visual attention and also feedback effects of perceptual grouping. (adapted from Tong et al., 2006)
left eye column right eye column left eye column right eye column inhibitory connections grouping connections feedback connections
! :A!
4.2 Perceptual transitions in binocular rivalry
There is a consensus around the idea that alternations in binocular rivalry are mainly the product of adaptation. The activity of neurons associated with the dominant percept progressively vanishes over time, reducing the strength of its inhibition on the suppressed group of neurons. This dynamic process eventually leads to a reversal in the balance of activity between the two neural representations (Alais, Cass, O'Shea, & Blake, 2010; Blake, Sobel, & Gilroy, 2003). Since adaptation takes place at all stages of visual processing, this hypothesis is compatible with both eye- and pattern-rivalry.
However, adaptation cannot fully account for the dynamics of binocular rivalry. Incorporating neural noise either in the inhibitory or the excitatory network has been proposed to explain the stochastic properties of rivalry alternations (van Ee, 2009). Attention has been found to bias the first percept and the duration of subsequent alternation sequences (Chong, Tadin, & Blake, 2005). Recently, Chopin & Mamassian (2012) demonstrated that the current percept in binocular rivalry is strongly influenced by a time window of stimuli presented remotely in the past. They proposed that the remote past is used to estimate statistics about the world and that the current percept is the one that matches these statistics.
4.3 Effects of suppressed images
fMRI recordings have shown that activation evoked by the suppressed stimulus is reduced compared to the activation produced by the dominant image. However, various psychophysical paradigms have demonstrated that suppressed stimuli can affect visual processing. For example, it has been shown that suppressed stimuli can induce adaptation aftereffects, visual priming (Almeida, Mahon, Nakayama, & Caramazza, 2008) and covertly guide attention to definite locations of the suppressed image (Jiang & He, 2006). It has also been shown that stimuli that convey meaningful or emotional information are suppressed for a shorter duration (Jiang, Costello, & He, 2007).
! :=!
4.4 Binocular rivalry in the brain
Imaging techniques such as EEG or fMRI have been used to investigate the neural correlates of the inhibitory components and reversals in binocular rivalry. fMRI techniques have allowed researchers to tag the activity corresponding the each of the two percepts involved in the alternation. For example, Tong and colleagues (1998) induced rivalry between face and house pictures and showed that activation in the regions selectively sensitive to these two categories was correlated with the dynamics of rivalry.
As explained in the first pages of this section, binocular rivalry can be seen as a failure in fusing the images from the two eyes. A majority of the computational models of stereoscopic processing has focused on the computations taking place once fusion is achieved. A few alternative models have intended to include binocular rivalry as part of the resolution of the correspondence problem. One exception is Hayashi, Maeda, Shimojo, & Tachi (2004) who proposed that rivalry is the default outcome of the system when binocular matching fails (see chapter IV, section 1.5 for a more detailed review of this type of stereo models).
5
Binocular rivalry and stereopsis
According to the parallel pathways theory (Wolfe 1986, Kaufman 1964), stereopsis and binocular rivalry are processed in separate pathways. In particular, Wolfe argued that suppression is active in the rivalry pathway at all times, even when the two monocular views are identical. In parallel, the suppressed image is used to compute binocular disparity. In favour of this theory, Kaufman (1964) showed that a random-dot stereogram containing binocular disparities is seen in depth while the background (with a different colour in the two eyes’ images) is seen as rivalrous (Fig. II.6). Following this framework, Carlson & He (2000) proposed that the chromatic parvo-cellular pathway deals with binocular rivalry while the achromatic magno-cellular pathway extracts binocular disparity. However, there is currently no convincing
! :J! evidence that these two pathways (hence processes) are genuinely parallel and not sequential. It remains to be demonstrated that stereoscopic vision and binocular rivalry can be based on the same substrate.
Figure II.6 | Colour rivalry in stereoscopic vision. Fusing these two images creates relative depth between the two embedded circles and colour rivalry at the same time. (adapted from Treisman, 1962)
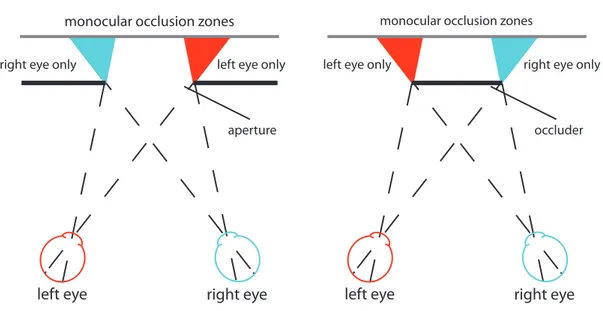
Today, the predominant theory (Blake, 1989; Julesz & Tyler, 1976) advances that fusion is the first step and that the extraction of binocular disparity takes place only if fusion is successful. When fusion fails, images a locally engaged in the second step, which is binocular rivalry. It is worth noting that unpaired regions of an image (seen by one eye only) do not engage in rivalry or suppression when they are consistent with the geometry of occlusion present in the scene (Nakayama & Shimojo, 1990). See chapter IV for a detailed review and an experimental study on depth from monocular occlusion.
! :M!
III Stereopsis
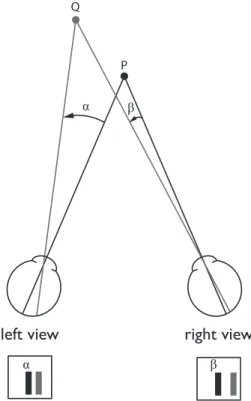
The word stereopsis refers to the impression of depth that arises when a scene is viewed binocularly. The horizontal separation between the eyes creates two different vantage points. The images seen by the two eyes are therefore slightly different. These differences are called binocular disparities (Fig. III.1) and they are used by the visual system to recover the depth position of the objects and surfaces present in the visual scene as well as their 3D structure.
Figure III.1 | Top down view of the two eyes fixating point P. The relative depth between points P and Q is computed from the angular disparity = ! - ".
In the present section, we will give a brief overview of the knowledge acquired on stereopsis since the nineteenth century. First, we will focus on the basic properties of the stereoscopic system, referring mainly to psychophysical studies. Then we will rely on neurophysiological and imaging studies to try to understand how binocular disparity is processed in the brain. Finally, we will outline the main computational
α β
α β
P Q
! :@! and biologically-inspired concepts used to model the processing of binocular disparity in the stereoscopic system
1
Stages of stereoscopic processing
In order to precisely evaluate the depth of objects and surfaces, the visual system relies on outputs from neurons sensitive to such basic properties as orientation and spatial frequency. As we will see, the visual system will be confronted by several computational problems to transform these outputs into complex depth maps. Backus, Fleet, Parker & Heeger (2001) identified six stages of stereoscopic processing. The first three stages are involved in the computation of disparity maps based on retinal disparity inputs. Once absolute disparities (relative to the point of fixation) are detected, they are converted into relative disparities (independent of fixation). Several psychophysical studies have shown the importance of relative disparity for stereopsis. For example, it has been shown that changes in absolute disparity do not produce changes in perceived depth (Erkelens & Collewijn, 1985) and that stereoscopic thresholds are not a simple function of absolute disparity (Andrews, Glennerster, & Parker, 2001). Disparity information is then spread across the surface to fill-in ambiguous areas and construct the disparity map. This process is also known as disparity interpolation (Warren, Maloney, & Landy, 2002; 2004). The fourth stage is segmentation based on disparity (Westheimer, 1986) were the disparity map is segmented into discrete objects. The fifth stage is the disparity calibration in order to estimate depth, where disparity values are scaled by viewing distance to extrapolate the actual depth between different surfaces. Finally, the percept created by stereopsis can drive attention to specific locations of space (He & Nakayama, 1995).
2
Spatial and temporal limits of stereopsis
To construct a representative map of the disparities present in a scene, the stereoscopic system must solve the “correspondence problem”. It has to detect the corresponding points in the two eyes’ images and discard potential false matches. The
! :L! possible solutions to the correspondence problem are constrained by various spatial and temporal limits of the stereoscopic system.
2.1 Spatial limits of stereopsis
2.1.1 The horopter, the Vieth-Muller circle and Panum’s fusional area
Aguilonius introduced the term horopter in 1613 to describe the location in space in which fused images appear to lie. Two hundred years later, Vieth and Müller argued from geometry that the theoretical horopter should be a circle (now known as the Vieth-Müller circle) passing through the point of fixation and the centres of the eyes. When measured empirically, the horopter is found to be flattened compared to the Vieth-Müller circle. The detection of planarity constitutes a challenge for the stereoscopic system and it has been suggested that there exists a prior for perceiving fronto-parallel planes rather than curved surfaces.
If defined by singleness of vision (fusion), the empirical horopter is much thicker. This range of disparities within which fusion is achieved has been studied by Panum (1858) and called the Panum’s fusional area (Fig. III.2). The Panum’s fusional area expands around the empirical horopter. Stimuli containing disparities outside this range lead to diplopic images. Ogle (1952) measured the maximum disparity (dmax)
that produced depth with fused images (± 5 arcmin), depth with double images (± 10 arcmin) and vague impression of depth with diplopia (± 15 arcmin). He dubbed the first two patent stereopsis and the last qualitative stereopsis. It is worth mentioning that more recent studies have found larger estimates of these critical values.
! :C!
Figure III.2 | Schematic representation of the geometry of stereopsis. Top down view of the two eyes fixating point P. The horopter, the Vieth-Müller circle and the Panum’s fusional area. Two points falling on the Vieth-Müller circle project on corresponding points of the two retinas and therefore subtend the same angle (!).
2.1.2 Stereoacuity
Stereoacuity is the smallest detectable depth difference between two stimuli when
binocular disparity is the only cue to depth. The first stereoacuity test was developed by Helmholtz: a vertical rod had to be adjusted in depth to appear in the same plane as two flanking rods. Later, the Howard-Dolman test in which observers had to judge the depth of one rod relative to another was used by the American Air Force on pilots and demonstrated that stereoacuity can be as fine as 2 arcsec (see chapter VI for an experimental application of this method). In 1960, Julesz used random-dot stereograms (RDSs, Fig. III.4 & III.5) to measure stereoacuity in the absence of any monocular depth cue (such as perspective, blur or motion parallax). To create a RDS,
V ie th -M ü lle r c irc le horopter Pan um ’s fu sion al are a P
right eye
left eye
α α! >G! pixels of an array are randomly selected to be black or white. When the same RDS image is presented to the two eyes, a flat plane is perceived. If a portion of one of the two images is copied onto the other with a lateral displacement, it is perceived as a surface floating in depth. The distance between this surface and the plane of the image is determined by the amount of lateral displacement. Julesz found that stereoacuity from RDSs was highly accurate even though they took longer to see. RDSs were later used in standardized Stereoacuity tests such as the TNO test.
Figure III.3 | Stereo pair which, when viewed stereoscopically, contains a central rectangle perceived behind. (Reproduced from Julesz, 1964).
Figure III.4 | Illustration of the method by which the stereo pair of Fig. 4 was generated. Rectangle sectors of the left image were shifted either to the left of the right to create disparity between the two images. Positive disparity was added to the lower rectangle, negative disparity was added to the upper one. (Reproduced from Julesz, 1964).
! >:! Stereoacuity has been found to be highly dependent on several aspects of the stimuli used in the measuring process. For example, when the two test stimuli are presented with a disparity pedestal (with a mean disparity that is different from zero), stereoacuity decreases exponentially with the size of the disparity pedestal (Ogle, 1953).
2.1.3 Stereoresolution
It has also been shown that stereoacuity is scaled by the spatial frequency of the depth modulation in the image. Tyler (1973; 1975) measured spatial stereoresolution (the smallest detectable spatial variation in disparity) as a function of spatial frequency by presenting spatially periodic variations in disparity. He found that it was much poorer than the luminance resolution. While the highest detectable spatial frequency for luminance-defined corrugations was about 50 cpd (cycles per degree), it was only about 3 cpd for disparity-defined corrugations. Recent neurophysiological (Nienborg, Bridge, Parker, & Cumming, 2004) and psychophysical (Banks, Gepshtein, & Landy, 2004) results suggest that spatial stereoresolution is limited by the size of the receptive fields of V1 neurons and the type of computations underlying the extraction of disparity (see section 4.4 of this chapter for more details).
2.1.4 Disparity-gradient limit
Burt & Julesz (1980) were the first to mention that the maximum disparity for fusion could be modified by adding nearby objects to the scene. Rather than the Panum’s fusional area, these authors proposed that this limit is a ratio, a unitless perceptual constant. This ratio, the disparity-gradient (D) between two points is defined by the difference in their disparities (#) divided by the difference between the mean direction (across the two eyes) of the images of one object and the mean direction of the images of the other object ($) (Fig. III.5). A disparity gradient of zero corresponds to a surface lying on the horopter. When two points are aligned along a visual line in one eye, they have a horizontal disparity gradient of 2 (see Panum’s limiting case in chapter IV, section 1.3). This corresponds to the maximum theoretical gradient for opaque surfaces (Trivedi & Lloyd, 1985).
! >>!
Figure III.5 | Disparity gradients between the black dot and the grey square. The angle # is the difference in disparity between the two objects, $ is the separation in visual angle between the two objects and D is the disparity gradient. A. The two objects have a disparity gradient inferior to 2. B. Illustration of the Panum’s limiting case: the two objects are on the same line of sight for one eye. The disparity gradient is 2. C. There is no horizontal separation between the two objects: the disparity gradient is infinite. (redrawn from Howard & Rogers, 2002)
To measure the disparity-gradient limit, Burt & Julesz (1980) systematically varied the vertical separation of two dots and kept the relative disparity between the two constant. They showed that fusion was lost when the disparity-gradient exceeded a critical value of 1. P η δ D = η/δ L R
A.
right eye
left eye
P η δ D = η/δ L R D = 2B.
right eye
left eye
P η δ = 0 D = η/δ L R D = 0C.
! >A! This critical value of 1 was later incorporated by Pollard, Mayhew & Frisby (1985) in their PMF algorithm for solving the correspondence problem. Recently, Filippini & Banks (2009) proposed that the disparity-gradient limit is a byproduct of estimating disparity by computing the correlations between the two eyes’ images (see section 4.4 of this chapter for more details).
2.1.5 Vertical disparity
Vertical disparities are the differences in up-down positions of corresponding points in the left and right eyes images. The size of vertical disparities depends on the orientation of the eyes and the location of the object. The induced effect (Ogle, 1938) constitutes the first clear psychophysical evidence that vertical disparities can convey depth information. He showed that applying a vertical magnification to one eye’s image causes the illusion that a frontoparallel surface is rotated about a vertical axis. Objects projected on the eye having the smaller image appear nearer than the objects that are artificially magnified.
Physiological studies on Monkeys have shown that disparity detectors in MT (Maunsell & Van Essen, 1983) and V1/V2 (Durand, Celebrini, & Trotter, 2007; Durand, Zhu, Celebrini, & Trotter, 2002; Gonzalez, Justo, Bermudez, & Perez, 2003) were sensitive to both horizontal and vertical disparities. A more exhaustive review of the physiology of stereopsis can be found in section 3 of this chapter.
Vertical disparity is usually represented by the vertical size ratio (or VSR), which is the ratio of the vertical angles subtended by two points in the left and right eyes. The VSR provides information about the eccentricity of these two points. It increases with eccentricity because the points become closer to one eye and farther from the other. The VSR is also dependent on the absolute viewing distance. As can be seen in Figure III.6, the same VSR can correspond to near points at a small eccentricity or to farther points at a larger eccentricity. VSR therefore provides information about eccentricity at a given distance. If one of the two types of information is known, the other can be deducted.
! >=!
Figure III.6 | Vertical size ratio (VSR) as a function of eccentricity and distance. Each curve connects points of a given scene with the same VSR. The VSR can be the same for an object close to the observer and the medial plane as for an object seen from far away at a large eccentricity. (adapted from Gillam & Lawergren, 1983)
Two theories have been proposed to explain how vertical disparities participate in the solving of the correspondence problem. Mayhew and Longuet-Higgins (1982) postulated that vertical disparities can be used to recover the convergence distance and the angle of eccentric gaze. Alternatively, Gillam & Lawergren (1983) noted that the gradient of VSR as a function of eccentricity is constant for a given viewing distance. Therefore, this VSR gradient can be used to rescale relative disparities when viewing distance cannot be recovered.
More recent psychophysical studies have shown that vertical disparities are used by the visual system to perform various tasks. For example, vertical disparities can be combined with other depth cues for stereoscopic slant perception (Backus & Banks, 1999; Backus, Banks, van Ee, & Crowell, 1999) and vertical disparity discontinuities might be used to detect object boundaries (Serrano-Pedraza, 2010).
12% 10% 9% 8% 6% 1% 2% 3% 4% 5% 7% 20 120 100 80 60 40
distanc
e fr
om obser
v
er (cm)
! >J!
2.2 Temporal limits
2.2.1 Stimulus durationThe time of presentation required for perceiving depth from stereopsis greatly varies as a function of the type of stimuli and the experimental procedure used to measure it. Ogle & Weil (1958) were the first to properly measure stereoacuity as a function of stimulus duration with controlled fixation and showed that stereoacuity fell from 10 to 50 arcsec when stimulus duration was reduced from 1 sec to 7.5 ms. It was hypothesized that the integration of disparity over time may be analogous to the integration of luminance. Ogle & Weil’s stimuli were luminance-defined rods. Uttal, David & Welke (1994) reported that observers were above chance when asked to recognize a 3D shape on a RDSs presented for 1 ms. The also showed that this performance increased with the number of trials. This effect of practice on the latency of stereopsis for RDSs was also reported by Julesz (1960).
2.2.2 Processing time
In a following study, Julesz (1964a) measured processing time by recording the effect of an unambiguous stereogram on the perception of a following ambiguous one. He found that the inter stimulus interval had to be longer than 50 ms for the first stereogram to bias the perception of the second one. This 50 ms critical value was confirmed by Uttal, Fitzgerald & Eskin (1975) using a masking technique.
2.2.3 Temporal modulation of disparity
Another way of investigating the processing time for stereopsis is to look at the effect of temporal modulations of disparity on stereoacuity. Tyler (1971) compared motion sensitivity for smooth lateral motion and motion-in-depth for sine-wave modulation frequencies from 0.1 Hz to 5 Hz. He showed that sensitivity was best at a modulation frequency of about 1 Hz and that it was substantially better for lateral motion compared to motion-in-depth. Tyler & Norcia (1984) recorded motion perception for RDSs alternating in depth in abrupt jumps and showed that the limit
! >M! for apparent depth motion perception was approximately 6 Hz. Above this value, two pulsating planes were perceived simultaneously. A more exhaustive review on motion-in-depth can be found in chapter V, section 1.
3
The physiology of stereopsis
Closely following the discovery of Pettigrew and colleagues (see chapter II), Hubel & Wiesel found similar disparity-selective cells in the area V2 of the monkey’s visual cortex. Similar cells were later recorded in the area V1. Poggio and colleagues (1985) found that complex cells in areas V1 and V2 of the monkey respond to binocular disparity embedded in RDSs, providing the first evidence of the existence of cells sensitive exclusively to binocular disparity.
3.1 Disparity detectors
These disparity-selective neurons are now referred to as disparity detectors. Each disparity detector is defined by its disparity tuning function, which refers to the frequency of firing as a function binocular disparity. The peak of this distribution is the preferred disparity and its width indicates the disparity selectivity of the neuron. Originally, binocular cells were separated into six categories (Fig. III.7): excitatory cells tuned to zero disparity, tuned inhibitory cells, tuned excitatory cells for crossed disparities, tuned excitatory cells for uncrossed disparities, near cells and far cells (Cumming & DeAngelis, 2001).
! >@!
Figure III.7 | Six types of tuning function of disparity detectors. Three types of symmetrical tuned excitatory cells: at zero, crossed, uncrossed. One type of symmetrical tuned inhibitory cell. Two types of asymmetrical near or far cells with broad selectivity. (adapted from Poggio et al., 1985).
This clustering into distinct tuning types was later challenged by other electrophysiological recordings showing a continuous distribution of disparity selectivity (Prince, Cumming & Parker, 2002).
Even though a majority of neurons in the area V1 of the monkey have a preferred disparity, disparity information then undergoes complex transformations in higher visual areas.
3.2 From V1 to V2
There is a body of evidence suggesting that disparity information undergoes a first step of transformations when travelling from V1 to V2. For example, it is hypothesized that V2 is specialized in detecting depth steps and disparity-defined edges (Bredfeldt & Cumming, 2006). While the activity of V1’s binocular cells in the monkey appears to be driven exclusively by absolute disparity (Cumming, 1999), some cells in V2 are selective for relative disparity across a range of absolute disparities.
n
e
u
ra
l a
ct
iv
it
y
depth
fixation point tuned inhibitory tuned exitatory at zero near far tuned exitatory crossed tuned exitatory uncrossed! >L! Another study has reported significant choice probabilities in V2 but not V1 in a depth discrimination task (Nienborg & Cumming, 2006). These three examples strongly support the idea that V2 plays a central role in the transformation of binocular disparity into depth information.
3.3 Disparity in the ventral and dorsal streams
Psychophysics, physiology and imaging have now come the consensus that, beyond V2, the processing of disparity is segregated into two main streams that are thought to carry out different types of stereo computation (Fig. III.8): the ventral
stream (areas from V4 through the inferior temporal cortex) and the dorsal stream
(areas MT/V5 and MST) (Parker, 2007). This distinction would reflect the specialization of each stream for more general tasks. The ventral stream would be involved in object identification while the dorsal stream would underlie orientation in space and navigation (Goodale & Milner, 1992).
Figure III.8 | Stereovision in the dorsal and ventral pathways. The figure shows a diagrammatic picture of the macaque monkey cortical areas, in which the main flow of visual information through the dorsal and ventral visual pathways is identified by arrows. The ventral visual areas are highlighted with horizontal ellipses of red/orange tints, and the dorsal visual areas are highlighted with vertical ellipses of blue/purple
! >C!
tints. The early visual areas V1 and V2 are highlighted with neutral grey circles. CIP, caudal intraparietal area; FST, fundal superior temporal area; IT, inferior temporal cortex; MST, medial superior temporal area; MT, medial temporal area; PO, parietooccipital area; PP, posterior parietal cortex; STP, superior temporal polysensory area; TEs, a collection of areas in the anterior inferior temporal cortex. (adapted from Parker, 2007).
Using adaptation and fMRI on humans, Neri, Bridge & Heeger (2004) provided the first evidence of a two-stream dichotomy in humans. They showed that disparity processing relied more on absolute disparity in the dorsal stream while both types of disparity information were preserved in the ventral stream. Inconsistent with Neri and colleagues’ findings, Preston, Li, Kourtzi & Welchman (2008) showed that dorsal areas encode disparity magnitude while ventral areas encode disparity sign. Alternatively, these authors suggest that disparity in the ventral stream (area LO) might be used to encode depth configurations and support invariant recognition of objects across different positions in depth. In the dorsal stream, disparity magnitude in areas V3A and V7 might support fine control of body movements while pattern based tuning in hMT+ might be consistent with coarse depth discriminations. Even though the results from Neri et al. and Preston et al. are consistent with a dual pathway dichotomy, they remain conflicting.
3.3.1 The ventral stream
Janssen, Vogels & Orban (2000) provided the first electrophysiological evidence of a specialization for the extraction of 3D shape from disparity in a subregion of the inferior temporal cortex. This finding was backed up by studies showing that the inferior temporal cortex is specifically sensitive to fine depth variations (Uka, Tanabe, Watanabe, & Fujita, 2005). Janssen and colleagues also demonstrated that sensitivity to anticorrelated stereograms (see chapter V, section 1.1.2.1, Fig. V.2) (Cumming & Parker, 1997), found in V1 and MT/V5 & MST was completely abolished in a subregion of the inferior temporal cortex called TE, implying that the correspondence problem is fully solved in the ventral stream (Janssen, Vogels, Liu, & Orban, 2003).
! AG!
3.3.2 The dorsal stream
The dorsal stream is sensitive to anticorrelated stereograms, suggesting a less elaborated computation of binocular correlation (Janssen et al., 2003). However, electrophysiological recordings in the area MST of monkeys demonstrated that this region plays a central role in driving vergence eye movements. The MT complex has been shown to process motion and disparity (Maunsell & Van Essen, 1983) and more specifically to extract motion-in-depth from changes of disparity over time (Rokers, Cormack, & Huk, 2009) (see chapter V, section 1 for a detailed review on motion-in-depth).
3.3.3 Bridges between the ventral and the dorsal streams
To complement Janssen and colleagues’ (Janssen et al., 2000) electrophysiological recordings on the monkey, Chandrasekaran, Canon, Dahmen, Kourtzi & Welchman (2007) measured the correlation between cortical activity (recorded by fMRI) and psychophysical shape judgments. They found that this task was associated with both ventral and dorsal areas, suggesting that the two streams interact to build percepts of 3D shape.
4
Modelling
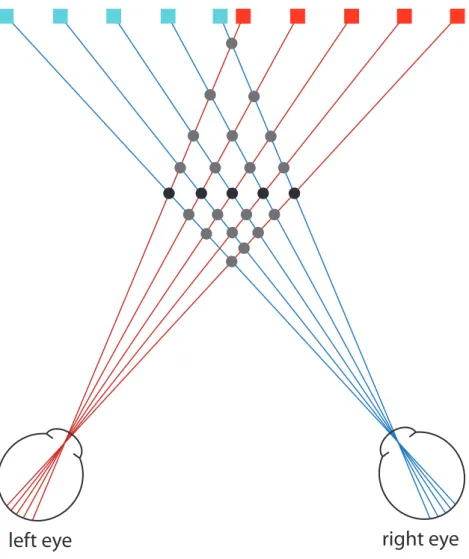
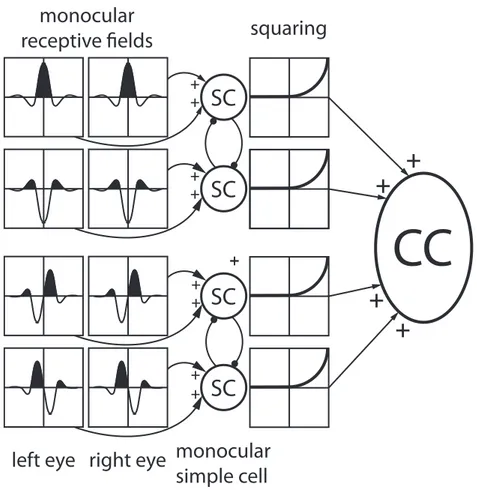
The challenge for computational models of stereoscopic vision is to be able to determine which parts of an image correspond to which parts of another image. This complex issue is called the correspondence problem (Fig. III.9). Solving the correspondence problem is theoretically the most complex when dealing with RDSs since these images are free of any relevant information other than binocular disparity. In this section, we will focus on the wiring of simple and complex cells of the cat and monkey primary visual cortex.
! A:!
4.1 Solving the correspondence problem with Marr’s computational
approach
Using Julesz’s RDS as a case study, Marr and Poggio (1979; 1976) developed an algorithm capable of extracting depth from binocular disparity. The authors constrained matching solutions by applying the constraints based on the physical properties of the world. To account for the fact that “disparity varies smoothly almost everywhere”, they introduced a smoothness constraint (or continuity rule). Because any point has a unique position in space, the uniqueness constraint states that “each item from each image may be assigned at most one disparity value”. Finally, corresponding points must have similar brightness or colour (compatibility constraint). A recent physiological study (Samonds, Potetz, & Lee, 2009) demonstrated the existence of local competitive and distant cooperative interactions in the primary visual cortex of the macaque, via lateral connections. These authors suggested that local competition could be the neural substrate of the uniqueness rule while distant cooperation would favour the detection of similar disparities and therefore implement the continuity rule.