UNIVERSITÉ DE MONTRÉAL
TEXTURE ANALYSIS OF LATE GADOLINIUM ENHANCED CARDIAC MAGNETIC RESONANCE IMAGES
FOR CHARACTERIZING MYOCARDIAL FIBROSIS AND INFARCTION
PASCALE BÉLIVEAU
INSTITUT DE GÉNIE BIOMÉDICAL ÉCOLE POLYTECHNIQUE DE MONTRÉAL
THÈSE PRÉSENTÉE EN VUE DE L’OBTENTION DU DIPLÔME DE PHILOSOPHIAE DOCTOR
(GÉNIE BIOMÉDICAL) FÉVRIER 2017
UNIVERSITÉ DE MONTRÉAL
ÉCOLE POLYTECHNIQUE DE MONTRÉAL
Cette thèse intitulée :
TEXTURE ANALYSIS OF LATE GADOLINIUM ENHANCED CARDIAC MAGNETIC RESONANCE IMAGES
FOR CHARACTERIZING MYOCARDIAL FIBROSIS AND INFARCTION
présentée par : BÉLIVEAU Pascale
en vue de l’obtention du diplôme de : Philosophiae Doctor a été dûment acceptée par le jury d’examen constitué de : M. VINET Alain, Ph. D., président
Mme CHERIET Farida, Ph. D., membre et directrice de recherche M. HSU Li-Yueh, Ph. D., membre et codirecteur de recherche M. ARAI Andrew, MD, membre et codirecteur de recherche M. DESCHÊNES Sylvain, Ph. D., membre
DEDICATION
To my husband Samuel for his support, my kids Alessia and David who put sunshine and joy in my studies, my father Jacques and Mamie Solange, forever with me.
ACKNOWLEDGEMENTS
I would like to first thank my director, Prof. Farida Cheriet and my co-directors, Li-Yueh Hsu and Dr. Andrew Arai, for their support, guidance and knowledge. I have learned a lot under their supervision and am grateful for the opportunities that were provided to me. Their advice, all along my PhD studies, has made me work hard to achieve my goals. They have always been supportive of my work and understanding in the personal challenges I encountered during my studies.
Thank you to everyone at the lab at the NHLBI that welcomed me and shared their knowledge with me. It was a pleasure to be part of their team and I am grateful for having had the opportunity of being part of such a dynamic and knowledgeable group. Thank you as well to the Graduate Partnership Program, to its members who were very supportive and understanding. Their availability and the resources that they provide added value to my experience at NIH.
Thank you to the members of the LIV4D lab at École Polytechnique of Montreal. Although I was sporadically present, I always felt part of the group. Thank you to Philippe Debanné for his support and availability.
A special and fond thank you to my parents, Jacques and Solange, who no doubt loved me and gave me opportunities to succeed. Papa, although you have left me too soon, I always kept your memory with me, following you to your lab when school was out. Maman, this Ph.D. is for you. You have inspired me in so many ways, with your own studies and quest for knowledge. You have guided and assisted me in pursuing my Ph.D. and you became an incredible grandmother while doing it. You were at my side, always supportive and I am eternally grateful for all you have done for me.
I would like to thank my in-laws, Dominique and Morris, along with Martin and Melissa. I couldn’t ask for a better family. They have been at my side, always supportive. A special thank you to my daughter Alessia and my son David, although you added challenge to my studies, you also added sunshine to my days by making me smile.
And finally but not least, thank you to my husband Samuel, who was by my side throughout this long journey, who never let me back down and pushed me to succeed. He was supportive as we shared life changing events during my Ph.D.
RÉSUMÉ
Le tiers de la population aux États-Unis est affecté par des cardiomyopathies. Lorsque le muscle du cœur, le myocarde, est altéré par la maladie, la santé du patient est détériorée et peut même entrainer la mort. Les maladies ischémiques sont le résultat d’artères coronariennes bloquées (sténose), limitant l’apport sanguin vers le myocarde. Les cardiomyopathies non-ischémiques sont les maladies dues à d’autres causes que des sténoses. Les fibres de collagène (fibrose) s’infiltrent dans le muscle cardiaque dans le but de maintenir la forme et les fonctions cardiaques lorsque la structure du myocarde est affectée par des cardiomyopathies. Ce principe, nécessaire au fonctionnement du cœur en présence de maladies, devient mal adapté et mène à des altérations du myocarde aux conséquences négatives, par exemple l’augmentation de la rigidité du myocarde. Une partie du diagnostic clinique lors de cardiomyopathies consiste à évaluer la fibrose dans le cœur avec différentes modalités d’imagerie. Les fibres de collagène s’infiltrent et s’accumulent dans la zone extracellulaire du myocarde ou peuvent remplacer progressivement les cardiomyocytes compromises. L’infiltration de fibrose dans le myocarde peut possiblement être réversible, ce qui rend sa détection particulièrement importante pour le clinicien.
Différents tests diagnostiques existent pour aider le clinicien à établir l’état du patient en présence de cardiomyopathies. L’imagerie par résonance magnétique (IRM) est une modalité d’imagerie qui offre une haute résolution pour la visualisation du myocarde. Parmi les séquences disponibles avec cette modalité, l’imagerie par rehaussement tardif (RT) augmente le contraste du signal existant entre les tissus sains et les tissues malades du myocarde. Il s’agit d’images en pondération T1 avec
administration d’agent de contraste qui se propage dans la matrice extracellulaire et résulte en un rehaussement du signal à cet endroit. Les images IRM RT permettent d’évaluer la présence et l’étendue des dommages au myocarde. Le clinicien peut évaluer la sévérité des cardiomyopathies et poser un pronostique à l’aide de ces images. La détection de fibrose diffuse dans ces images peut informer le clinicien sur l’état du patient et est un important marqueur de cardiomyopathies. Il est important d’établir l’occurrence de l’infarctus en présence de maladies ischémiques. En effet, l’approche interventionnelle varie selon que le clinicien fait face à une ischémie aigue ou chronique. Lors du diagnostic, Il serait donc bénéfique de différencier les infarctus du myocarde aigu de ceux chronique. Ceci s’est avéré difficile à l’aide des images IRM RT où l’intensité du signal ou la taille des régions sont similaires dans les deux types d’ischémie.
Le but de la présente thèse est donc d’appliquer les méthodes d’analyse de texture à des images IRM RT afin de détecter la présence de fibrose diffuse dans le myocarde et de plus de déterminer l’âge de l’infarctus du myocarde. La première étude portait sur la détection de fibrose diffuse dans le myocarde à l’aide de l’analyse de texture appliquée à des images IRM RT afin d’établir si un lien existe entre la variation du signal d’intensité et la structure sous-jacente du myocarde. La présence de collagène dans le myocarde augmente avec l’âge et nous avons utilisé un modèle animal de rats jeunes et âgés. Nous avons fait une étude ex-vivo afin d’obtenir des images IRM RT de haute résolution avec absence de mouvement et ainsi permettre une comparaison des images avec des coupes histologiques des cœurs imagés. Des images IRM RT ont été acquises sur vingt-quatre animaux. Les coupes histologiques ont été traitées avec la méthode utilisant un marqueur ‘picrosirius red’ qui donne une teinte rouge au collagène. La quantification de la fibrose obtenue avec les images IRM RT a été comparée à la quantification obtenue sur les coupes histologiques. Ces quantifications ont de plus été comparées à l’analyse de texture appliquée aux images IRM RT. La méthode de texture a été appliquée en créant des cartes de texture basées sur la valeur de
Contraste, cette mesure étant obtenue par des calculs statistiques sur la matrice de cooccurrence.
Les régions montrant une plus grande complexité de signal d’intensité sur les images IRM RT ont été rehaussées avec les cartes de textures. Un calcul de régression linéaire a permis d’étudier le lien entre les différentes méthodes de quantification. Nous avons trouvés que la quantification de fibrose dans le myocarde à l’aide de l’analyse de texture appliquée sur des images IRM RT concordait avec le niveau de collagène identifié avec les images IRM et avec les coupes histologiques. De plus, nous avons trouvés que l’analyse de texture rehausse la présence de fibrose diffuse dans le myocarde.
La seconde étude a pour but de discriminer les infarctus aigus du myocarde de ceux qui sont chroniques sur des images IRM RT de patients souffrant de cardiomyopathies ischémiques. Vingt-deux patients ont subi l’imagerie IRM (12 avec infarctus aigu du myocarde et 12 avec infarctus chronique). Une segmentation des images a permis d’isoler les différentes zones du myocarde, soit la zone d’infarctus, la zone grise au rebord de l’infarctus et la zone du myocarde sain, dans les deux groupes de patients. L’analyse de texture s’est faite dans ces régions en comparant les valeurs obtenues dans les deux groupes. Nous avons obtenu plus de valeurs de texture discriminantes dans la zone grise, en comparaison avec la région du myocarde sain, où aucune valeur de texture n’était significativement différente, et à la zone d’infarctus, où seule la valeur de texture statistique
Moyenne était différentes dans les deux groupes. La zone grise a déjà fait l’objet d’études ayant
établis cette région comme composée de cardiomyocytes sains entremêlés avec des fibres de collagène. Notre étude montre que cette région peut exhiber des différences structurelles entre les infarctus aigus du myocarde et ceux qui sont chroniques et que l’analyse de texture a réussi à les détecter.
L’étude de la présence de collagène dans le myocarde est importante pour le clinicien afin qu’il puisse faire un diagnostic adéquat du patient et pour qu’il puisse faire un choix de traitement approprié. Nous avons montrés que l’analyse de texture sur des images IRM RT de patients peut différencier et même permettre la classification des ischémies aigues des ischémies chroniques, ce qui n’était pas possible avec uniquement ce type d’images. Nous avons de plus démontrés que l’analyse de texture d’images IRM RT permettait d’évaluer le contenu de fibrose diffuse dans un modèle animal de haute résolution avec validation histologique. Une telle relation entre les résultats d’analyse de texture d’images IRM RT et la structure sous-jacente du myocarde n’avait pas été étudiée dans la littérature.
Notre méthode pourra être améliorée en effectuant d’autres calculs statistiques sur la matrice de cooccurrence, en testant d’autres méthodes d’analyse de texture et en appliquant notre méthode à de nouvelles séquences d’acquisition IRM, tel les images en pondération T1. D’autres
améliorations possibles pourraient porter sur une évaluation de matrice de cooccurrence avec voisinage circulaire suivant la forme du myocarde sur les tranches d’images IRM RT. Plusieurs matrice de cooccurrence pourraient aussi être évaluées en fonction de la position dans l’espace du voisinage afin d’intégrer une composante directionnelle dans les calculs de texture. D’autres études sont nécessaires afin d’établir si une analyse de texture des images IRM RT pourrait différencier le stade de la fibrose pour un même patient lors d’une étude de suivi. De même, d’autres études sont nécessaires afin de valider l’utilisation de texture sur des scanners IRM différents. Établir l’âge de l’infarctus du myocarde permettra de planifier les interventions thérapeutiques et d’évaluer le pronostique pour le patient.
ABSTRACT
A third of the United States population is affected by cardiomyopathies. Impairment of the heart muscle, the myocardium, puts the patient’s health at risk and could ultimately lead to death. Ischemic cardiomyopathies result from lack of blood (ischemia) reaching the myocardium from blocked coronary arteries. Non-ischemic cardiomyopathies are diseases from other etiology than ischemia. Often collagen fibers infiltrate the heart (fibrosis), as a means to maintain its shape and function in the presence of disease that affects the myocardial cellular structure. This necessary phenomenon ultimately becomes maladaptive and results in the heart’s impairment. Part of the heart’s involvement in disease can be assessed through the analysis of myocardial fibrosis. Cardiomyopathy diagnosis involves the investigation of the presence of myocardial fibrosis, either infiltrative, defined as the increased presence of collagen protein in the extracellular space, or replacement fibrosis, when collagen fibers progressively replace diseased cardiomyocytes. The infiltrative fibrosis is believed to be reversible in some instances and consequently, myocardial fibrosis analysis has decisional impact on the interventional procedure that would benefit the health of the patient. The heart contracts and relaxes as it pumps blood to the rest of the body, an action directly impaired by myocardial damage. Any myocardial involvement should be assessed by the clinician to identify the severity of the myocardial damage, establish a prognosis and plan therapeutic intervention.
Different diagnostic tests are required to image the myocardium and help the clinician in the diagnostic process. Cardiac magnetic resonance (CMR) imaging has emerged as a high resolution imaging modality that offers precise structural analysis of the heart. Among the different imaging sequences available with CMR, late gadolinium enhancement (LGE) shows the myocardium and enhances any impairments that may exist with the use of a contrast agent. It is a T1-weighted image
with extracellular contrast agent (CA) administration. Increased signal intensity in the infarct scar is created from the CA dynamics. LGE CMR imaging offers information on the scar size and its location. The clinician can estimate the severity of the disease and establish prognosis with LGE CMR images.
In ischemic cardiomyopathy, it is important to establish the occurrence of the infarction and know the age of the infarct to plan surgical intervention. Differentiation of acute from chronic MI is therefore important in the diagnostic process. In LGE CMR the level of signal intensity or the size
of infarction are both similar in acute or in chronic MI. It has therefore been challenging to distinguish acute MI from chronic MI scars with LGE CMR images alone.
The aim of this thesis was to investigate texture analysis of LGE CMR images to determine if acute MI could be distinguished from chronic MI and to detect increased presence of diffuse myocardial fibrosis in the myocardium. The first study was performed to investigate if texture analysis of LGE CMR images could detect variations in the presence of diffuse myocardial fibrosis and if the underlying myocardial structure could be related to the texture measures. Collagen content increased with aging and we used an animal model of young versus old rat. An ex-vivo animal model was necessary to allow for higher image resolution in LGE CMR images and to perform validation of our texture measures with histology images. Twenty four animals were scanned for LGE CMR images and texture analysis was applied to the heart images. Histology slices were stained with picrosirius red and collagen fibers were isolated based on their color content. LGE CMR quantification was compared to histological slices of the heart stained with the picrosirius red method. Texture analysis of LGE CMR images was also compared to the original LGE CMR image quantification and to histology. Texture analysis was done by creating contrast texture maps extracted from Haralick’s gray level co-occurrence matrix (GLCM). Regions of complex signal intensity combination were enhanced in LGE CMR images and in contrast texture maps. Regression analysis was performed to assess the level of agreement between the different analysis methods. We found that LGE CMR images could assess the different levels of collagen content in the different aged animal model, and that moreover texture analysis enhanced those differences. The location of enhancement from texture analysis images corresponded to location of increased collagen content in the old compared to the young rat hearts. Histological validation was shown for texture analysis applied to LGE CMR images to assess myocardial fibrosis.
Our second study aimed at discriminating acute versus chronic MI from LGE CMR patient images alone through the use of texture analysis. Twenty two patients who had LGE CMR images were included in our study (12 acute and 12 chronic MI). Regional segmentation was performed and texture features were compared in those regions between both groups of patient. Texture analysis resulted in significantly different values between the two groups. More specifically the peri-infarct zone had the most number of discriminative features compared to the remote myocardium which had none and to the infarct core where only the mean features was significantly different. The border zone has been shown to be composed of healthy cardiomyocytes intermingled with the
scar’s collagen fibers. Our study indicates this region might exhibit structural differences in the myocardium in acute from chronic MI patients that texture analysis of LGE CMR images can detect.
Characterization of myocardial collagen content is important while clinicians analyze the state of the patient since it influences the course of action required to treat cardiomyopathies. LGE CMR images have been thoroughly used and validated to characterize focal myocardial scar, however it was limited in characterizing the age of infarction or quantifying diffuse collagen content. We have shown texture analysis of LGE CMR images alone can differentiate and even classify, acute from chronic MI patients, which was not previously possible. Characterization of myocardial infarction according to age will prove important in planning therapeutic interventions in clinical practice. Moreover, we have established texture analysis as a means to characterize the myocardium and detect variation in fibrosis content from high resolution LGE CMR images with histology validation. To our knowledge, such a relation between texture analysis of LGE CMR images and the underlying myocardial structure had not been done previously.
Improvements could be done to our method, as we can increase the number of texture features that were analyzed from the GLCM, include other texture analysis methods such as the run-length matrix, and apply our method to other CMR imaging sequences such as T1 mapping. Adapting the
GLCM to the heart could also be investigated, such as considering circular GLCM computation to consider the round shape of the myocardium in the short axis LGE CMR image slices. Directional GLCM could also be computed individually and analyzed for any myocardial or collagen fiber orientation indication. Further analysis is also required to establish if texture analysis could differentiate the age of MI in the same individual through a follow-up study. The measures of texture analysis from LGE CMR images obtained through different CMR scanners remains to be investigated as well. Knowing the age of infarct and evaluating the presence of diffuse myocardial fibrosis will help the clinician plan therapeutic interventions and establish a prognosis for the patient.
TABLE OF CONTENTS
DEDICATION ………. ... III ACKNOWLEDGEMENTS ... IV RÉSUMÉ……….. ... V ABSTRACT…… ... VIII TABLE OF CONTENTS ... XI LIST OF TABLES ... XV LIST OF FIGURES ... XVI LIST OF SYMBOLS AND ABBREVIATIONS... XXINTRODUCTION ... 1
LITTERATURE REVIEW ... 5
2.1 Background ... 5
2.1.1 Physiology of the healthy heart ... 5
2.1.2 Pathophysiological Changes from Cardiomyopathies ... 7
2.1.3 LGE CMR Image Acquisition ... 9
2.1.4 LGE CMR Imaging of Cardiomyopathies ... 10
2.2 Texture Analysis in Medical Imaging ... 15
2.2.1 Structural Methods ... 16
2.2.2 Model based Methods ... 16
2.2.3 Statistical Methods ... 17
2.2.4 Transform Methods ... 19
2.3 Texture Analysis in Cardiology ... 20
2.3.1 Ischemic cardiomyopathy Imaging ... 20
2.4 Texture Analysis of Fibrosis from other Imaging Modalities ... 25
2.5 Medical Image Classification ... 26
2.5.1 General Classification Methodology ... 26
2.5.2 Classifiers ... 27
HYPOTHESES AND OBJECTIVES ... 31
3.1 Hypotheses and Objectives ... 32
3.2 Objectives ... 32
3.3 General methodology ... 33
ARTICLE 1: QUANTITATIVE ASSESSMENT OF MYOCARDIAL FIBROSIS IN AN AGE-RELATED RAT MODEL BY EX VIVO LATE GADOLINIUM ENHANCEMENT MAGNETIC RESONANCE IMAGING WITH HISTOPATHOLOGICAL CORRELATION ... 35 4.1 Presentation ... 35 4.2 Abstract ... 35 4.3 Introduction ... 36 4.4 Methods ... 38 4.4.1 Animal Model ... 38 4.4.2 Image Acquisition ... 38 4.4.3 Histology ... 39 4.4.4 Image Analysis ... 39 4.4.5 Statistical Analysis ... 43 4.5 Results ... 43 4.5.1 Histology Analysis ... 44
4.5.2 LGE CMR and Texture Analysis ... 44
4.7 Conclusion ... 56
4.8 Acknowledgements ... 57
ARTICLE 2: EXPLORATION OF TEXTURE ANALYSIS OF LATE GADOLINIUM ENHANCED CARDIOVASCULAR MAGNETIC RESONANCE IMAGING TO DISCRIMINATE ACUTE VERSUS CHRONIC MYOCARDIAL INFARCTION IN PATIENTS…….. ... 58 5.1 Presentation ... 58 5.2 Abstract ... 58 5.3 Background ... 59 5.4 Methods ... 61 5.4.1 MRI Acquisition ... 61 5.4.2 Image Analysis ... 62 5.5 Results ... 68 5.6 Discussion ... 75 5.7 Limitations ... 76 5.8 Conclusion ... 77
CLASSIFICATION OF ISCHEMIC CARDIOMYOPATHIES ... 78
6.1 Acute Versus Chronic MI Classification ... 78
6.1.1 Classification Method ... 78
6.1.2 Classification Results ... 79
6.1.3 Discussion ... 82
GENERAL DISCUSSION AND FUTURE DIRECTIONS ... 85
7.1 Texture Analysis of Diffuse Myocardial Fibrosis in LGE images ... 85
7.2 Texture Analysis of Myocardial Infarction in LGE images ... 87
BIBLIOGRAPHY ... 95
LIST OF TABLES
Table 4-1 : The discrimination between the elderly and the young rat hearts is improved with the contrast texture maps quantification using 3SD to 6SD thresholds when compared to the LGE CMR images. The amount of myocardial fibrosis estimation is expressed in %LV. ... 52 Table 5-1: Description of texture features. Description of the eight texture features from Haralick [104] computed from the GLCM. ... 67 Table 5-2: P-value from the Wilcoxon U test. P-value from the
Mann-Whitney-Wilcoxon U test were evaluated for the eight Haralick texture features computed from the peri-infarct (PI), myocardial infarction (MI) and the remote myocardium region of interest comparing the acute versus the chronic MI patient groups. The p-value is also shown for comparing the size of all three regions (PI, MI and remote) in the two groups. Significantly different texture features are identified with asterisks (* p≤0.05; ** p≤0.01; *** p≤0.001). 71 Table 5-3 : AUC from ROC Analysis. The area under the curve (AUC) for each of the computed texture features in the peri-infarct (PI), the myocardial infarction (MI) and the remote region for the acute versus the chronic MI patient groups. The homogeneity, the dissimilarity and the
contrast and the correlation texture features have the highest AUC. Significantly different
texture features are identified with asterisks (* p≤0.05; ** p≤0.01; *** p≤0.005). ... 72 Table-6-1: Eigen values and percent variance per PCA components. ... 79 Table-6-2: Classification rate (%) with texture features obtained from the GLCM matrix built with d=1, with all features or with a specified number of PCA components... 80 Table-6-3: Classification rate (%) with texture features obtained from the GLCM matrix built with d=2, with all features or with a specified number of PCA components... 81 Table 6-4: Classification rate (%) with texture features obtained from the GLCM matrix built with d=3, with all features or with a specified number of PCA components... 82
LIST OF FIGURES
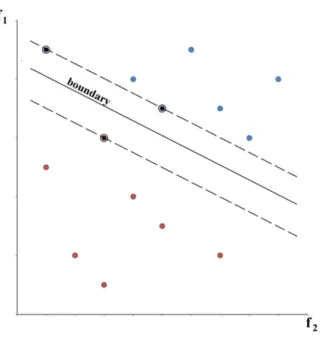
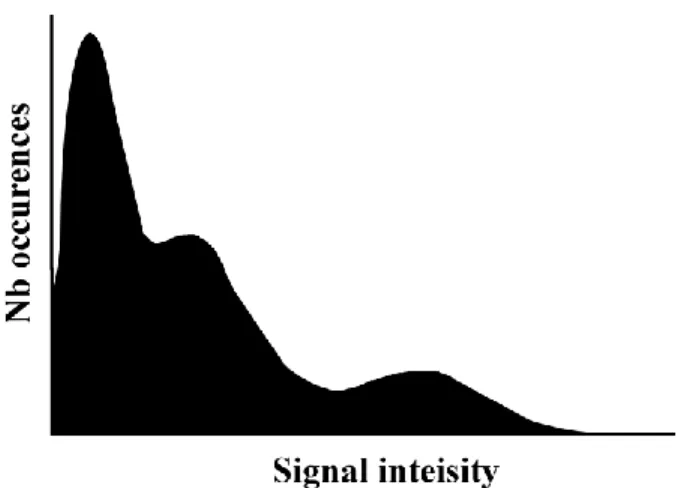
Figure 2-1 : The heart and its four chambers. The blood flows from one atria to its adjacent ventricle, which releases the blood to other anatomical parts of the body [28]. ... 6 Figure 2-2 : The response to myocardial injury is an increase of inflammatory cells that include neutrophil and macrophages, amongst others. In acute myocardial infarction there is degradation of collagen fibers that is followed by increase of collagen synthesis to eventually form fibrosis. ... 8 Figure 2-3 : Schematic representation of an LGE CMR image of a patient with acute MI (left). Example images to the right show an acute MI (top image) and a chronic MI (bottom image) LGE CMR patient image. The acute MI image shows macrovascular obstruction (MVO) as an island of dark signal intensity in the bright infarct region (red outline). The remote myocardium is nulled and outlined in green. The peri-infarct zone is seen as lighter shades of gray that surrounds the infarct region. ... 11 Figure 2-4 : Schematic representation of typical enhancement in LGE CMR images. The subendocardial and transmural locations of enhancement are seen in ischemic cardiomyopathies. The midwall, subepicardial and patchy enhancements are seen in non-ischemic cardiomyopathies. ... 14 Figure 2-5 : Schematic signal intensity distribution in the myocardium from an LGE CMR image. The leftmost and highest signal distribution in the histogram corresponds to the background of the segmented image. The central distribution represents signal intensities in the myocardium and the trail of signal intensity distribution to the right would correspond to signal intensity in the myocardial infarcted region. ... 21 Figure 2-6: Diagram of the different computations involved in texture analysis and classification [187]. A pre-processing step prepares the images to extract the texture features that will be selected to perform classification. Validation of the results is sometimes done simultaneously as the classification step with the cross-validation or leave-one-out methods. ... 26 Figure 2-7 : Support vector machine conceptual representation. The support vectors are identified with the black dots. The dashed lines are positioned at a maximal distance between the boundary and the support vectors. Image inspired from Duda, Hart, Stork [188]. ... 29
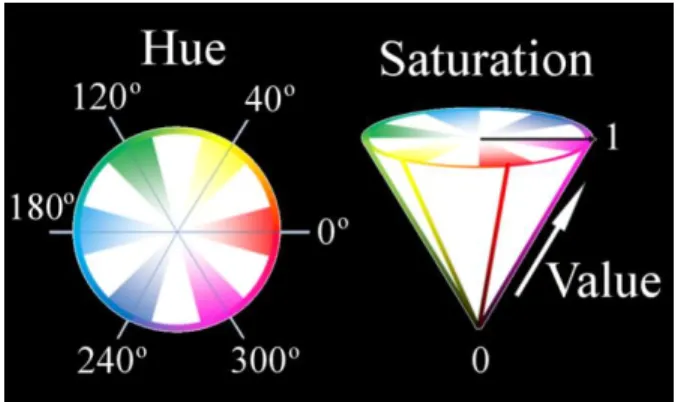
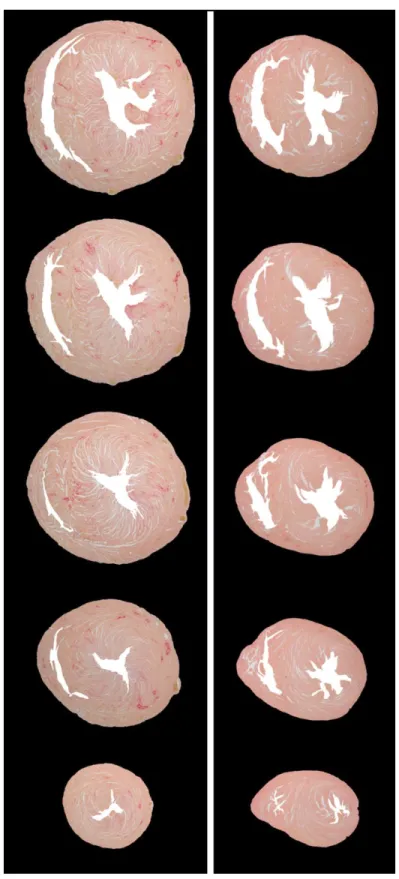
Figure 4-1 : Schematic representation of the color transformation from the RGB to the HSV space. ... 39 Figure 4-2 : 3D pixel-wise texture map is obtained by computing the GLCM for every pixel in the myocardial region. To derive the GLCM with a spatial distance of one, neighboring pixel pairs in thirteen directions (red arrow) are compared per pixel. The probability of occurrence of signal intensity pairs in a 3x3x3 neighbor region surrounding a position was computed to construct the GLCM for each direction. The final texture value for each pixel is obtained by averaging the contrast feature computed from the thirteen GLCMs. ... 42 Figure 4-3 : Picrosirius red-stained histology images show an increase of collagen content (stained red) in the elderly rat (left) compared to the young rat (right). ... 45 Figure 4-4 : Magnification of a picrosirius red-stained histology slice from an elderly rat heart showing (a) interstitial and (b) perivascular fibrosis. Diffuse interstitial fibrosis appears as an intermingling of pink-salmon color healthy cardiomyocytes and red-stained collagen fibers. ... 46 Figure 4-5 : Segmentation of the histology slices was done after transforming the RGB channels into HSV color space. The illuminance variation of the image can be clearly seen in the V channel of the decomposed HSV images. The magnified picrosirius red-stained histology image shows our segmentation can depict detailed red-color collagen content in the myocardium. ... 46 Figure 4-6 : The appearance of collagen fibers in an elderly rat histology slices (top) matches well with the signal enhanced regions in the LGE CMR images (middle) and the corresponding
contrast texture images (bottom). Regions of interstitial diffuse myocardial fibrosis identified
in histology (white arrows) are enhanced in the matched LGE CMR and contrast texture images. Perivascular myocardial fibrosis in histology (black arrows) was also enhanced in LGE CMR and in the contrast texture image. The corresponding contrast texture images show a further increased signal enhancement in locations of myocardial fibrosis. ... 47 Figure 4-7 : The appearance of collagen fibers in a young rat histology slices (top) also matches closely with the signal enhancement in the LGE CMR images (middle) and contrast texture images (bottom). However, there are fewer amounts of collagen fibers compared to the elderly rat in Figure 4-6, and they appeared primarily in the perivascular regions (black arrows). .. 48
Figure 4-8 : Example of myocardial fibrosis quantification in histology (left), segmented LGE CMR (middle), and segmented contrast texture (right) images. The bottom row shows there is a high, but not complete, correspondence of signal enhanced pixels between CMR and the
contrast texture images as quantified by different SD thresholds. There was a slight over
segmentation in the lumen area of the LGE CMR and the contrast texture images when compared to histology due to residual contrast in the lumen. ... 49 Figure 4-9 : Myocardial collagen content in the elderly versus young rats as estimated by various standard deviation (SD) thresholds from LGE CMR (left) and contrast texture (right) images. Dashed lines show collagen estimation from the matched histology references. The optimal threshold values for LGE CMR were obtained with the 3 SD threshold and with the 4 SD for the contrast texture images. ... 50 Figure 4-10 : Collagen estimation with the 3 SD threshold for LGE CMR images (left) and the 4 SD threshold for the contrast texture images (right) compared to the histology quantification. Linear regression and Bland-Altman analysis showed excellent correlation without significant bias for both LGE CMR and contrast texture images. Dashed lines indicate mean ± two standard deviation in the Bland-Altman analysis ... 51 Figure 5-1: Schematic representation of the three myocardial regions of interest segmentations. The whole myocardial region was manually traced on epicardial and endocardial border of the LV (blue circles). The myocardial infarction (MI) including the peri-infarct (PI) zone, here drawn in gray (MI+PI), was determined with a 2SD threshold. The MI region, drawn in magenta, was determined with the full width at half maximum threshold using an automated sizing program. The PI zone, drawn in yellow, was obtained from the difference ( ) between the MI+PI and the MI zone. The remote myocardium, drawn in green, was obtained from the difference of the whole myocardial region minus the MI+PI zone... 63 Figure 5-2 : Diagram of a gray level co-occurrence matrix (GLCM). This illustration shows the probability (𝑃𝑖, 𝑗) of occurrence that a central pixel with signal intensity 𝑖 will be neighboring a pixel with signal intensity 𝑗. The diagonal of the GLCM matrix (shaded in gray in the diagram image) indicates if the same signal intensity is found around the central pixel analyzed and its neighbors. If all entries of the GLCM are found on the diagonal, this indicates a uniform region in the image. The further away an entry is off the diagonal (red dots in the
GLCM) the higher the signal intensity difference will be between the two pixels. Positions closest to the diagonal indicate small intensity variation between a pixel and its neighbors (blue dots in the GLCM). ... 65 Figure 5-3 : Example LGE CMR images of an acute and a chronic MI patient. The original LGE CMR image is shown next to the myocardial segmentation. The magenta area identifies the myocardial infarction (MI) area, the yellow shows the peri-infarct (PI) zone and the green identifies the remote myocardium. It is difficult to visually assess the difference in SI between the acute and the chronic MI patients. However, there was a more uniform SI variation in the PI zone of the acute patient, as compared with a more complex signal intensity variation as measured with the texture features in the PI zone of the chronic patient. ... 69 Figure 5-4: Comparison of texture features in the three myocardial regions. The box plots shows the normalized values of different texture features in the peri-infarct (PI), the myocardial infarction (MI) and the remote region between the acute and the chronic MI patients. The features from the PI region show the most separation between the two groups of patients. Significantly different texture features are identified with asterisks (* p≤0.05; ** p≤0.01; *** p≤0.001). ... 74
LIST OF SYMBOLS AND ABBREVIATIONS
AUC Area under the curve ANN Artificial neural network
CA Contrast agent
CMR Cardiac magnetic resonance DCM Dilated cardiomyopathy DTI Diffusion tensor imaging
DTPA Diethylenetriamine pentaacetic acid ECV Extracellular volume
FACT Feature analysis and combined thresholding FWHM Full width at half maximum
Gd Gadolinium
GLCM Gray level co-occurrence matrix GRE Gradient echo
HCM Hypertrophic cardiomyopathy HSV Hue saturation value
ICM Ischemic cardiomyopathy IR Inversion recovery
LBP Local binary pattern
LDA Linear discriminant analysis LGE Late gadolinium enhanced LV Left ventricle
MI Myocardial infarction
NN Nearest neighbor
NS Not significant
PCA Principal component analysis
PI Peri-infarct
PIM Percent infarct mapping
PSIR Phase sensitive inversion recovery RBF Radial basis function
RF Radio frequency
RGB Red green blue RLM Run length matrix ROI Region of interest RT Rehaussement tardif SD Standard deviation SI Signal intensity SNR Signal to noise ratio SVM Support vector machine
CHAPTER 1 INTRODUCTION
Cardiovascular diseases affect more than 1 in 3 adults in the United States [1]. The heart is the main supplier of blood to the rest of the body and any impairment might have life-threatening consequences. Cardiovascular diseases claim more lives than any other diseases in the United States [1] and affect the heart by modifying the cellular structure or global shape of the myocardium (the muscle of the heart). The heart’s function is negatively affected as the myocardium is progressively impaired. Ischemic cardiomyopathies are characterized by lack of blood reaching the myocardium (ischemia) and are caused by an obstruction in the coronary arteries. Other myocardial diseases originate from various etiologies other than ischemia, such as amyloidosis, hypertrophic or dilated cardiomyopathies. A diagnosis is needed to identify the different diseases by analyzing the state of the patient and of the heart in order to perform the appropriate therapeutic intervention. A combination of investigative tests and image analysis will inform the clinician on a patients’ state. The clinician uses diagnostic tests, such as the electrocardiogram or biomarkers such as Troponin for example, to identify specific symptoms associated to types of cardiomyopathies. However, it is with ultrasound or cardiac magnetic resonance (CMR) that the myocardium can be visualized. Ultrasound is less expensive and a rapid imaging modality however CMR offers a higher resolution. Magnetic resonance is therefore used to obtain information on the pathological transformation of the myocardium whenever the precise state of the myocardium has to be established. Late gadolinium enhanced (LGE) CMR is a high resolution imaging method with which the clinician can identify and characterize any damage due to cardiomyopathies. LGE CMR imaging has been thoroughly validated and is used to measure the size and evaluate the severity of myocardial scar in ischemic cardiomyopathy [2]. Such an analysis has prognostic impact for the patient and helps the clinician plan therapeutic interventions. Although LGE CMR offers a high resolution visualization of the myocardium, there are limitations.
LGE CMR images show the location and pattern of enhancement in the presence of non-ischemic cardiomyopathy [3-6]. However, diffuse myocardial fibrosis cannot be quantified with this modality. The enhancements that are seen in LGE CMR are concentrated in a limited but definite location in the myocardium and can easily be isolated from the rest of the myocardium. Diffuse myocardial fibrosis has been identified as a structural alteration to the myocardium in the presence of non-ischemic cardiomyopathies [5] and is widespread in the heart muscle. Although it is crucial
in maintaining the heart’s shape and function in disease, collagen is also responsible for stiffening of the heart and ultimately impairing myocardial function. Quantifying diffuse fibrosis would be beneficial since it was suggested that the early stages of fibrosis can possibly be reversible [7]. LGE CMR images are however limited in diffuse fibrosis characterization in non-ischemic cardiomyopathies, due to the diffusive nature of the myocardial alteration. The standard signal intensity based methods, applying a threshold of a number of standard deviation above the mean signal intensity of the myocardium, are non-applicable since there is no remote myocardium that can be identified, and consequently no threshold value that can be determined [8-11]. It would be beneficial if LGE CMR images alone could allow quantifying diffuse myocardial fibrosis in non-ischemic cardiomyopathy. Research has shown that T1 mapping and extracellular volume (ECV)
CMR imaging methods could show diffuse fibrosis [8-16]. However, it would be beneficial to use an imaging method already used in clinical practice and that has been thoroughly validated such as LGE CMR images. The signal intensity pattern in non-ischemic cardiomyopathies from this modality has frequently been identified with descriptive terms, for example “patchy” or “foci, heterogeneous, multifocal, and non-specific” [17]. These descriptions indicate a complex signal intensity pattern present in LGE CMR images in the presence of diffuse fibrosis, well suited for texture analysis. Consequently, our first contribution consists in applying texture analysis methods to LGE CMR images to characterize diffuse myocardial fibrosis at a high image resolution and to perform a comparison with the ground truth from histology. To our knowledge there has not been any association of texture analysis from LGE CMR images to the presence of diffuse fibrosis in the heart, as assessed with histology images stained with a collagen specific dye.
In ischemic cardiomyopathies, it is not possible to differentiate acute from chronic MI with LGE CMR images alone [18-21]. As more effective interventions are performed following acute myocardial infarction (MI), there is an increased number of patients with chronic MI. Part of the population can live with unrecognized MI, notably for patients with diabetes [22]. Since the age of infarct will have an impact on the decision of the therapeutic intervention to use, it is important for the clinician to distinguish acute from chronic MI scars. The signal intensity based methods that are currently used to segment the infarct scar in LGE CMR images have been unable to characterize the infarct age. Other imaging sequences or modalities have been used for its assessment, exploiting the physiological aspects of the myocardium in pathology, for example by detecting the presence of edema that occurs only in acute MI [18]. However, there is a definite advantage to using a
well-established modality such as LGE CMR images alone during diagnosis and avoiding extra imaging acquisition time. The peri-infarct zone has been described with respect to its heterogeneity, a reference to its appearance in LGE CMR images and an indication of a complex pattern of signal intensity in that region [23-27]. Patterns of signal intensity in medical images have been quantified with texture analysis. Our second contribution consists in characterizing the myocardial infarct age from texture analysis of LGE CMR images for patient with acute or chronic MI. Automatic classification of patients with acute versus chronic myocardial infarction is also desirable. The LGE CMR images are currently useful in characterizing the state of the myocardium, can differentiate ischemic from non-ischemic cardiomyopathies and can be an indication of the type of non-ischemic cardiomyopathy [4]. Classification of LGE CMR images of patients according to the age of the myocardial infarction would be beneficial. Using LGE CMR images to assess the infarct age or quantify diffuse myocardial fibrosis would be beneficial during the diagnosis process to estimate the prognosis for the patient and help the clinician plan therapeutic interventions according to the characterization of fibrosis in the heart.
The research question that is addressed in this thesis consists in the following: Is it possible, relying
only on LGE CMR images, to characterize myocardial fibrosis and ischemic cardiomyopathies, notably differentiate between acute and chronic myocardial infarction? The aim of this study is to
apply quantitative pattern analysis methods to understand how LGE CMR images can objectively assess the state of the myocardium and thus help in the diagnostic process. Texture analysis has never been fully investigated to study the various types of cardiomyopathies as seen in LGE CMR images. This method could help distinguish the underlying microstructure of the heart in the presence of ischemic and non-ischemic heart diseases.
This thesis includes seven chapters and will focus on the exploration of texture analysis as an alternative method to the usual intensity-based methods applied to LGE CMR images. Chapter 2 presents the literature review, briefly explaining the anatomy of the heart and how cardiomyopathies affect the myocardium, then explaining different magnetic resonance imaging methods used in medicine and more specifically in cardiology. It also presents a review of texture analysis and classification methods. In chapter 3, we present our research hypotheses and objectives as well as the general methodology by presenting texture analysis of LGE CMR images to characterize ischemic cardiomyopathies and assess diffuse myocardial fibrosis. Our first published paper is in chapter 4 and presents our investigate work on texture analysis of high
resolution LGE CMR images as a means of identification of diffuse myocardial fibrosis with ground truth validation from histology images. This lays the ground work to use texture analysis of LGE CMR images in cardiac diseases from other etiologies. Chapter 5 contains the second submitted paper that consists in applying texture analysis to LGE CMR images in order to grade myocardial fibrosis as acute or chronic myocardial infarction in a patient population. This part of the project assesses the performance of texture analysis of LGE CMR images in lower resolution images to characterize the underlying structure of the myocardium in a patient population. Initial results for classification of acute versus chronic MI from LGE CMR patient images will be described in chapter 6. The methods, along with the limitations, will be discussed in chapter six. Further considerations that could improve the method and its application are presented in conclusion in chapter 7.
CHAPTER 2 LITTERATURE REVIEW
The background information necessary to understand the work done in this thesis is presented in this chapter. The pathophysiological responses of the myocardium when ischemic or non-ischemic cardiomyopathies occur, along with the imaging methods that are used to view the myocardium, are in the first part of this chapter. Texture analysis methods used in medical imaging are presented in the second part of this chapter. Finally the last section of this chapter presents texture analysis in cardiology, more specifically in ischemic cardiomyopathy or in the presence of diffuse fibrosis in non-ischemic cardiomyopathies.
1.1 Background
1.1.1 Physiology of the healthy heart
The heart is a muscle that is called the myocardium and which forms four chambers, two atria and two ventricles (Figure 0-1). Valves are located between the atria and ventricles to control blood flow. Blood originating from the lungs reaches the left atrium and is pushed to the left ventricle via the mitral valve. The left ventricle then contracts and ejects the oxygen-rich blood to the aorta which supplies it to the rest of the body. Once the blood flows through the organs it releases oxygen and returns to the right atria via the inferior and superior vena cava. Blood then travels to the right ventricle through the tricuspid valve. The right ventricle ejects the deoxygenated blood through the pulmonary artery. The myocardium is supplied oxygenated blood by the coronaries that depart from the aorta and surround and penetrate the heart tissue.
A contraction signal propagates through the heart. A signal is sent from the sinoatrial node for the atria to contract. The signal then propagates to the atrioventricular node where a slight delay allows finishing the filling process of the ventricles with blood. The signal then follows the bundle of His that goes through the myocardium from the basal area to the apex of the heart. The Purkinje fibers lead the signal into the right and the left ventricle. The signal is then propagated from the apex of the ventricles to the basal area.
Figure 0-1 : The heart and its four chambers. The blood flows from one atria to its adjacent ventricle, which releases the blood to other anatomical parts of the body [28].
Collagen fibers are present in the healthy heart. These fibrous connective tissues act as scaffold by maintaining the macro- and micro- structure of the heart [29]. The different types of collagen in the heart are:
- Epimysium: is the epicardium (outer layer of the heart).
- Perimysium: creates groups of cardiomyocytes into bundles, and as well maintains connectivity between these bundles. The structural presence of the perimysium is believed to be related to the heart’s function [30].
- Endomysium: is located around each cardiomyocytes and capillaries, maintaining the connectivity between these structures [31]. It is believed that it avoids cardiomyocytes to slip on each other, maintains their shape and maintains the vessels during muscle contraction [31].
1.1.2 Pathophysiological Changes from Cardiomyopathies
The increased infiltration of collagenous fibers in tissue alters the physiology and the function of organs that are affected, such as in the lung, the heart, the liver or the kidney. The increased presence of fibrosis in the heart is associated with adverse cardiac outcome, in the presence or absence of disease [29]. Myocardial fibrosis is characterized by the increased presence of collagen fibers in the heart [17]. In this section there will be reference to the two identified types of fibrosis: replacement and infiltrative. Replacement fibrosis consists of an increase of collagen fibers as a response to compromised cardiomyocytes during ischemia [17]. In this case, collagen fibers deposition acts as a scaffold to maintain the heart’s shape and function in the areas normally occupied by cardiomyocytes. The scars composed of collagen fibers can form relatively large regions that are distinguished from healthy myocardium with imaging modality. LGE CMR images are routinely used in clinical practice in the presence of ischemic cardiomyopathy to determine scar characteristics, such as the location and the extent of damage to the myocardium [2]. Infiltrative fibrosis is the presence of collagen fibers in the interstitial space. Collagen fibers are present in the myocardium in response to pathophysiological transformations that occur with disease from various etiology [32]. It consists in increased presence of collagen fibers in the interstitial space, expanding the extracellular matrix [33].
1.1.2.1 Ischemic Cardiomyopathy
In ischemic cardiomyopathy, myocardial remodeling happens in response to ischemia and injury. However, this mechanism is believed to become maladaptive and harmful to the heart, leading eventually to heart failure. Different stages of the disease lead to various levels of damage and remodeling. In the early onset of the disease, or acute myocardial infarction, the cardiomyocytes lower their energy consumption in reaction to ischemia and therefore diminish their contraction to survive upon diminished supply of blood to the region. Without intervention to res-establish blood flow, cell death occurs from necrosis but apoptosis (programmed cell death) may also contribute to eventual cell death.
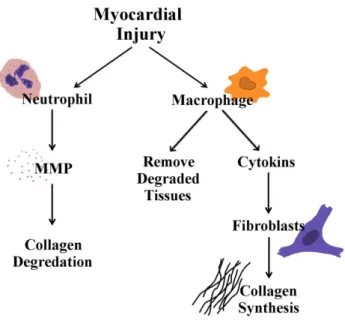
Figure 0-2 : The response to myocardial injury is an increase of inflammatory cells that include neutrophil and macrophages, amongst others. In acute myocardial infarction there is degradation
of collagen fibers that is followed by increase of collagen synthesis to eventually form fibrosis.
When the myocardium is injured, the body responds by increasing the number of inflammatory cells (neutrophil, macrophage and others) in the region (see Figure 0-2) [34]. There is edema and swelling of the myocardium. Initially, increase of metalloproteinase cells, which originate from neutrophil cells, disintegrate collagen fibers. This results in higher risk of rupture of the heart wall. However, macrophages reduce the debris of necrosis and indirectly increase fibroblasts, one of the many mechanisms that results in synthesis of collagen in the heart [34]. Collagen is present in the healthy heart and acts as an element that maintains structure: it surrounds myocyte cells individually (endomysium) or in a bundle (perimysium). There is a slow turnover of collagen in the healthy myocardium that is disrupted in the presence of myocardial infarction. The long term result is excess collagen deposition (fibrosis). In chronic myocardial infarction there is thinning of the myocardium. The progress of damage to the myocardium typically starts in the subendocardial region (interior cavity of the left ventricle) and progressively spreads towards the epicardium (the outer surface of the heart).
1.1.2.2 Non-Ischemic Cardiomyopathy
Non-ischemic cardiomyopathies originate from different causes than coronary obstruction. In amyloidosis, amyloid proteins infiltrate the extracellular space over all the myocardium accompanied with wall thickening [35]. There might as well be presence of focal or diffuse fibrosis. Myocarditis is the inflammation of the heart muscle, most often due to infection, and that can lead to dilated cardiomyopathy (DCM) [36]. In DCM, the heart muscle is enlarged, with the possible presence of fibrosis [37]. In hypertrophic cardiomyopathy (HCM) the myocardium is thickened from cellular disarray [38].
1.1.3 LGE CMR Image Acquisition
During diagnosis, image acquisition parameters are chosen to obtain different information on cardiomyopathies. LGE CMR characterizes myocardial tissue in ways that are useful for diagnosis of many diseases including ischemic and non-ischemic cardiomyopathies. Magnetic resonance is an imaging procedure which exploits the energy released by proton excitation [39]. Randomly oriented protons are aligned in an applied magnetic field B0. The net magnetization refers to the
resulting magnetization of all protons. Following the application of selected radio frequency (RF) pulses, protons change orientation and there is a change of orientation of the magnetization. The return to equilibrium of the magnetization is what creates the signal that is imaged. In gradient echo (GRE) sequences, a gradient is applied after the RF pulse to generate a signal. LGE CMR images are T1-weighted and use an MR acquisition sequence called inversion recovery (IR) [40, 41]. T1
times are defined as the time when 60% of the signal has been recovered. All tissues return to equilibrium at a different pace, which results in different signal intensity levels in different tissues. IR is done by flipping the protons 180o and letting magnetization recover. When magnetization is in the transverse plane, there is no signal intensity. Since all tissues will recover at their own pace, it is used to null the healthy myocardium while still seeing other diseased parts of the myocardium. An alternative method is now used that employs the phase sensitive inversion recovery (PSIR) technique and which allows more latitude in selecting the time to null the myocardium while maintaining contrast between healthy and diseased tissues. Shortening of the T1 time in the infarct
zone results in brighter signal intensity in that area and is done through the use of a contrast agent (CA).
LGE CMR images are obtained after administrating an intravenous CA that spreads in the heart cavity and later spreads in the myocardium with altered kinetics and volume distribution in the area of damage. The contrast agents are gadolinium (Gd) based. This metal interacts with protons and shortens the T1 relaxation time of the myocardium or blood, enhancing the signal intensity of the
region where the contrast is present [42-44]. However this metal is toxic and blocks calcium channels [43, 44]. It is therefore combined with a chelate to form a molecular structure that is stable in the body and is excreted by the kidney. Gadolinium combined with pentetic acid, Gd-DTPA, is one of five agents approved by the FDA for investigational use. The CA is extracellular. The result is relatively more enhancement of intensities where the myocardium is altered by the pathology. The signal intensity of the myocardium is nulled using an IR acquisition method [45] to provide high contrast ratio between the remote myocardium and the affected region. The cause of enhancement is different depending on the disease, ischemic or non-ischemic cardiomyopathies [46].
Alternative methods to LGE CMR images have emerged recently. T1 maps are created either with
pre- or post-contrast T1-weighted images [7]. Magnetization recovery is changed with disease and
can be analyzed with T1 recovery times, pre- or post- contrast administration [7]. Extracellular
volume (ECV) is obtained by measuring the hematocrit in the blood, extracting concentration of Gd in the heart and extrapolating the myocardial fibrosis content from an estimate of the extracellular space [7].
1.1.4 LGE CMR Imaging of Cardiomyopathies
1.1.4.1 Ischemic Cardiomyopathy
Hyperenhancement occurs in the presence of either acute or chronic myocardial infarction (MI) [47, 48]. In the presence of acute infarction, cell membranes may have ruptured, allowing the extracellular contrast agent to reach what had previously been the intracellular space. In chronic infarction, the myocardium has been replaced by collagen scar and the extracellular space is increased [49].
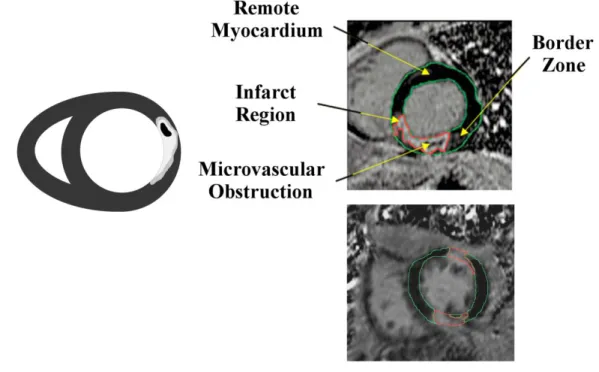
Figure 0-3 : Schematic representation of an LGE CMR image of a patient with acute MI (left). Example images to the right show an acute MI (top image) and a chronic MI (bottom image) LGE CMR patient image. The acute MI image shows macrovascular obstruction (MVO) as an island of dark signal intensity in the bright infarct region (red outline). The remote myocardium is nulled and outlined in green. The peri-infarct zone is seen as lighter shades of gray that surrounds the infarct region.
The severity and transmurality of the ischemic area can be established with LGE CMR images. This modality has the highest resolution method for imaging myocardial infarction and assessing myocardial viability [2, 50]. Four regions may be identified on LGE CMR images in the presence of myocardial infarction (Figure 0-3):
The remote myocardium is a dark region in the myocardium. It is considered healthy, although there might be small regions of fibrosis present in the case of chronic infarctions.
The infarction is the brightest region due to the use of the contrast agent and identifies the diseased region.
The border zone is in tones of gray intensities that range between those of the remote myocardium and the infarct region. It is located around the infarct and is also called the gray zone.
The microvascular obstructions (MVO) are the dark regions that can appear central to the infarcted area if the contrast agent cannot reach the center of the infarct. The border zone is highly influenced by partial volume effects. The image resolution in the current clinical setting does not permit the analysis of the underlying fibers. This region is believed to be one of two states: a clear delineation between infarct and healthy cardiomyocytes, or the result of intermingling of infarct and healthy cells [51].
It has been shown that gadolinium based contrast agent spreads in the myocardium and enhances infarct at a near cellular level [51]. Acute and chronic infarctions exhibit different enhancement patterns on high resolution LGE CMR images. In acute myocardial infarction, lesions show some dark patches of microvascular obstruction (MVO) that are seen inside the bright region of infarct. There are also regions with less severe enhancement around the edge of the infarct. Chronic infarction is characterized by fibrosis and the myocardial wall may have thinned. The infarct then appears to be more fibrous than the remote myocardium. The MRI appearance of chronic infarction tends to be more binary with a bright region for the infarct and a dark remote myocardium. Ischemic cardiomyopathies are amongst the most common cause of death in developed countries. However, as more acute ischemic cardiomyopathies are treated with success in the population (with interventions such as bypass surgery) more people now suffer from chronic myocardial infarction. In the clinical context, this requires doctors to distinguish an area of acute infarction in the myocardium from an underlying chronic infarction. MRI can also detect silent or unrecognized myocardial infarction in certain patients, notably those suffering from diabetes [22]. It is likely that recent unrecognized MI may be prognostically important. Since the age of myocardial infarction gives insight to the possible outcome following a cardiovascular intervention [19], it would be useful to distinguish acute from chronic myocardial infarction during diagnosis for example for a patient presenting acute symptoms with underlying chronic myocardial infarction [52]. During the diagnosis, since the standard analysis of images relies on the detection of bright regions, discrimination of the age of infarction is limited. Since the structure of the myocardium is altered
in different ways in the presence of acute or chronic myocardial infarction, exploiting these differences while analyzing LGE CMR images might help to distinguish them.
1.1.4.2 Non-ischemic cardiomyopathy
Non-ischemic cardiomyopathies result from damage to the myocardium that originates from causes other than ischemia. Enhancement of the diseased areas in LGE CMR images depends on the disease. It is believed that bright regions in LGE CMR images indicate damage to the myocardium and this modality is used as a diagnostic tool to detect non-ischemic cardiomyopathies [53]. In the presence of disease, fibrosis or other structural changes to the myocardium may lead to a signal enhancement in LGE CMR images.
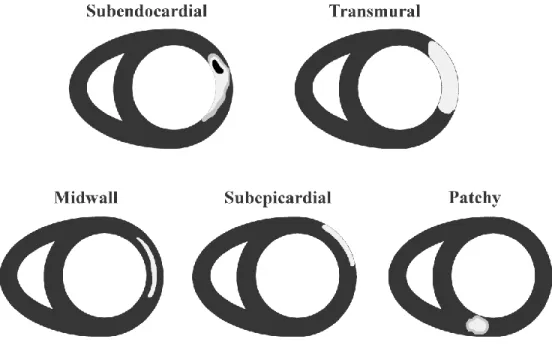
Unlike ischemic cardiomyopathies that originate in the endocardium (the interior cavity of the left ventricle) [54], enhanced signal intensities with non-ischemic cardiomyopathies can originate from any location in the myocardium (Figure 0-4). Some patterns of enhancement have been observed for various diseases. In amyloidosis, the extracellular space is expanded due to amyloid deposition along with the possible presence of diffuse or focal fibrosis. Cardiac involvement in amyloidosis has been studied with LGE CMR images, where enhancement is observed in all the myocardium and with possible focal locations of enhancement [55]. LGE CMR images can help determine to what extent the heart is involved for patients with amyloidosis. Hypertrophic cardiomyopathy (HCM) is the enlargement and disarray of the heart muscle cells which leads to abnormal thickness of the left ventricular walls [56, 57]. Studies found most of the patients with HCM exhibit enhancement in the anterior or the anteroseptal segments of the left ventricle [3, 57]; however a focal pattern was also present in some HCM patients. Jiji et al. [57] report a “focal or patchy enhancement in the mid-myocardium” region. One case study presented a clear difference between enhancements caused by MI and by HCM [58]. Various cardiomyopathies affect the heart in different ways and result in different structural changes.
Figure 0-4 : Schematic representation of typical enhancement in LGE CMR images. The subendocardial and transmural locations of enhancement are seen in ischemic cardiomyopathies. The midwall, subepicardial and patchy enhancements are seen in non-ischemic cardiomyopathies.
Diffuse myocardial fibrosis
The increased presence of collagen fibers that can naturally occur in the myocardial muscle (diffuse myocardial fibrosis) may be attributed to aging [8, 59-63]. In the aging heart, the presence of additional interstitial collagen fibers can alter the myocardial morphology and function, adversely impacting cardiac outcome. In contrast to ischemic cardiomyopathies which exhibit focal scars near the ischemic region, myocardial fibrosis due to aging is diffusely spread across the heart muscle. Diffuse myocardial fibrosis appears intermingled with healthy cardiomyocytes in histological images. Therefore in LGE CMR images, there is little remote myocardial region that can be nulled to obtain contrast between the fibrosis and the healthy regions of the myocardium [9, 10]. Diffuse myocardial fibrosis is also present in other diseases where LGE CMR images’ limitation has prevented its identification. Clinicians are now increasingly relying on other methods, such as T1 or ECV mapping [9, 10, 12-14, 16, 64, 65].
Locations of diffuse myocardial fibrosis were identified with T1 mapping for patients with
rheumatoid arthritis [66], dilated [67] and hypertrophic [68] cardiomyopathy. T1 mapping could
Extracellular volume fraction identified regions of diffuse fibrosis in dilated cardiomyopathy, even in the absence of identified enhancement from LGE CMR images [70], and in muscular dystrophy [71]. Using native T1 values is a method which avoids administration of contrast agent to the patient
and could offer diffuse fibrosis quantification [72]. However, native T1 values have also been
investigated on a 3T scanner and were not found to identify diffuse myocardial fibrosis [73]. This quantification method therefore needs more validation.
1.2 Texture Analysis in Medical Imaging
In medicine, analysis of diseases based on their underlying physiological structure has been fruitful with texture analysis. Texture features have been successfully used in magnetic resonance images to distinguish benign from malignant lesions in prostate [74, 75], breast [76-78] and liver [79] cancer as well as to study brain tissues [80]. This method seems promising, since the various cardiomyopathies affect the heart differently and result in structural differences. Acute and chronic myocardial infarctions alter the heart structure in different ways. In acute infarctions, damage is recent and there might be swelling in response to injury and signal homogeneity due to microvascular obstruction. In the presence of chronic infarctions, the heart has walls that are thinner than normal, and there is presence of fibrosis in the myocardium. These structural alterations are possible candidates for differentiation of acute and chronic infarctions and may be suitable targets for texture analysis methods. Analysis of the various underlying structural patterns of the myocardium in non-ischemic cardiac diseases could help in the diagnosis process [3]. Quantitative analysis of signal intensity or locality patterns in the myocardium in LGE CMR images could characterize aspects of cardiac diseases [3].
Texture analysis relates to the exhibited appearance of a material. Merriam Webster [81] dictionary defines texture as “the disposition or manner of union of the particles of a body or substance” or “the visual or tactile surface characteristics and appearance of something.” Texture can be more easily understood when thinking about textiles. Silk is most commonly known as a textile composed of delicate fibers. It is soft and smooth to the touch, whereas tweed is a rougher textile made of interwoven strands of wool. Silk appears more delicate and intricate whereas tweed looks rougher and bulkier. Texture, as the perceived appearance of objects, can be transposed to other fields. In imaging, texture refers to the local variation of intensities that creates the visual
appearance of objects. Satellite imagery is one application where texture analysis has been successfully applied. In this field, coarse texture can characterize a surface that exhibits many changes for example in elevation, as opposed to a smooth surface whose elevation would be more constant. In medical imaging, texture analysis is applied to describe the displayed appearance of organs as seen on images from various modalities. It can be used to delineate organs and diseased regions which are physiologically altered or to grade diseases that progressively modify the appearance of an organ in the images.
The detection and description of texture in images has been enhanced through computational processing. The limitation of the human eye to precisely distinguish different texture features in images is overcome with mathematical analysis and description of image composition. The visual perception of pattern was studied by Julesz, who described textons, or texture units [82]. Different methods have emerged that analyze characteristics of the image. Texture analysis methods have been classified into four main groups: “structural, model, statistical or transform” based [83, 84]. Methods were also described for three dimensional analysis of images [85].
1.2.1 Structural Methods
Structural methods rely on a textural entity described as the assembly of its structural parts. It involves the definition of primitives or individual components that once assembled create a texture pattern. Texels, for texture elements, were defined as primitive components [84, 86]. A lexicon of geometric patterns and the rules regarding their spatial arrangement was described by Carlucci [87] to define texture. In a similar way, Vilnrotter et al. [88] identified edge components as primitives and studied their spatial arrangement to form various textures. These methods seem to recall the receptive field in the human visual cortex that contains cells sensitive to specific edges and orientations. Structural texture analysis methods were found to be effective when the pattern analyzed was composed of an orderly pattern [89].
1.2.2 Model based Methods
Model based methods describe textures as mathematical models. Fractal geometry has been shown to represent the structural composition of many objects in nature [90]. Fractal analysis of patterns has been used to evaluate texture features in images [91, 92] and in medical imaging [93, 94]. Another model based approach uses the markov random fields for texture analysis [95]. Kashyap
et al. [96] presented a model based approach that was rotation invariant. The application of fractals in cardiology was mostly to study the physical presentation of the heart anatomy. For example, fractals have been used to study structural components such as the coronary tree in coronary angiography [97] and intravascular ultrasound [98]. Captur et al. [99] presented fractals to analyze the left ventricle anatomy from CMR images. It was suggested that heart rate variability over time could be analyzed with fractals and could be a predictor of future cardiovascular events after acute myocardial infarction [100]. This method was also applied to analyze an aging population without the presence of cardiovascular diseases [101]. However, heart rate variability is in need of more clinical validation [102]. Fractals have also been suggested to study the electrocardiogram [103].
1.2.3 Statistical Methods
Texture can be characterized by the occurrence of signal intensities found in an image or in a region of interest. Quantification of first order statistics is obtained through histogram analysis and the measures include the minimum, the maximum, the mean, the standard deviation and the kurtosis. These measures describe the range and characteristics of the signal intensity that composes the image. However, they do not provide information on the spatial distribution of the signal. A common example is given that compares a chess board pattern to a half white and half black image. Histogram analysis is incapable of differentiating the two patterns. Only methods that would consider the spatial distribution of the intensities can discern this type of difference. Spatial information is therefore important in texture analysis since repetitive patterns will contain high occurrences of signal intensities at given intervals in the image.
The limitation of histogram analysis has been addressed in methods that include the spatial information of signal intensity. In these methods, signal intensity is analyzed in constrained neighborhoods. The position and orientation of neighbor pixels with regards to a central position is used in the grey level co-occurrence matrix (GLCM). This method was described by Haralick et al. in 1973 [104]. A matrix is built that records the number of occurrences of signal intensity pairs that are formed by considering a constrained neighborhood. The matrix size is as big as the signal intensity range. Each entry of the matrix at position (i, j) corresponds to the number of times the combination of intensities (i, j) occurs in the image. The neighborhood is determined with a distance d between position of intensity i and that of intensity j. The background should not interfere with the neighborhood calculation. Once the count of occurrences of pairs of intensities
![Figure 0-1 : The heart and its four chambers. The blood flows from one atria to its adjacent ventricle, which releases the blood to other anatomical parts of the body [28]](https://thumb-eu.123doks.com/thumbv2/123doknet/2324169.29896/27.918.169.750.104.534/figure-heart-chambers-blood-adjacent-ventricle-releases-anatomical.webp)
![Figure 0-6: Diagram of the different computations involved in texture analysis and classification [187]](https://thumb-eu.123doks.com/thumbv2/123doknet/2324169.29896/47.918.123.791.570.911/figure-diagram-different-computations-involved-texture-analysis-classification.webp)