ACCOUNTING FOR COLD WORKING AND RESIDUAL STRESS EFFECTS ON THE AXIAL STRENGTH OF HSS BRACING MEMBERS
IHOR KOVAL
DÉPARTEMENT DES GÉNIES CIVIL, GÉOLOGIQUE ET DES MINES ÉCOLE POLYTECHNIQUE DE MONTRÉAL
MÉMOIRE PRÉSENTÉ EN VUE DE L’OBTENTION DU DIPLÔME DE MAÎTRISE ÈS SCIENCES APPLIQUÉES
(GÉNIE CIVIL) AOÛT 2018
UNIVERSITÉ DE MONTRÉAL
ÉCOLE POLYTECHNIQUE DE MONTRÉAL
Ce mémoire intitulé :
ACCOUNTING FOR COLD WORKING AND RESIDUAL STRESS EFFECTS ON THE AXIAL STRENGTH OF HSS BRACING MEMBERS
présenté par : KOVAL Ihor
en vue de l’obtention du diplôme de : Maîtrise ès sciences appliquées a été dûment accepté par le jury d’examen constitué de :
M. MASSICOTE Bruno, Ph. D, président
M. TREMBLAY Robert, Ph. D, membre et directeur de recherche M. ROGERS Colin A., Ph. D, membre
ACKNOWLEDGEMENT
I would like to thank my supervisor Professor Robert Tremblay for his valuable professional guidance and encouragement during these past years. With his help, I was able to develop and improve my skills as a researcher and an engineer. The experience and knowledge I gained throughout this project will stay with me for a lifetime.
I would also like to thank my father Viacheslav, my mother Kateryna and my sister Arianne for their continued support, words of encouragement and inspiration.
RÉSUMÉ
Les profilés HSS couramment utilisés comme membrures diagonales dans les contreventements concentriques sont habituellement formés à froid. Le processus de laminage en continu utilisé pour ces HSS induit un gradient sur la limite élastique de l’acier (𝐹𝑦) sur le contour de la section à cause
de l’écrouissage de l’acier. Par exemple, pour des profilés HSS carrés ou rectangulaires, 𝐹𝑦 dans
les coins est beaucoup plus élevée que dans les parois droites. Le processus de laminage en continu induit aussi des contraintes résiduelles longitudinales et transversales importantes. Dans la conception sismique, les forces de conception dans les connexions, colonnes et les poutres dépendent des forces réelles obtenues dans les contreventements HSS. Pour cette raison, il est important de tenir compte de la variation du 𝐹𝑦 sur les parois droites et des contraintes résiduelles
lorsqu’on détermine les résistances probables en tension et compression des diagonales de contreventement lors de la conception.
Une revue de littérature approfondie a été effectuée pour étudier la variation de la limite élastique 𝐹𝑦 et les profils de contraintes résiduelles dans les sections HSS formées à froid. Une étude statistique a été effectuée sur la limite élastique des profilés HSS carrés, rectangulaires et circulaires de plusieurs nuances (ASTM A500, G40.21, ASTM 1085) à partir de valeurs obtenues d’essais en traction recueillies auprès d’usines nord-américaines. Les données obtenues de la revue de littérature et de l’analyse statistique auprès des fabricants ont été utilisées pour bâtir un modèle détaillé de la variation de 𝐹𝑦 et des contraintes résiduelles sur les parois droites et les coins des profilés HSS carrés. La résistance moyenne à la traction a été déterminée basée sur ce modèle et des nuances de l’équation CSA S136 pour tenir compte de l’écrouissage. Par la suite, un modèle numérique sur OpenSees a été construit avec ces propriétés pour obtenir la résistance en compression des diagonales de contreventement HSS. Les résistances en traction et compression ont ensuite été comparées aux dispositions sismiques actuelles de la norme CSA S16 pour déterminer la résistance probable des diagonales de contreventements HSS formés à froid. On a constaté que ces dispositions sous-estiment la résistance réelle des profilés HSS formés à froid. Il est en effet nécessaire de tenir compte de la variation du 𝐹𝑦 et des contraintes résiduelles
sur le périmètre de la section pour obtenir des résultats représentatifs du comportement réel. La limite élastique dans les coins peut être posée égale à la contrainte de rupture 𝐹𝑢 obtenue de
l’éprouvette prélevée au centre des parois droites des profilés. Si cette valeur n'est pas disponible, une équation a également été proposée sur la base du rapport D/t et la valeur nominale de 𝐹𝑦. La valeur moyenne de la limite élastique obtenue des essais de traction, sur des éprouvettes prélevées au centre des parois droites des profilés HSS carrées et rectangulaires, a été 1.30Fy pour les trois nuances d’acier pour une limite d’un KL/r de 200. Pour une limite de KL/r de 100 à 200, pour les profilés HSS circulaires, cette valeur est de 1.22Fy pour du ASTM A500 et ASTM A1085, et 1.26Fy pour du CSA G40.21. Pour une limite de KL/r des HSS circulaires inférieure à 100, cette valeur est de 1.24Fy pour du ASTM A500, 1.27Fy pour du ASTM A1085 et 1.30Fy pour du CSA G40.21.
Pour les sections rectangulaires et carrées, se basant sur le modèle proposé de la variation de Fy et les variations de l’équation CSA S136 pour tenir compte de l’écrouissage, la limite élastique probable RyFy pour le calcul de Tu et Cu devrait être égale 1.50Fy (515 MPa). Cette nouvelle valeur est supérieure à la valeur de RyFy de 460 MPa qui est présentement spécifiée dans la norme CSA S16. Pour les HSS circulaires, la limite élastique probable RyFy devrait être égale à la valeur de l’éprouvette prélevée sur la paroi du mur présentée dans le paragraphe précédent.
La résistance pondérée à la traction Tr du HSS, basée sur l’aire nominale, peut être déterminée à
partir d’une moyenne pondérée basée sur le modèle proposé de la variation de 𝐹𝑦 et les nuances de l’équation pour tenir compte de l’écrouissage du CSA S136. Cette étude a été réalisée sur les sections rectangulaires et carrées. Pour ces sections, les résultats ont montré que l’on pouvait utiliser une résistance pondérée à la traction basée sur une valeur moyenne égale à 500 MPa pour des sections dont le KL/r ne dépasse pas 200.
Pour déterminer la résistance ultime en compression Cu, l’effet combiné de la limite élastique et les contraintes résiduelles varie selon l’élancement de la diagonale. Pour un défaut de rectitude de L/480, les résultats montrent que la résistance en compression des diagonales peut être approximée par l’équation de la norme CSA S16 avec n = 1.34. Pour un défaut de rectitude de L/6000, la résistance en compression des diagonales peut être approximée par l’équation de la norme CSA S16 avec n = 2.24 pour des élancements inférieurs à 0.75. Pour des élancements supérieurs à 0.75, la résistance en compression se rapproche graduellement à l’équation de la norme CSA S16 avec
n = 1.34. Pour des élancements supérieurs à 0.75, la résistance en compression se rapproche
à 1.00, la résistance en compression des diagonales peut être approximée par l’équation de la norme CSA S16 avec n = 2.24.
ABSTRACT
Cold-formed hollow structural shapes (HSSs) are commonly used for bracing members in concentrically braced frames. The continuous rolling process used for the fabrication of HSSs results in yield strength properties that vary along the perimeter of the cross-section due to strain hardening. For instance, higher yield strength is observed in the corners of square and rectangular HSSs compared to the values obtained from tensile tests on coupons taken from the HSS walls. The forming process also induces longitudinal and transverse residual stresses that affect the compressive resistance of HSS members. In seismic design, design forces for brace connections, columns and beams depend on the actual resistance of the bracing members and it is important that the variation in yield strength properties and residual stress effects be properly accounted for when determining brace probable resistances in tension and compression for design.
An extensive literature review was performed to determine the yield strength and residual stress magnitudes across the section of cold-formed HSS profiles. Statistical data on mill tensile coupon tests on square, rectangular and circular HSS sections was then collected from North American manufacturers for several steel grades (ASTM A500, G40.21, ASTM 1085). The data from the literature review and North American manufacturers was used to construct a detailed model representing the yield strength and residual stress distribution across the sections of cold-formed HSS profiles. Average full section tensile strengths were then determined based on this model. A numerical model was built with OpenSees and a parametric study was performed to investigate the compressive resistance of bracing members. The tensile and compressive strengths from these models were compared to current CSA S16 seismic design provisions for the probable resistance of cold-formed HSS bracing members.
It was found these provisions underestimate the actual strength of the cold-formed sections. It is indeed necessary to account for the cross-sectional yield strength gradient and residual stresses to obtain accurate results. The actual yield strength for the corners can be approximately set equal to the steel ultimate tensile stress Fu from tensile tests performed on coupons taken from the middle
of the walls. If this value is not available, an equation is also proposed based on the D/t ratio and nominal yield strength.
For rectangular and square profiles of all three steel grades and a KL/r limit of 200, the average yield strength obtained from mid-wall tensile coupons was 1.30Fy. For circular profiles and a KL/r
range of 100 to 200, this was value was 1.22Fy for the ASTM A500 and ASTM A1085 steel grades, and 1.26Fy for the CSA G40.21 steel grade. For circular profiles and a KL/r limit below 100, this value was 1.24Fy for the ASTM A500 steel grade, 1.27Fy for the ASTM A1085 steel grade and 1.30Fy for the CSA G40.21 steel grade.
For rectangular and square profiles, the probable resistance RyFy to determine Tu and Cu should be 1.50Fy (515 MPa). This new value is superior to the current RyFy of 460 MPa found in the CSA S16 standard. For circular HSS profiles, the probable resistance RyFy should be equal to the mid-wall tensile coupon value determined in the previous paragraph.
The factored tensile resistance Tr, based on the nominal area, of the HSS member can be determined
from a weighted average based on the proposed 𝐹𝑦 variation across the section and variations of the CSA S136 standard equation to account for strain hardening. This study was performed on square and rectangular HSS profiles. For these profiles, it was shown an average Tr value of 500
MPa can be used for KL/r ratios below 200.
To determine the ultimate compressive resistance Cu, the combined effect of the yield strength and residual stress varies with the slenderness of the diagonal. For an out-of-straightness of L/480, results show that the compressive resistance of the HSS diagonals can be approximated by the CSA S16 standard equation with n = 1.34. For an out-of-straightness of L/6000, the compressive resistance of the diagonals can be approximated by the CSA S16 standard equation with n = 1.34 for slenderness ratios below 0.75. For slenderness ratios above 0.75, the compressive resistance gradually decreases towards the CSA S16 standard equation with n = 1.34. For slenderness ratios above 1.00, the compressive resistance of the HSS diagonals can be approximated by the CSA S16 standard equation with n = 1.34.
TABLE OF CONTENTS
ACKNOWLEDGEMENT ... III RÉSUMÉ...IV ABSTRACT...VII TABLE OF CONTENTS ... IX LIST OF TABLES ... XI LIST OF FIGURES ... XVI LIST OF SYMBOLS AND ABBREVIATIONS... XXVI LIST OF APPENDICES ... XXVIIICHAPTER 1 INTRODUCTION ... 1
1.1 Historical context ... 1
1.2 Problem statement ... 5
1.3 Objectives and scope of research ... 5
1.4 Methodology ... 6
1.5 Outline of thesis ... 7
CHAPTER 2 LITERATURE REVIEW ... 8
2.1 Accounting for the increased yield strength from cold work of forming according to the S136-16 standard ... 9
2.2 Residual stress model, yield strength gradient and multiple column strength concept...26
2.3 Improved residual stress model and plastic collapse mechanism for slender cold-formed sections ... 69
2.4 Recent developments in the research of cold-formed members ... 105
2.5 Literature review summary ... 165
CHAPTER 3 EXPERIMENTAL INVESTIGATION, PROBABLE TENSILE RESISTANCE AND FACTORED TENSILE RESISTANCE ... 168
3.1 Experimental data from previous investigations and corner yield strength increase ... 170
3.2 Yield strength gradient across the member’s section ... 178
3.3 Mill test certificate data from North American manufacturers ... 185
3.4 Actual average cross-sectional yield strength (probable yield strength RyFy) ... 190
3.5 Predicted equivalent nominal yield strength reliability analysis ... 197
3.6 Proposed residual stress model ... 200
CHAPTER 4 PROBABLE COMPRESSIVE RESISTANCE ... 209
4.1 Parametric study of compressive resistance based on the nominal yield strength ... 211
4.2 Parametric study of compressive resistance based on the actual yield strength ... 221
4.3 Conclusion ... 234
CHAPTER 5 CONCLUSION AND RECOMMENDATIONS ... 237
5.1 Conclusion ... 237
5.2 Recommendations and future studies ... 241
BIBLIOGRAPHY ... 242
LIST OF TABLES
Table 2-1: Material properties (Chajes et al., 1963) ... 11
Table 2-2: Calculated results to experimental results (Karren & Winter, 1967) ... 23
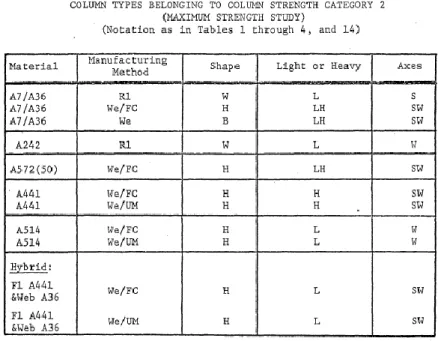
Table 2-3: Proposed maximum strength columns and group descriptions – Sections belonging to group 1 (Bjorhovde & Tall, 1971) ... 30
Table 2-4: Proposed maximum strength columns and group descriptions – Sections belonging to group 2 (Bjorhovde & Tall, 1971) ... 31
Table 2-5: Proposed maximum strength columns and group descriptions – Sections belonging to group 3 (Bjorhovde & Tall, 1971) ... 31
Table 2-6: Ramberg-Osgood approximation parameters (Kamani, 1974) ... 35
Table 2-7: Strain history during cold-forming process (Davison, 1977) ... 39
Table 2-8: Maximum longitudinal through thickness residual stress magnitudes (Davison, 1977) ... 42
Table 2-9: Measurements for longitudinal perimeter residual stress (Davison, 1977) ... 44
Table 2-10: Final proposed residual stress distribution (Davison, 1977) ... 45
Table 2-11: Tested sections (Bjorhovde, 1977) ... 50
Table 2-12: Tensile coupon measurements (Bjorhovde, 1977) ... 51
Table 2-13: Model parameter based on mean experimental values (Davison & Birkemoe, 1983)60 Table 2-14: Performed tests and studied profiles (Key & Hancock, 1985) ... 70
Table 2-15: Summary of yield strength results (Key & Hancock, 1985) ... 72
Table 2-16: Stub column tests (Key & Hancock, 1985) ... 73
Table 2-17: Cold-formed hollow sections tested (Key, 1988) ... 84
Table 2-18: Average yield strength per section (Key, 1988) ... 90
Table 2-19: Stub column strength results (Key, 1988) ... 91
Table 2-21: Normalized response parameters (Elghazouli, et al., 2005) ... 108
Table 2-22: Tensile coupon tests (Han et al., 2007) ... 110
Table 2-23: Coupon test distribution and results (Guo et al., 2007) ... 112
Table 2-24: Experimental results versus design standard (Guo et al., 2007) ... 113
Table 2-25: Tested cross section and average material properties (Li et al., 2009) ... 114
Table 2-26: Material properties of cold-formed sections versus hot-rolled sections (Gardner et al., 2010) ... 117
Table 2-27: Residual stress measurements (Gardner et al., 2010) ... 119
Table 2-28: Stub column results compared to Chinese and Australia/New Zealand cold-formed standards (Hu et al., 2011) ... 124
Table 2-29: Yield strength properties of tested sections (Afshan et al., 2013) ... 134
Table 2-30: Comparison between predictive models and experimental results (Rossi et al., 2013) ... 135
Table 2-31: Comparison between power law model and tri-linear model (Rossi, Afshan, & Gardner, 2013) ... 136
Table 2-32: Tested sections (Sun, 2014) ... 137
Table 2-33: Coupon test results (Sun, 2014) ... 139
Table 2-34: Full-sectional tensile versus compressive properties (Sun, 2014) ... 139
Table 2-35: Residual stress measurements (Sun, 2014) ... 141
Table 2-36: Proportional limit over stub column yield strength ratio (Sun & Packer, 2014) ... 142
Table 2-37: Parametric study on residual stress – Numerical values (Liu et al., 2017) ... 147
Table 2-38: Tensile coupon strength measurements (Somodi & Kövesdi, 2016) ... 149
Table 3-1: List of previous investigations and the type of data each provided ... 170
Table 3-3: Tensile test results summary from North American manufacturers – Normalized with
respect to the nominal yield strength ... 185
Table 3-4: Tensile test results summary from North American manufacturers with respect to a b/t ratio for square or rectangular sections ... 186
Table 3-5: Tensile test results summary from North American manufacturers with respect to a b/t ratio for circular sections ... 186
Table 3-6: Average cross-sectional yield strength according to weighted average, S136A and S136B methods – Normalized with respect to the nominal yield strength ... 192
Table 3-7: Example to determine the nominal yield strength to satisfy the resistance factor based on a reliability analysis. ... 198
Table 3-8: Equivalent nominal yield strength (Fy*) to be used in the current equation Tr assuming a ϕ of 0.9 and the nominal area. ... 199
Table 3-9: Previously proposed residual stress distributions ... 201
Table 4-1: Applied strain hardening parameters ... 215
Table 4-2: Normalized and numerical results for the yield strength distribution model presented in Chapter 4 ... 225
Table 4-3: Comparison between refined weighted average model presented in Chapter 4 and previous models presented in Chapter 3 to determine the average cross-sectional yield strength ... 227
Table A- 1: Steel grade specifications summarized used for mill certificate analysis in Chapter 3...248
Table A- 2: Results for shaped HSS from North American Steel manufacturers – Part 1...249
Table A- 3: Results for shaped HSS from North American Steel manufacturers – Part 2...250
Table A- 4: Results for shaped HSS from North American Steel manufacturers – Part 3...251
Table A- 5: Results for shaped HSS from North American Steel manufacturers – Part 4...252
Table A- 6: Results for shaped HSS from North American Steel manufacturers – Part 5...253
Table A- 8: Results for shaped HSS from North American Steel manufacturers – Part 7...255
Table A- 9: Results for shaped HSS from North American Steel manufacturers – Part 8...256
Table A- 10: Results for shaped HSS from North American Steel manufacturers – Part 9...257
Table A- 11: Results for shaped HSS from North American Steel manufacturers – Part 10...258
Table A- 12: Results for shaped HSS from North American Steel manufacturers – Part 11...259
Table A- 13: Results for shaped HSS from North American Steel manufacturers – Part 12...260
Table A- 4: Results for round HSS from North American Steel manufacturers – Part 1...263
Table A- 15: Results for round HSS from North American Steel manufacturers – Part 2...264
Table A- 16: Results for round HSS from North American Steel manufacturers – Part 3...265
Table A- 17: Results for round HSS from North American Steel manufacturers – Part 4...266
Table A- 18: Results for round HSS from North American Steel manufacturers – Part 5...267
Table A- 19: Results for round HSS from North American Steel manufacturers – Part 6...268
Table A- 20: Results for round HSS from North American Steel manufacturers – Part 7...269
Table A- 21: Results for round HSS from North American Steel manufacturers – Part 8...270
Table A- 22: Results for round HSS from North American Steel manufacturers – Part 9...271
Table B- 1: Detailed results from reliability analysis – Part 1...274
Table B- 2: Detailed results from reliability analysis – Part 2...275
Table B- 3: Detailed results from reliability analysis – Part 3...276
Table B- 4: Detailed results from reliability analysis – Part 4...277
Table B- 5: Detailed results from reliability analysis – Part 5...278
Table B- 6: Detailed results from reliability analysis – Part 6...279
Table B- 7: Detailed results from reliability analysis – Part 7...280
Table B- 8: Detailed results from reliability analysis – Part 8...281
Table B- 10: Detailed results from reliability analysis – Part 10...283
Table B- 11: Detailed results from reliability analysis – Part 11...284
Table B- 12: Detailed results from reliability analysis – Part 12...285
Table B- 13: Detailed results from reliability analysis – Part 13...286
Table B- 14: Detailed results from reliability analysis – Part 14...287
Table B- 15: Detailed results from reliability analysis – Part 15...288
Table C- 1: Profiles used for OpenSees analysis with actual properties – Part 1...289
Table C- 2: Profiles used for OpenSees analysis with actual properties – Part 2...290
Table C- 3: Profiles used for OpenSees analysis with actual properties – Part 3...291
Table C- 4: Profiles used for OpenSees analysis with actual properties – Part 4...292
Table D- 1: Coupon results from previous research – Part 1...293
Table D- 2: Coupon results from previous research – Part 2...294
Table D- 3: Coupon results from previous research – Part 3...295
Table D- 4: Coupon results from previous research – Part 4...296
Table D- 5: Coupon results from previous research – Normalized with respect to nominal yield strength – Part 1...297
Table D- 6: Coupon results from previous research – Normalized with respect to nominal yield strength – Part 2...298
Table D- 7: Coupon results from previous research – Normalized with respect to nominal yield strength – Part 3...299
Table D- 8: Coupon results from previous research – Normalized with respect to nominal yield strength – Part 4...300
Table D- 9: Coupon results from previous research – Normalized with respect to nominal yield strength – Part 5...301
LIST OF FIGURES
Figure 1-1: Cold-rolled forming process of cold-formed hollow structural members (Wilkinson, 1999) ... 1 Figure 1-2: Measure yield strength for cold-formed HSS members (Schmidt & Bartlett, 2002a) .. 3 Figure 2-1: Plate used in cold stretching operation and typical tensile and compressive specimens
(Chajes et al., 1963) ... 11 Figure 2-2 :Typical stress-strain curve for tested coils (Chajes et al., 1963) ... 12 Figure 2-3: Aging effects on hot rolled semi-killed steel (Chajes et al., 1963) ... 13 Figure 2-4: Tensile stress-strain curves of virgin materials in terms of true stress and true strain
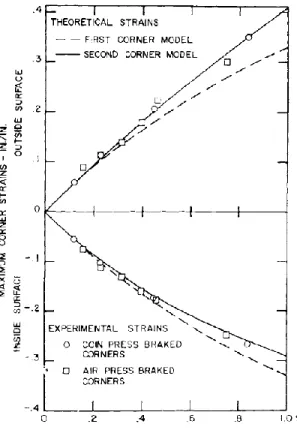
(Karren, 1967) ... 15 Figure 2-5: Maximum corner strains by Photogrid Method, full line, and corner strains by equation
(2-8), dashed line (Karren, 1967) ... 17 Figure 2-6 : Comparison between theoretical prediction of corner yield strength and experimental
results – Part 1 (Karren, 1967) ... 19 Figure 2-7 : Comparison between theoretical prediction of corner yield strength and experimental
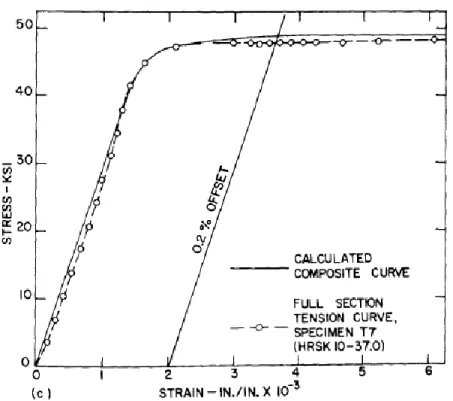
results – Part 2 (Karren, 1967) ... 20 Figure 2-8: Sectioned coupon properties for virgin and as-formed state (Karren & Winter, 1967) ... 21 Figure 2-9: Composite curve of flat and corner average vs. experimental results from full tensile
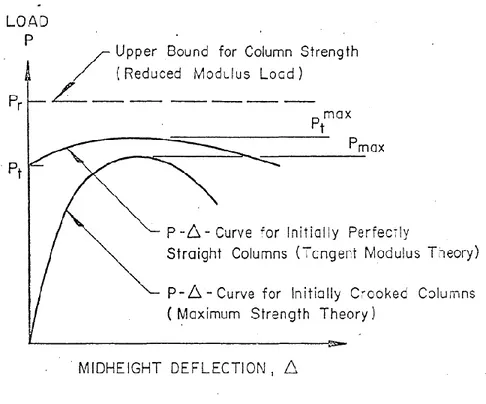
section (Karren & Winter, 1967) ... 22 Figure 2-10: The assembly of 69 tangent modulus column curves (Bjorhovde & Tall, 1971) ... 27 Figure 2-11: Schematic illustration of the various inelastic column strength concepts (Bjorhovde
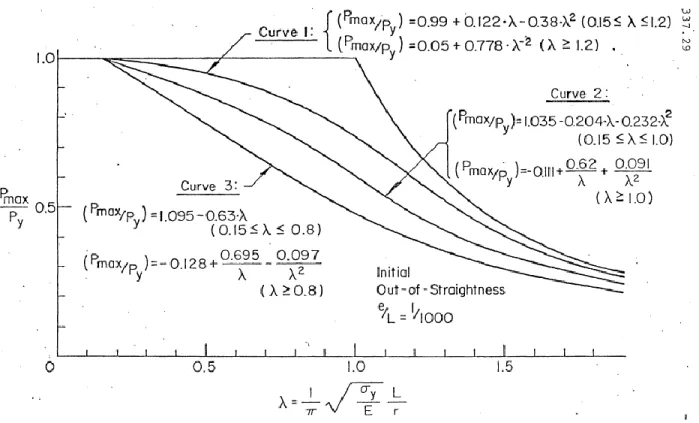
& Tall, 1971) ... 28 Figure 2-12: The band of all 112 maximum strength column curves (Bjorhovde & Tall, 1971) .. 29 Figure 2-13: Proposed maximum strength columns and group descriptions – Column curves
Figure 2-14: Coupon distribution for residual stress measurements and tensile tests (Kamani, 1974)
... 32
Figure 2-15: Stub-column stress strain curve (Kamani, 1974) ... 32
Figure 2-16: Longitudinal residual stress distribution across the section (Kamani, 1974) ... 33
Figure 2-17: Stub column, residual stress, and tensile coupon measurements (Kamani, 1974) .... 33
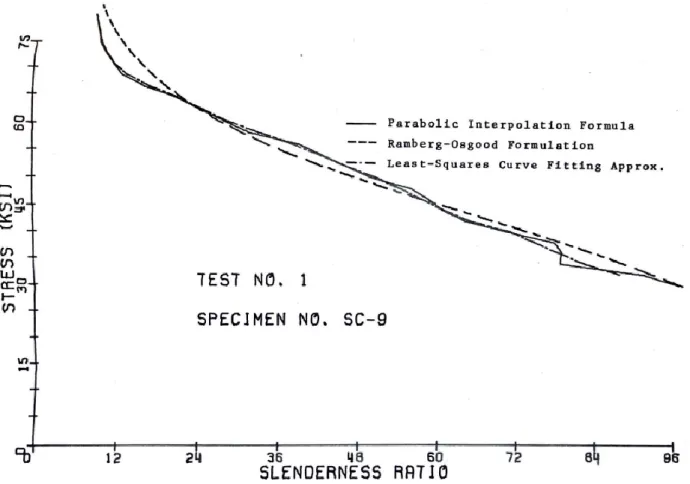
Figure 2-18: Comparison of column curves obtained from various approximate methods (Kamani, 1974) ... 34
Figure 2-19: Ramberg-Osgood approximation curves for the averaged stress-strain values (Kamani, 1974) ... 36
Figure 2-20: Maximum strength model with and without residual stress (Kamani, 1974) ... 36
Figure 2-21: Comparison between the case with and without residual stress and comparison between different model types (Kamani, 1974) ... 37
Figure 2-22: Proposed residual stress distribution vs actual residual stress (Kamani, 1974) ... 37
Figure 2-23: Nature of bending residual stresses (Davison, 1977) ... 39
Figure 2-24: (a) Kato and Aoki (1978) and (b) Giaux (1972) through thickness residual stress profiles and (c) & (d) Davison’s proposed profiles (Davison, 1977) ... 41
Figure 2-25: Possible perimeter residual stress patterns (Davison, 1977) ... 43
Figure 2-26: In-situ residual stress after sum of perimeter and through thickness (Davison, 1977) ... 44
Figure 2-27: Sectioned profile with all tested coupons (Davison, 1977) ... 45
Figure 2-28: Yield strength distribution (Davison, 1977) ... 46
Figure 2-29: Comparison between yield strength prediction models and model profile based on actual results (Davison, 1977) ... 46
Figure 2-30: Tangent modulus model (Davison, 1977) ... 47
Figure 2-31: Comparison of heat treated HSS sections with SSRC curves (Davison, 1977) ... 49
Figure 2-33: Stub column results (Bjorhovde, 1977) ... 52
Figure 2-34: Residual stress measurements based on proportional limit (Bjorhovde, 1977) ... 53
Figure 2-35: Pin-ended column results with respect to SSRC curves (Bjorhovde, 1977) ... 54
Figure 2-36: Corner and stub column strength over virgin coil strength (Davison & Birkemoe, 1983) ... 55
Figure 2-37: Yield strength gradient for two sections with different w/t ratios (Davison & Birkemoe, 1983) ... 55
Figure 2-38: Variation in material stress-strain nonlinearity in non-heat treated regular CF (w/t = 32.1) and seamless CF (w/t = 6.7) tensile coupons (Davison & Birkemoe, 1983) ... 56
Figure 2-39: Residual stress on cross section (Davison & Birkemoe, 1983) ... 57
Figure 2-40: Model state of residual stress through the tube wall (Davison & Birkemoe, 1983) . 58 Figure 2-41: Comparison of CF residual stress levels: Model vs. mean test values (Davison & Birkemoe, 1983) ... 60
Figure 2-42: Comparison of HSS stub column results to tangent modulus model for CF shapes (Davison & Birkemoe, 1983) ... 62
Figure 2-43: Comparison of load-displacement curves for full-sized column tests with maximum strength theory for cold-formed non-heat-treated section 8 x 8 x 0.450 (Davison & Birkemoe, 1983) ... 62
Figure 2-44: Comparison-strength curves from full-sized column tests and theory for cold-formed non-heat-treated HSS (Davison & Birkemoe, 1983) ... 63
Figure 2-45: Comparison of SSRC curves with theoretical maximum strength curves for CF and CFS sections (Davison & Birkemoe, 1983) ... 64
Figure 2-46: Yield strength coupon locations (Key & Hancock, 1985) ... 71
Figure 2-47: Yield strength results for sectioned member (Key & Hancock, 1985) ... 72
Figure 2-48: Stub column maximum strength (Key & Hancock, 1985) ... 74
Figure 2-50: Load-axial deformation curves for 152 x 152 x 4.9 section (Key & Hancock, 1985)
... 76
Figure 2-51: Experimental results compared to the SSRC curves and normalized to the average coupon yield strength (Key & Hancock, 1985) ... 76
Figure 2-52: Proposed column curve based on the nominal yield strength compared to experimental results (Key & Hancock, 1985) ... 78
Figure 2-53: Stub column plastic mechanism model (Hancock & Key, 1986) ... 79
Figure 2-54: Comparison of theoretical plastic mechanisms for section 76x76x2.0 (Hancock & Key, 1986) ... 80
Figure 2-55: Pin-ended column plastic mechanism model (Hancock & Key, 1986) ... 81
Figure 2-56: Distortionally buckled member (left) and typical section for finite strip discretization (right) (Key, 1988) ... 83
Figure 2-57: Measured residual stress values - Longitudinal (Key, 1988) ... 85
Figure 2-58 : Spark layering technique procedure - Longitudinal (Key, 1988) ... 86
Figure 2-59: Measured final through thickness residual stress in longitudinal direction (Key, 1988) ... 87
Figure 2-60 : Adopted through thickness residual stress profile - Longitudinal (Key, 1988) ... 88
Figure 2-61: Adopted residual stress profile – Transverse (Key, 1988) ... 88
Figure 2-62 : Adopted residual stress profile across the section (Key, 1988) ... 89
Figure 2-63 : Tensile coupon positions (Key, 1988) ... 89
Figure 2-64 : Tensile stress in sectioned coupons (Key, 1988) ... 90
Figure 2-65: Yield stress distribution adopted in theoretical model (Key & Hancock, 1993) ... 92
Figure 2-66 : Finite strip discretization (Key, 1988) ... 92
Figure 2-67: Residual stress parametric study (Key & Hancock, 1993) ... 94
Figure 2-68: Influence of Residual Stress on SHS Pin-Ended Column Behaviour (Key, 1988) ... 95
Figure 2-70: Typical RHS section (Wilkinson, 1999) ... 98
Figure 2-71: Typical stress strain curve for cold-formed sections (Wilkinson, 1999) ... 98
Figure 2-72 : Full section test vs coupon tests (Wilkinson, 1999) ... 99
Figure 2-73: Shake table setup for CBF tests (Elghazouli, et al., 2005) ... 107
Figure 2-74: Test setup and simplified model (Han et al., 2007) ... 109
Figure 2-75 : Tensile coupon placement and tested sections (Han et al., 2007) ... 110
Figure 2-76: Coupon distribution (Guo et al., 2007) ... 112
Figure 2-77: Roll-formed square hollow section: (a) FRF and (b) CRF (Li et al., 2009) ... 113
Figure 2-78: Residual stress distribution (Li et al., 2009) ... 115
Figure 2-79: Tensile coupon distribution (Gardner et al., 2010) ... 116
Figure 2-80: Corner material strength data and AISI predictive model (Gardner et al., 2010) ... 118
Figure 2-81: Normalized stub column resistance versus plate slenderness (Gardner et al., 2010) ... 120
Figure 2-82: Hardening with residual stresses from cold bending: (a) stress-strain curve, (b) isotropic hardening with expanding yield surface, and (c) kinematic hardening with shifting yield surface (Gao and Moen, 2010) ... 121
Figure 2-83: (a) Finite element model boundary conditions and loading and (b) assumed stress-strain curve (Gao and Moen, 2010) ... 122
Figure 2-84: Residual stress distribution in finite element model (Gao & D. Moen, 2010) ... 122
Figure 2-85: Tensile coupon distribution and virgin strip coupon distribution (Hu et al., 2011) 123 Figure 2-86: Yield strength in tensile coupons after each pass (Hu et al., 2011) ... 124
Figure 2-87: Flat and corner coupon distribution (Li et al., 2012)... 125
Figure 2-88: Obtained stress-strain curves for tested coupons (Li et al., 2012) ... 126
Figure 2-89: Tube coupon results – Part 1 (Li et al., 2012) ... 126
Figure 2-91: Stub column strengths compared to cold-formed standards (Li et al., 2012) ... 128
Figure 2-92: Through thickness measurement position (Tong et al., 2012) ... 129
Figure 2-93: Material properties of test specimens (Tong et al., 2012) ... 129
Figure 2-94: Residual stresses for C-135 x 10 using hole-drilling method (Tong et al., 2012) ... 130
Figure 2-95: Comparison of hole drilling method and diffraction method (Tong et al., 2012) ... 131
Figure 2-96: Through thickness distribution – C-135 x 10 (Tong et al., 2012) ... 132
Figure 2-97: Proposed longitudinal residual stress distribution (Tong, et al., 2012) ... 132
Figure 2-98: Location of tensile coupon tests (Afshan et al., 2013) ... 133
Figure 2-99: Approximation of longitudinal residual stress from stub column results (Sun, 2014) ... 138
Figure 2-100: Tensile coupon results CF12 – RHS 152 x 152 x 12.7 – Continuously formed (Sun, 2014) ... 140
Figure 2-101: Tensile coupon results CF24 – RHS 152 x 152 x 12.7 – Continuously formed (Sun, 2014) ... 140
Figure 2-102: Elongation differences (Sun, 2014) ... 141
Figure 2-103: Residual stress measurements (Sun, 2014) ... 141
Figure 2-104: Residual stress distribution applied to column model (Sun, 2014) ... 143
Figure 2-105: Tangent modulus model versus stub column experimental values (Sun, 2014) ... 144
Figure 2-106: Comparison of column model with design curves and experimental values (Sun, 2014) ... 144
Figure 2-107: Comparison of effects of different residual stress components (Liu et al., 2017) 145 Figure 2-108: Studied frame configurations (Liu et al., 2017) ... 146
Figure 2-109: Parametric study on residual stress – Graphs (Liu et al., 2017) ... 146
Figure 2-111: Residual stress measurements with respect to b/t ratio (Somodi & Kövesdi, 2016) ... 150 Figure 2-112: Residual stress measurements by the sectioning technique versus the laser Falconeye
technique (Somodi & Kövesdi, 2016) ... 151 Figure 2-113: Through thickness residual stress measurements (Somodi & Kövesdi, 2016) ... 152 Figure 2-114: Global imperfection results – Brute results (Somodi & Kövesdi, 2017) ... 153 Figure 2-115: Global imperfection results – Normalized (Somodi & Kövesdi, 2017) ... 153 Figure 2-116: Buckling reduction coefficients – Based on actual values (Somodi & Kövesdi, 2017) ... 154 Figure 2-117: Buckling reduction coefficients – Based on nominal values (Somodi & Kövesdi,
2017) ... 154 Figure 2-118: Buckling curve with material models (Kovesdi & Somodi, 2017) ... 155 Figure 2-119: Buckling curve for different material grades (Kovesdi & Somodi, 2017) ... 156 Figure 3-1: Coupon distribution ... 171 Figure 3-2: Average normalized yield strength of corners by investigation ... 173 Figure 3-3: Average normalized yield strength from flat sections – Including weld ... 173 Figure 3-4: Average normalized strength from flat sections – Excluding weld ... 174 Figure 3-5: Average normalized yield strength of corners – Canadian investigations only ... 175 Figure 3-6: Average normalized yield strength of corners versus flats ... 175 Figure 3-7: Increase in yield strength in the corners normalized with respect to the nominal yield
strength with respect to the D/t ratio ... 177 Figure 3-8: Cross section yield strength distribution ... 178 Figure 3-9: Tested coupons - Positions (Bjorhovde, 1977) ... 179 Figure 3-10: Normalized yield strength across the section – All sections (Bjorhovde, 1977) .... 180 Figure 3-11: Normalized yield strength across the section – 102 x 102 x 6 (Bjorhovde, 1977) . 181
Figure 3-12: Normalized yield strength across the section – 203 x 203 x 6 (Bjorhovde, 1977) . 181 Figure 3-13: Normalized yield strength across the section – 152 x 152 x 13 (Bjorhovde, 1977) 182 Figure 3-14: Normalized yield strength across the section – 152 x 152 x 6 (Bjorhovde, 1977) . 182 Figure 3-15: Normalized yield strength across the section – 203 x 203 x 13 (Bjorhovde, 1977) 183 Figure 3-16: Example of yield strength distribution with nominal yield strength ... 184 Figure 3-17: Yield ratio - ASTM A500 (SHS and RHS - b/t<17.7 - KL/r = 100) ... 187 Figure 3-18:Yield ratio - ASTM A1085 (SHS and RHS - b/t<17.7 - KL/r = 100) ... 188 Figure 3-19: Yield ratio - CSA G40.21 (SHS and RHS - b/t<17.7 - KL/r = 100) ... 188 Figure 3-20: Cross sectional yield strength distribution model – Weighted average ... 191 Figure 3-21: Comparison between S136B method and measured corner yield strength ... 193 Figure 3-22: Normalized difference between S136B method and actual corner yield strength ... 194 Figure 3-23: Average ultimate tensile stress of corners and flats ... 195 Figure 3-24: Normalized ultimate tensile stress (corner over flat) ... 195 Figure 3-25: Normalized difference between flat ultimate tensile stress and corner yield strength ... 196 Figure 3-26: Average residual stress with respect to section yield strength (Somödi and Kovesdi,
2016) ... 202 Figure 4-1: HSS bracing member for parametric study subjected to a concentric axial force .... 211 Figure 4-2: Yield strength gradient ... 212 Figure 4-3: Membrane residual stress distribution (perimeter) ... 212 Figure 4-4: Through thickness residual stress distribution (bending) ... 213 Figure 4-5: Overall view of yield strength and residual stress models ... 213 Figure 4-6: Example of residual stress application in OpenSees model (through thickness) ... 214 Figure 4-7: Strain hardening definition in OpenSees uniaxial material steel02 (Mazzoni et al., 2018) ... 214
Figure 4-8: Stress strain graph for OpenSees uniaxial material steel02 (Mazzoni et al., 2018) .. 215 Figure 4-9: HSS bracing member OpenSees results for 127 x 127 x 12.7 section ... 216 Figure 4-10: HSS bracing member OpenSees results for 76.2 x 76.2 x 4.78 section ... 217 Figure 4-11: HSS bracing member OpenSees results for 152.4 x 152.4 x 8.0 section ... 217 Figure 4-12: HSS bracing member OpenSees results for all sections with standard (345 MPa)
uniform yield strength and no residual stresses ... 218 Figure 4-13: HSS bracing member OpenSees results for all sections with a yield strength gradient
but no residual stresses ... 218 Figure 4-14: HSS bracing member OpenSees results for sections with a yield strength gradient and
through thickness residual stress only ... 219 Figure 4-15: HSS bracing member OpenSees results for all sections with both the yield strength
gradient and all residual stress components ... 219 Figure 4-16: Increase in yield strength in the corners normalized with respect to the nominal yield
strength with respect to the D/t ratio ... 221 Figure 4-17: Average normalized yield strength of corners versus flats ... 222 Figure 4-18: Yield strength at the center of the flat wall ... 223 Figure 4-19: Normalized corner yield strength based on Chapter 4 model ... 224 Figure 4-20: Ultimate tensile stress for A1085 steel grade ... 226 Figure 4-21: Yield strength gradient based on actual mill certificate data ... 227 Figure 4-22: Membrane residual stress model based on average cross-sectional yield strength
(RyFy) ... 228 Figure 4-23: Through thickness residual stress model based on average cross-sectional yield
strength (RyFy) ... 228 Figure 4-24: Compressive resistance Cu according to KL/r and normalized with respect to the
Figure 4-25: Compressive resistance Cu according to 𝜆 and normalized with respect to average cross-sectional yield strength – Out-of-straightness of L/6000 ... 230 Figure 4-26: Compressive resistance Cu according to KL/r and normalized with respect to the
nominal yield strength – Out-of-straightness of L/480 ... 231 Figure 4-27: Compressive resistance Cu according to 𝜆 and normalized with respect to average
cross-sectional yield strength – Out-of-straightness of L/480 ... 232 Figure A- 1: Results for shaped HSS from North American Steel manufacturers – Part 1...261 Figure A- 2: Results for shaped HSS from North American Steel manufacturers – Part 2...262 Figure A- 3: Results for round HSS from North American Steel manufacturers – Part 1...272 Figure A- 4: Results for round HSS from North American Steel manufacturers – Part 2...273
LIST OF SYMBOLS AND ABBREVIATIONS
𝐴𝑒𝑓𝑓 Effective area𝐴 Hollow section area
𝐵 Hollow section width
𝐶 Ratio of corner to total cross-sectional area
𝐷 Hollow section height
E Elastic modulus
𝑄 Effective to gross area ratio
𝑃𝑦 Yield force
𝑃𝑆𝑡ℎ𝑒𝑜𝑟 Theoretical stub column strength
𝑅𝑦𝐹𝑦 Probable yield strength
ϕ Steel resistance factor
𝑛 Column strength parameter
𝜆 Slenderness ratio
𝛽 Reliability index
𝛼𝑟 Coefficient of separation
𝛿 Curvature
𝜎𝑠𝑡𝑢𝑏 Stub column yield stress
𝜎𝑐𝑜𝑢𝑝𝑜𝑛 Yield strength of coupon taken from center of flat wall σ𝑦𝑠 Stub column stress
σ0.2 0.2% proof stress
σ𝑟𝑡,𝑚𝑎𝑥 Maximum through thickness residual stress
𝜎𝑦 Yield stress
𝐹𝑦 Yield strength
𝐹𝑢 Ultimate tensile stress 𝐹𝑦𝑛𝑜𝑚 Nominal yield strength
F𝑦𝑐 Corner yield strength
F𝑦𝑣 Strip coil virgin yield strength
𝐹𝑦𝑎 Average cross section yield strength 𝐹𝑢𝑣 Strip coil virgin ultimate tensile stress 𝜌𝑚 Material ratio
𝜌𝑔 Geometric bias ratio 𝜌𝑝 Professional ratio 𝜌𝑟 Steel resistance factor
𝑉𝑟 Coefficient of variation of resistance factor
𝑉𝑚 Coefficient of variation of material ratio
𝑉𝑔 Coefficient of geometric bias
𝑉𝑝 Coefficient of resistance factor
CHS Circular hollow section
RHS Rectangular hollow section
HSS Hollow structural section
SHS Square hollow section
LIST OF APPENDICES
Appendix A – mill certificate results for chapter 3 ... 248 Appendix B – detailed results for reliability analysis in chapter 3 ... 274 Appendix C – tested profiles for chapter 4 ... 289 Appendix D – data from previous research for chapter 3 ... 293
CHAPTER 1
INTRODUCTION
1.1 Historical context
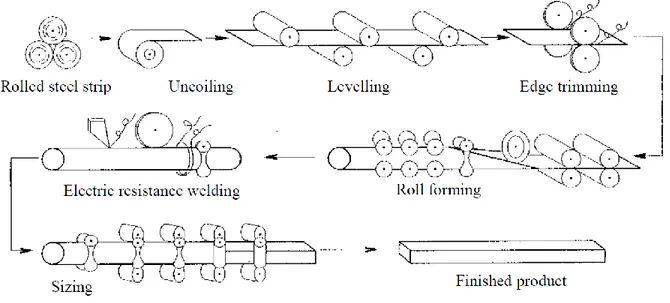
Cold-formed square hollow structural sections (HSS) are commonly used for compression members such as columns, truss members and bracing members of building structures. Today's manufacturing methods for cold-formed steel HSS profiles involve a forming process by continuous rolling as shown Figure 1-1. In the first stage, a steel plate is bent to create a circular hollow section (CHS) and welded together. For rectangular hollow sections (RHS) and square hollow sections (SHS), a second rolling stage is performed to transform the CHS into the desired rectangular or square shape. In the second stage, additional cold working is induced to create the flat walls and sharp 90° corners of the final cross-section shape.
Figure 1-1: Cold-rolled forming process of cold-formed hollow structural members (Wilkinson, 1999)
Various investigations have shown that "cold-formed steel is subject to strain hardening of the material; this increases the yield strength and, in most cases, also the ultimate tensile stress, at the expense of some reduction in ductility" (Britvec et al., 1970). As noted in the same reference, "structural economy can be improved if the design of such members is based on the as-formed properties, rather than on the properties of the flat sheet, strip, or plate before forming". Britvec et
al. (1970) performed a comprehensive study that led to an equation that accounts for the strain-hardening effects on the yield strength of cold-formed steel profiles. This equation is still in use in the CSA S136 standard for the design of cold-formed steel structural members (CSA, 2016). In Canada, the design of cold-formed HSS members is however performed in accordance with the CSA S16 standard for the design of steel structures (CSA 2014). In this standard, the factored tensile and compressive resistances of HSSs, Tr and Cr, respectively, are based on the nominal steel
yield strength, Fy, and there is no equation to account for increased yield strength from cold
forming. In standards regulating the fabrication of HSS members such as the general requirement for rolled or welded steel (CSA 2004; ASTM 2003 and ASTM 2013), minimum yield strength requirements for rectangular and square HSSs are verified by means of tensile tests performed on coupons taken at mid-width of the walls. Hence, the design of these HSS members does not account for the likely higher yield strength present in the sharp 90° corners from cold working done in the second rolling stage. Cold forming of HSSs also induces significant residual stresses in the longitudinal direction as well as in the transverse directions. Despite residual stresses in HSS and W-shapes are very different, the compressive resistance of cold-formed HSS members in CSA S16 is determined with the equation originally developed for W-shapes, as was proposed by Davison and Birkemoe (1983) from numerical and experimental investigations.
Hollow structural sections producers however take advantage of cold forming effects on yield strength as they generally use plate material exhibiting lower yield strengths and rely on strain hardening to satisfy the required minimum yield strength requirement in the finished tube1. Hence, the specified minimum yield strength used in design should be representative of the actual yield strength present on the perimeter of CHSs and walls of SHSs and RHSs while underestimating the yield strength in the corners of SHSs and RHSs. In practice, however, because the extent of cold forming and its effects on Fy vary with the plate thickness and the size of the cross-sections, yield
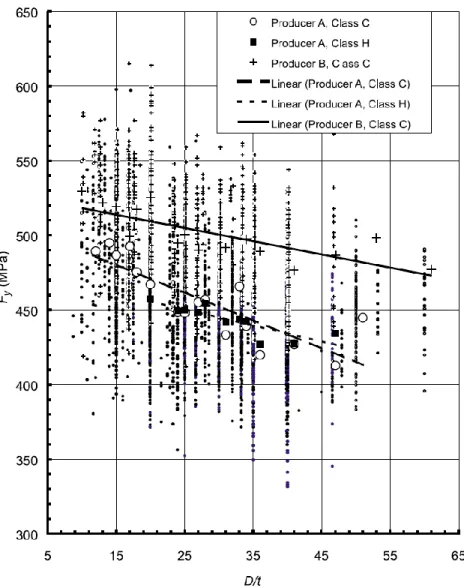
strengths measured on the perimeters of CHSs and walls of SHSs and RHSs still vary significantly between producers and as a function of the section size, as revealed by the survey done by Schmidt and Bartlett (2002a) for CSA G40.21-350W HSSs. This is shown in Figure 1-2.
Figure 1-2: Measure yield strength for cold-formed HSS members (Schmidt & Bartlett, 2002a) In Figure 1-2, the parameter D used in the D/t ratio for SHS and RHS is the equivalent diameter taken equal to 2(b+d)/(). The plots show that Fy typically greatly exceeds the 350 MPa minimum
yield strength value and Fy generally increases for stockier sections (smaller D/t) requiring more
pronounced cold working.
When designing for HSS members for non-seismic loads the Fy increase due to cold-forming is ignored. This results in a non-optimized design. In seismic force resisting systems, CHS and SHS profiles are commonly used as bracing members for concentrically braced steel frames. CBFs can be designed as Type MD (moderately ductile) or Type LD (limited ductility) category. In CSA S16, CBFs of these two categories must be designed and detailed such that seismic input energy can be dissipated through tensile yielding and inelastic buckling of the bracing members. The
bracing members must therefore be detailed to achieve this inelastic response. Moreover, design forces for brace connections, beams and columns are based on lateral loads required to attain the probable tensile and compressive resistances of the bracing members, Tu and Cu, respectively. It is
therefore important to properly account for the increase of yield strength due to cold forming and residual stress effects on axial resistances when using cold-formed HSS profiles.
This is not the case in current practice. In CSA S16, the probable yield strength, RyFy that must be used to determine probable brace resistances in seismic design is set to 460 MPa, i.e. a value that approximately corresponds to the average Fy in the survey by Schmidt and Bartlett (2002). It does
not account for the variation with the D/t ratio. For SHSs and RHSs, the value is based on tensile tests performed on coupons taken from the HSS walls and does not account for the greater Fy
expected in the HSS corners.
For SHS and RHS members, it would be possible to obtain more uniform and economical designs in seismic applications if the increase in yield strength was taken into account for the calculation of Tr and Cr through an equation like the one available in the CSA S136 standard. The CSA S136 equation was developed based on tests conducted on very thin channels made from low yield material (260 MPa) fabricated by break forming. It may therefore not reflect Fy values resulting
from today's continuous rolling methods, steel grades and HSS profiles currently used for construction with thickness up to 22.5 mm. Similarly, the study by Davison and Birkemoe (1983) was likely performed on HSS members that were not manufactured using current forming processes. More realistic values for Cr could therefore be obtained if actual residual stress
conditions were taken into account in the equations used in CSA S16. For seismic design, safer design would be achieved if the actual yield strength and residual stress properties were considered in the calculation of the probable tensile resistance Tu and probable compressive resistance Cu
specified in CSA S16 for cold-formed HSS bracing members.
In Canada, the industry often substitutes CSA G40.21 HSS with ASTM A500 tubing. The latter are fabricated using less stringent tolerances and lower strength material. Recently, a new ASTM standard, A1085, was developed in the U.S. for HSS profiles. The requirements in this standard are comparable to those specified for CSA G40.21-350W HSS, except that a maximum yield strength value of 485 MPa is specified. It is expected that the industry will eventually adopt this new standard. Meanwhile, CSA G40.21 and ASTM A500 will still be in use in Canada. Hence, a
study on HSS properties should examine products manufactured in accordance with these three standards.
1.2 Problem statement
Due to the significant increase in actual yield strength of the HSS bracing members, it is believed that the factored resistance Tr for seismic design may not be appropriate and should be improved. In addition, the probable resistance of HSS bracing members in concentrically braced seismic resisting systems proposed by current seismic design provisions (CSA S16) is not representative of the actual strength of the member. This probable resistance is taken from mill certificates that are based on the strength of a coupon taken from the mid-section. It is assumed a yield strength gradient is present across the full cross-section due to the strain hardening of the material. The corners also undergo greater cold work than the flat wall. This significantly increases their yield strength compared to the rest of the cross-section. In addition, the final properties of the member due to the cold-forming process are highly dependant on the equipment, usage, calibration and the virgin coil which also exhibits non-uniform properties. This leads to a very large variation in the
Fy of the mid-section coupon. The CSA S136 standard presents an equation which can be used to estimate the yield strength of the corners. However, this equation was developed for a much thinner material that was cold-formed using different processes compared with what is done to manufacture HSS today. The CSA S16 standard does not account for the increased yield strength from the corners. Residual stresses are not directly accounted for either as the column strength of cold-formed members is based on an equation originally developed for W-shapes which exhibit a very different residual stress pattern. Since the seismic design provisions in the CSA S16 standard are based on capacity design, this means the actual forces in the beams, columns and other members are associated with tension yielding or compression buckling of the HSS braces. In addition, the North American industry has been moving from ASTM A500 steel grades to ASTM A1085 and CSA G40.20/G40.21 steel grades which show more consistent properties.
1.3 Objectives and scope of research
The goal of this investigation is to propose new values for the factored tensile resistance Tr and for the probable resistances Tu (gross yielding) and Cu that should be used for HSS bracing members used for the seismic design of Type MD and Type LD steel CBFs. These new values should account
for the variability in the yield strength of HSS members currently used for construction. For SHS and RHS, it must also account for the yield strength gradients across the walls, the increase in yield strength in the corners and the actual residual stress distribution.
1.4 Methodology
The following steps are taken to obtain an accurate model of the actual yield strength gradient and residual stress distribution of a HSS bracing member:
• Review available literature on material properties of cold-formed members.
• Determine representative yield strength and residual stress theoretical models based on previous investigations.
• Compile yield strength values from mill certificates from North American manufacturers. • Perform a statistical analysis of the test results and propose reasonable magnitudes and
distribution for the yield strength and residual stress gradients.
• Propose a final yield strength and residual stress distribution model to determine the strength of cold-formed HSS bracing members.
The following steps are taken to study the effect of the actual tensile and compressive resistances of HSS bracing members:
• Determine the average probable tensile resistance RyFy of HSS bracing members from the proposed model and the CSA S136 equation to be used to calculate Tu and Cu.
• Perform a reliability analysis to determine the nominal yield strength that should be used for the factored tension resistance 𝑇𝑟 of HSS bracing members.
• Design sample braced frames to determine the most common HSS sizes being used in low-rise buildings in Canada and examine the possible savings that can be gained from accounting for the actual yield strength in design.
• Develop an OpenSees model of SHS bracing members that accounts for the increased yield strength in the corners, the yield strength gradient across the flat walls and the actual residual stress distribution.
• Perform a parametric study on several A1085 HSS bracing members to assess the impact of the actual yield strength and residual stresses on their compressive resistances with respect to Canadian column strength curves.
• Propose recommendations with respect to Tr, Tu and Cu for tensile and compressive resistances of cold-formed HSS bracing members to be used for seismic design.
1.5 Outline of thesis
This investigation is composed of the five following chapters. Chapter 1 presents the introduction, objectives and the problem addressed in this thesis. Chapter 2 presents an comprehensive literature review which summarizes research into cold-formed members over the past 60 years. The review is centered around the material properties of these sections, specifically the yield strength and residual stresses. Chapter 3 provides a statistical analysis of experimental values determined from the reviewed literature in Chapter 2 and mill certificates from North American manufacturers. Different steel grades are compared. A detailed yield strength and residual stress model is proposed for numerical modelling. Average factored tension resistance values are obtained from a reliability analysis. An economic study is performed in Chapter 4 based on assumed 𝐹𝑦 and 𝑅𝑦𝐹𝑦 values. Expected weight saving are evaluated for typical concentrically braced frames with SHS braces for low-rise buildings in Canada. The most commonly used sections are identified based on these analyses. A parametric study is then performed to determine the impact of an increased yield strength and residual stress distribution on Canadian column compression design curves. Chapter 5 presents the conclusion and recommendations of this thesis.
CHAPTER 2
LITERATURE REVIEW
This chapter provides a comprehensive review of the literature of cold-formed members over the past 60 years. It is mostly centered on the material properties such as the yield strength and residual stress of the cold-formed HSS members. It is separated in four sections; each section approximately covers two decades. Each section has an introduction and a summary to facilitate the reading. The reviewed articles are presented in the introduction and a short overview of the findings for each treated article is presented in the summary. A conclusion is also presented at the end of this chapter where the main findings from the full chapter are reported. The S136-16 standard equation developed in the 1960s to account for the increased yield strength from cold work of forming is presented in the first Section 2.1 of this review. The first residual stress and yield strength gradient models that were proposed in the late 1960s to the early 1980s are discussed in the second Section 2.2. A more detailed residual stress model that was proposed in the 1990s is presented in the third Section 2.3 and the differences with respect to the model presented in Section 2.2 are explained. In the final Section 2.4, investigations performed in the past 20 years are presented and their findings are compared to the first three sections.
2.1 Accounting for the increased yield strength from cold work of
forming according to the S136-16 standard
The first major research effort into the increased yield strength of cold-formed members was undertaken by Britvec, Chajes, Karren and Winter during a sponsored investigation by the American Iron and Steel Institute at Cornell University, New York. The goal of this investigation was to determine the as-formed properties of cold-formed sections. Since these properties are different from the original plate used to form the member, Britvec et al. state that accounting for these changes would improve the structural economy of the project. In 1970, a condensed account of this investigation was published to constitute the basis of the provisions for the 1968 edition of the Specification for the Design of Cold-Formed Steel Structural Members. The four papers listed below were summarized in this account (Britvec et al., 1970):
• Effects of Cold-Straining on Structural Sheet Steels (Chajes et al., 1963). • Corner Properties of Cold-Formed Steel Shapes (Karren, 1967).
• Effects of Cold-Forming on Light-Gage Steel Members (Karren & Winter, 1967). • Cold-Forming Effects in Thin-Walled Steel Members (Uribe & Winter, 1969).
In 2016, the current Specification for the Design of Cold-Formed Steel Structural Members (CSA S136-16) still permits to account for the strength increase in cold-formed members based on the same equation as proposed in 1968. This section gives a summary of the research leading to equation (2-1) which is referred to as equation (C-A7.2-1) in the CSA S136-16 standard.
𝐹𝑦𝑐 𝐹𝑦𝑣 = 𝐵𝑐 (𝑅𝑡 ) 𝑚 (2-1) F𝑦𝑐 F𝑦𝑣 = 𝐵𝑐 (𝑅𝑡 )𝑚 𝐵𝑐 = 3.69 𝐹𝑢𝑣 𝐹𝑦𝑣 − 0.819 (𝐹𝑢𝑣 𝐹𝑦𝑣 ) 2 − 1.79 𝑚 = 0.192𝐹𝑢𝑣 𝐹𝑦𝑣 − 0.068
The basic theory behind uniform cold stretching is established in the first paper (Chajes et al., 1963). The second paper proposes mathematical formulations to account for the yield strength increase in corners based on virgin properties of the coil. The third paper compares experimental results on a sectioned channel to full section tensile tests and proposes a method to account for the increased yield strength in the full section. The fourth paper was not included as it concentrated on joist cords and was exterior the scope of this investigation.
As it is explained by (Chajes et al., 1963), previous research had already shown that corners in light-gage steel sections exhibit increased yield strength through testing of corner. However, no theory was proposed to explain this. Therefore, it was judged necessary, by Chajes et al., to understand the basic theory behind uniform stretching before tackling the corners. This objective was set in the fist paper titled “Effects of Cold-Straining on Structural Sheet Steels” (Chajes et al., 1963).
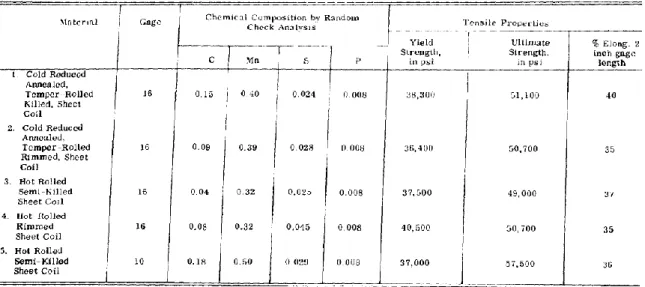
To achieve this, light-gage steel sheets from mild carbon structural steel were subjected to uniform cold stretching. (Chajes et al., 1963) tested a total of five different types of mind carbon which were extracted from the straightened coil used to further produce structural members. Table 2-1
presents the chemical composition of the tested sheets and Figure 2-1 shows the coupons taken from the coil. It is important to note (Chajes et al., 1963) refer to the specimens in the axial direction of the future member as transverse specimens.
Table 2-1: Material properties (Chajes et al., 1963)
Figure 2-1: Plate used in cold stretching operation and typical tensile and compressive specimens (Chajes et al., 1963)
(Chajes et al., 1963) performed both tensile and compressive tests on the coupons to determine the stress-strain curve after plastically deforming the coil sheet to various degrees. Figure 2-2 presents the typical stress-strain curve obtained from the tested coupons. The results available in the report show there was an increase in yield strength in both tensile and compressive coupons in both directions except for the cold-reduced killed steel. However, Britvec et al. found the increase is strongly dependent on the amount of cold work done and does not display the same increase in all directions.
Figure 2-2 :Typical stress-strain curve for tested coils (Chajes et al., 1963)
For example, as reported by Chajes et al. (1963), the 10-gage hot rolled semi-killed steel had an 89% tensile yield strength increase from the virgin coil in the longitudinal direction and about half in the transverse direction (axial direction of future specimen) for 10% of cold stretching. The opposite is seen in compressive specimens with a significantly higher increase in the transverse direction compared to the longitudinal direction. Britvec et al. attributed these variations to the Bauschinger effect in the longitudinal direction and the inverse Bauschinger effect in the transverse direction.
The authors (Chajes et al., 1963) further studied the effects of the ultimate to yield strength ratio and aging of the material. It is reported that a higher ultimate to yield strength ratio will result in a higher yield strength increase. Aging of the material will also result in an increase of yield strength
for all steels except for the cold reduced killed steel. An important secondary effect of aging noted by Chajes et al. (1963) is the recovery of the well-defined yield point of mild steel. Figure 2-3 illustrates this effect. The dashed line represents the specimen right after cold stretching while the solid line represents the specimens after being aged at 100°C for 30 min. Nevertheless, it is reported not all specimens recovered the yield plateau as it was strongly dependent on manufacturing type and chemical composition.
Figure 2-3: Aging effects on hot rolled semi-killed steel (Chajes et al., 1963)
Just as the increase in yield strength, Chajes et al. (1963) found the increase in ultimate tensile stress is strongly dependent on the amount of cold stretching. However, this increase is significantly less than the increase in yield strength. Most sheets displayed an increase in ultimate tensile stress of about 10% while the cold reduced killed steel had no increase at all. In addition, this increase is fully attributed to strain aging and not strain hardening by which the difference between the killed reduced steel and the rest is explained.
To continue, Chajes et al. (1963) examined the percentage of elongation which showed a significant decrease with increasing stretching. Once again, it was found the killed cold reduced steel was the only exception with a significant smaller reduction. For a 10% permanent elongation, the percentage elongation decreased from 35 to 12%. This reduction in ductility was attributed to strain hardening and aging of the material. This is justified in the investigation by the cold reduced killed non-aging steel only showing a decrease of 9% to the same 10% permanent elongation.
The second part of the investigation performed in Cornell University consisted in developing a method to predict the yield strength of cold-formed corners from the yield strength of the virgin material. This was achieved in the paper titled “Corner Properties of Cold-Formed Steel Shapes” (Karren, 1967). To this end, the virgin tensile and compressive properties of an un-straightened coil sheet and the as-formed properties of corners were determined. (Karren, 1967) does not specify the actual shapes of the profiles that the coil was used for. However, they do specify the forming process that was used to create the corner (roll formed, press-braked, and coin press-braked) as well as the a/t ratio which represents the interior corner radius to thickness ratio. The chemical properties of the materials are also described with an added four additional carbon steels to the ones studied in the first paper. In parallel, Karren developed an analytical model for the yield strength of the corner. To verify their model, they compared the analytical results to the experimental ones and concluded they were in reasonable agreement. A short overview of the development of the model is presented below.
Karren (1967) assumed the strain hardening function can be expressed by the power function in equation (2-2).
σ = 𝑘(ε)𝑛 (2-2)
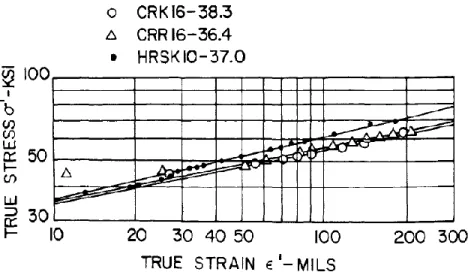
As long as the logarithmic plot of the stress-strain curve is linear, equation (2-2) can be simplified to equation (2-3) for uniaxial tension expressed in terms of true stress and strain. Figure 2-2 shows the tensile stress-strain curves of the virgin materials confirming the applicability of this equation (Karren, 1967).
Figure 2-4: Tensile stress-strain curves of virgin materials in terms of true stress and true strain (Karren, 1967)
The factors k and n were determined experimentally and are related to the virgin ultimate tensile stress and the virgin yield stress by equations (2-4) and (2-5) developed by Karren.
𝑘 = 2.8σ𝑢− 1.55σ𝑦 (2-4)
𝑛 = 0.225σ𝑢 σ𝑦
− 0.120 (2-5)
Once the factors were established, it was necessary define the circumferential strain at any point of the corner for a simplified model. The model assumes uniform curvature and tangential strain. The following assumptions were posed by Karren (1967) to simplify the model:
• Isotropic material under plastic conditions.
• Elastic strains are negligible in comparison to plastic ones. • Shearing stresses cause plastic deformations, not normal stresses. • Ratios of principal strains remain constant.
• Principal axes do not rotate with respect to the element. • Same tensile and compressive stresses in terms of true stress. • No Bauschinger effect is present.
By applying these simplifications, Karren (1967) developed the following relationship for the circumferential strain (also named tangential strain) in equation (2-6).
ε𝜃 = 𝑙 − l𝑜 l𝑜 = 𝑟 − r𝑜 r𝑜 = 𝑟 r𝑜− 1 (2-6)
Further simplifying the equation and applying the assumptions Karren (1967) presented the generalized strain in equation (2-7).
ε = 2 √3ln (1 + ε𝜃) = 2 √3ln 𝑟 r𝑜 (2-7)
Where ro represents the radius to the fiber of zero strain, r is the exterior radius of the corner, and
εθ is the engineering strain in the tangential direction.
An important assumption for this model that contradicts findings from the previous paper is the removal of the inverse Bauschinger effect. Karren (1967) explains this by stating that “the increase
in tensile yield strength in the longitudinal direction from a compressive plastic strain in the tangential direction is offset by the reduction from the equal tensile plastic strain in the radial direction” (Britvec et al., 1970, p.70). Previous experimental research is also referred to confirm
this affirmation.
Since the Bauschinger effect is absent, the overall yield strength will be the weighted average of the yield strength of all fibers composing the corner. Since the equation for the generalized strain has been developed and confirmed by experimental values, it is simply necessarily to apply it to the stress-strain equation for uniaxial tension and integrate it over the corner area. Through some mathematical simplifications and the previously defined assumptions Karren (1967) obtained the relationship in equation (2-8). Further details of the calculations can be found in Karren’s paper.
σ𝑦𝑐 = 𝑘𝑏
(𝑎𝑡 )𝑚
(2-8)
𝑏 = 0.945 − 1.315𝑛 𝑚 = 0.803𝑛