HAL Id: hal-00409090
https://hal.archives-ouvertes.fr/hal-00409090
Submitted on 5 Aug 2009HAL is a multi-disciplinary open access
archive for the deposit and dissemination of sci-entific research documents, whether they are pub-lished or not. The documents may come from teaching and research institutions in France or abroad, or from public or private research centers.
L’archive ouverte pluridisciplinaire HAL, est destinée au dépôt et à la diffusion de documents scientifiques de niveau recherche, publiés ou non, émanant des établissements d’enseignement et de recherche français ou étrangers, des laboratoires publics ou privés.
Friction-corrosion of AISI 316L/bone cement and AISI
316L/PMMA contacts: ionic strength effect on
tribological behaviour
Jean Geringer, Fouad Atmani, Bernard Forest
To cite this version:
Jean Geringer, Fouad Atmani, Bernard Forest. Friction-corrosion of AISI 316L/bone cement and AISI 316L/PMMA contacts: ionic strength effect on tribological behaviour. Wear, Elsevier, 2009, 267 (5-8), pp.763-769. �10.1016/j.wear.2008.12.087�. �hal-00409090�
* Corresponding author. Tel.: +33 477 426 688;
1
Friction-corrosion of AISI 316L/bone cement and AISI
316L/PMMA contacts: ionic strength effect on tribological
behaviour
J. Geringer
a*, F. Atmani
a, B. Forest
aa
Ecole Nationale Supérieure des Mines de Saint-Etienne, CIS, B2M, UMR CNRS 5146, 158, cours Fauriel F-42023 Saint-Etienne Cedex 2
Received Date Line (to be inserted by Production) (8 pt)
Abstract
Wear phenomena understanding of implants is a challenge: friction-corrosion of biomaterials, which constitute orthopaedic implants, is a significant issue concerning the aseptic loosening. This work aims at studying AISI 316L/bone cement friction which is a tribological problem related to hip joint cemented prostheses. This study focuses on the ionic strength effect on the tribological behaviour of 316L/bone cement and 316L/PMMA contacts. PMMA, poly(methylmethacrylate), can be considered as a model material for bone cement because of vicinity of mechanical properties and PMMA transparency. Pin on disk friction tests were investigated, in different media with NaCl concentration increasing. Friction coefficient and free corrosion potential of 316L sample were monitored. Moreover, SEM-FEG and microraman spectroscopy analyses were investigated on samples surfaces. Friction coefficient evolution according to ionic strength, for 316L/bone cement and 316L/PMMA contacts, are opposite. Indeed, when the ionic strength increases, the friction coefficient growths (decreases), for 316L/PMMA contact (for 316L/bone cement contact). The free corrosion potential decreases in both cases but more drastically for 316L/PMMA contact with ionic strength increasing. One might suggest that ions adsorption on 316L and PMMA surfaces involves attraction between surfaces in contact. On the contrary, ions adsorption on bone cement has no effect in terms of surface attraction forces, the gap between surfaces is too big due to roughness of bone cement. If ions concentration increases, the tribofilm viscosity between 316L and bone cement could increase. Attraction forces between surfaces are the less significant phenomenon compared to lubricant effect of tribofilm, 316L/bone cement contact. SEM-FEG analysis highlighted principally deep grooves on 316L surface, corrosive wear after destruction of passive film by friction. Finally microraman spectroscopy results, on metal surface, show principally Fe3O4 and Cr2O3 oxides deposits. Further investigations are in progress for
understanding surfaces interactions during friction.
Keywords: Friction-corrosion, AISI 316L, Bone cement, PMMA, Ionic strength
1. Introduction
Lifetime of orthopaedic implants is a health issue because of people ageing. 800,000 hip prostheses are implanted in Europe and the same order of magnitude in USA. Two ways of implanting femoral stems are available. First, femoral stem can be inserted in the femoral bone. Second, it can be inserted with bone cement between material constituting femoral stem and bone. Sir John Charnley was the first surgeon who fixed a femoral
stem with a bone cement based on poly (methylmethacrylate) composition [1]. Numerous formulae of acrylic polymers and co-polymers have been developed since 70’s [2].
The cemented hip replacement allows tolerating not precise placement. Moreover, mechanical properties between stem materials, for instance AISI 316L, and bone cement are drastically different. After the implantation, stem and cement are composites materials. Stiffest material, metal, bears most of the load and the upper part of the femoral bone is unloaded, stress shielding phenomena. The bone cement layer plays the role of ‘bumper’ between metal and bone. It levels the peaks force during human gait. Unfortunately, the bone cement causes problems because of polymerization step in human body, temperature increase, and debonding between metal stem and plastic bone cement, due to stress shielding too. Investigating the load transfer at the interface is a challenging goal because hip implants lifetime depends on this phenomenon [3].
After debonding, fretting, friction under small displacements, occurs. The displacements amplitude is, approximately, equal to 50 µm. It depends on the stem zone [4,5]. Calculations were made with contact femoral stem made of metal alloy and bone. As mechanical properties of bone are close to the ones of bone cement, one might expect that displacement for 316L/bone cement contact is close to the one of 316L/femoral bone contact. These low amplitude micromotions occur at the stem-cement interface in vitro [6].
Many investigations were carried out to understand the particular fretting between bone cement and 316L in a physiological liquid. It is worth noting that poly(methylmethacrylate), PMMA, mechanical properties are similar to the ones of bone cement except the porosity. Due to the PMMA transparency, studying the 316L/PMMA fretting provides additional scientific comments compared to bone cement/316L contact [7,8]. Moreover, different assumptions have been mentioned to link experimental describing and physical phenomena occurring during fretting. This work focuses on understanding attraction and repulsion phenomena according to solution composition changes. One paid attention on electrokinetical potential submitted to ions charges of the so-called electrical double layer on the materials surface [9]. During fretting, numerous phenomena are involved for constituting the nanometric lubricant film between two materials in contact: for instance, ions concentrations of the medium, iron and protons concentrations due to metal corrosion, hydrogen release (specific to fretting degradation), etc.
Fretting degradations involve high corrosion rate of metal and hydrogen release compared to friction. To separate numerous parameters contribution, it has been decided to investigate friction corrosion of 316L against PMMA and bone cement in Ringer solution and in 1:1 ions solutions, i.e. solutions constituting with NaCl. This medium is simplified compared to physiological liquid. The phenomena interpretation is too complex when one considers physiological liquid, it means that proteins and many different ions act for constituting the double layer on materials surface. It is the reason why only Ringer and NaCl solutions were investigated; ionic strength,
2 i i i
I
=
∑
z C
, will be controlled. 2 i i iI
=
∑
z C
This study aims at investigating and understanding ionic strength effect, following friction coefficient during friction tests. Many friction tests were carried out with biomaterials in different solutions. However, the friction coefficient could differ according to the ionic concentration of the friction medium. Highlighting the ionic strength role in wear tests could be an interesting point of view to better understand the solution composition effect. Moreover, the ionic strength could play a role concerning the double layer constitution and finally the attraction –repulsion mechanisms during friction.
2. Test materials and experimental techniques
2.1. Materials and tests specimens
The AISI 316L SS (Z2CND17-12), medical quality, is a stainless steel with improved cleanliness and very low carbon content, chemical composition in Table 1. Manufacturing this alloy was in conformity with ISO standards 5832-1.
Elements Cr Ni Mo Mn Si Cu C P S Fe
Composition (% w/w) 17.40 13.00 2.60 1.73 0.66 0.10 0.02 0.02 <0.01 Bal.
Table 1: chemical composition of 316L stainless steel
The metallic sample was a disk of 35 mm diameter and 5 mm thickness. Polishing of the face in contact with the solution was carried out thanks to grid paper from 380 to 4000, diamond solution from 3 µm to ¼ µm. Finally the last step was polishing with colloidal silica, particles of 0.06 µm diameter. AISI 316L SS samples were washed in ultrasonic bath with ethanol and rinsed with desionised water.
PMMA, thermoplastic material, Perspex®, was polished with diamond solution from 3 µm to ¼ µm and
colloidal silica. Samples were washed with Neutracon Deacon® soap and rinsed with desionised water. PMMA
and bone cement sample were parallelepipeds of 6x6x12 mm. Only the face of 6x6 mm was polished.
Bone cement was Palacos R40®. A specific mould made of polyethylene has been used to manufacture
samples. Due to porosity, samples were not polished because pores play the role of diamond solution tank during friction process.
2.2. Mechanical properties
Mechanical properties Poisson’s ratio Young’s modulus (GPa) Yield stress (MPa) Ultimate tensile strength (MPa) KIC (MPa. m ) Hardness 316L 0.30 197 280 635 55 155 (Vickers) PMMA 0.39 2.5 65 75 1.3 21 (µVickers) Bone cement 0.38-0.46*** 2.5* 24-60* 1.51**
Table 2: mechanical properties of tested materials, * [10], ** [11], *** [12], the other values were obtained by appropriated
tests.
Mechanical properties analysis highlights friction tests, i.e. 316L/PMMA or 316L/bone cement, were carried out with hard, stainless steel, and soft materials, PMMA and bone cement.
2.3. Friction device
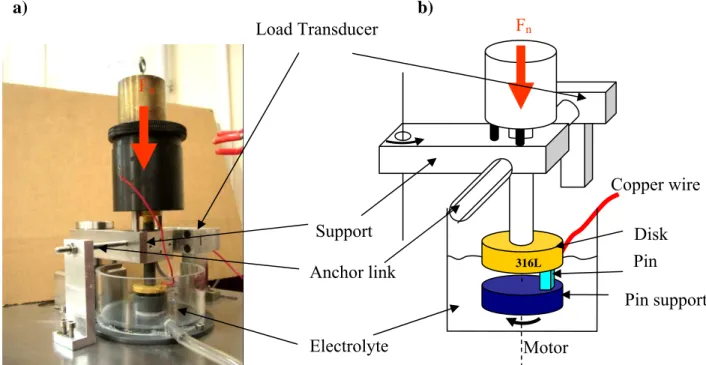
The friction device is shown on Figure 1. Normal load equal to 19 N was applied by dint of calibrated rod fixed on the support. One paid attention on alignment and parallelism of pin support, disk and the support of the weight applying the normal load. The pin, made of PMMA or bone cement, was drastically pushed in the pin support to respect the alignment between pin and disk during friction test. According to the rotation direction of the pin, normally, the support would rotate in the opposite direction of the load transducer. It is the reason why an anchor link allows the very close contact between the support and the load transducer. Consequently, the actual tangential load, therefore the friction coefficient, was monitored when the pin is in front of the load transducer, i.e. the pin center is in front of the symmetry axis of the transducer.
F
nPin
N
316LElectrolyte
Load Transducer
Pin support
Copper wire
Anchor link
Support
a) b)
F
nMotor
Disk
It was calibrated and the linear evolution of load vs. voltage was verified (correlation coefficient, r2,
equal to 0.999). Voltage was monitored thanks to Agilent 34970A voltmeter. It is worth noting that the electrical insulating was a key point of the device to monitor the electrode potential made of stainless steel, only the face in contact with the pin was in contact with the solution, due to insulating paint on the other faces of the metal disk. The tests frequency was of 1 Hz, i.e. 1 round per minute for the pin.
2.4. Test solutions
To investigate the ionic strength effect during friction, the medium was a solution of NaCl from 10-3,
10-2, 10-1 to 1 mol.L-1, i.e a gap of three magnitude orders. From 10-3 to 1 mol.L-1, the ionic strength is equal to the
concentration for NaCl solution. Tests were carried out too with Ringer solution, Table 3; it was performed to simulate the physiological liquid. Ionic strength of the Ringer solution is of 1.53.10-1 mol.L-1.
NaCl KCl CaCl2, 2H2O NaHCO3
Concentration (g.L-1) 8.50 0.25 0.22 0.15
Table 3: composition of Ringer solution
Solutions were prepared from desionised water (18.2 MΩ.cm at 25 °C) and used at room temperature, 22 ± 2 °C, under natural aeration.
2.5. Experimental techniques
Roughness measurements were carried out on PMMA and 316L surfaces, with 2D Talysurf®
profilometer, over a length of 6 mm.
During friction, the free corrosion potential of stainless steel disk was monitored thanks to a Radiometer analytical PGP 201 potentiostat. The saturated calomel reference electrode (SCE) was employed as a potential reference, Eref equal to 244 mV at 25 °C.
Worn surfaces of stainless steel were observed with a classical Scanning Electron Microscope (SEM) JMS 840 JEOL. Worn surfaces of PMMA and debris on stainless steel were analyzed with a Scanning Electron Microscope with a Field Electron Gun (SEM-FEG) JEOL 6500. Analyses of PMMA surfaces and debris, with this apparatus, become possible because voltage is lower than the one of classical SEM.
Raman spectroscopy was investigated to characterize oxides on stainless steel produced by friction. Especially, the microraman spectroscopy, was performed using SenterraTM Raman spectrometer, Brucker. The
zone and thin oxides deposit, was Olympus BX series optical microscope. Raman Spectra allows identifying chemical and structural thin oxides films on stainless steel after friction tests. The space resolution of LASER beam is 15x15 µm2. It is worth noting that IR spectrometer with grazing incidence was investigated without
significant results.
3. Experimental results and discussion
3.1 Tests samples and Ra measurements
Friction tests were investigated for 5 solutions. For 316L-PMMA samples, 5 tests were carried out according to 5 different tests durations, i.e. 1,000, 5,000, 10,000, 20,000 and 80,000 seconds. Therefore, 25 friction tests were carried out. This road map allows testing repeatability of Ra, roughness, friction coefficient and free corrosion potential measurements. For 316L-bone cement, one test duration was of 80,000 seconds.
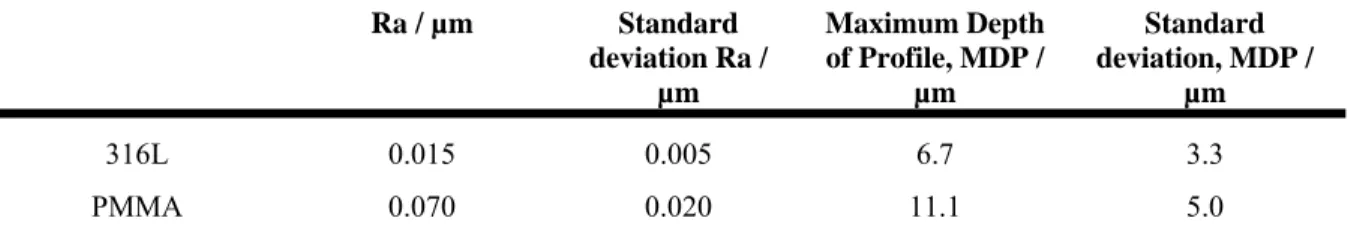
Table 4 presents roughness and the maximum depth of profile on materials friction surfaces, PMMA and AISI 316L stainless steel. It is worth noting that 316L roughness is lower than the value recommended by hip manufacturing ISO standards, 0.05 µm. Investigations were carried out to test roughness, Ra, and/or maximum depth of the profile, MDP, being account for evolution of friction coefficient. Ra and MDP have no significant effect on friction coefficient.
Ra of bone cement sample is of 2.5 ± 0.4 µm, mean of 4 samples.
Ra / µm Standard deviation Ra / µm Maximum Depth of Profile, MDP / µm Standard deviation, MDP / µm 316L 0.015 0.005 6.7 3.3 PMMA 0.070 0.020 11.1 5.0
Table 4: roughness, Ra, and maximum depth of profile, MDP on materials surfaces, PMMA and AISI 316L SS; means of 25 samples.
3.2. 316L/PMMA contact
3.2.1. Friction coefficient and Open Circuit Potential
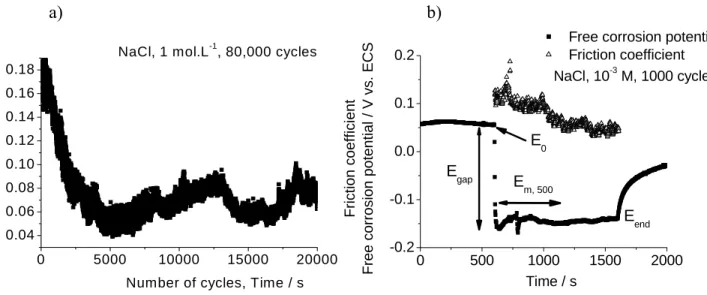
Figure 2 a) shows the typical evolution of friction coefficient vs. time for test duration of 80,000 cycles, NaCl concentration of 1 mol.L-1. At the test beginning, friction coefficient is higher than the one after 5,000 cycles due to the running-in period to accommodate surfaces in contact.
0 500 1000 1500 2000 -0.2 -0.1 0.0 0.1 0.2 E0 Eend Em, 500 Egap Frict ion c oef fi ci ent
Free corrosion potent
ial
/ V vs
. ECS
Time / s
Free corrosion potential Friction coefficient NaCl, 10-3 M, 1000 cycles 0 5000 10000 15000 20000 0.04 0.06 0.08 0.10 0.12 0.14 0.16 0.18 F ri c ti o n co e ffi ci e n t
Number of cycles, Time / s NaCl, 1 mol.L-1, 80,000 cycles
a) b)
Figure 2: a) friction coefficient variation according to the time, NaCl 1 mol.L-1 solution, 80,000 cycles of test, i.e. 80,000
seconds; b) free corrosion potential or Open Circuit Potential, OCP, and friction coefficient, NaCl 10-3 mol.L-1, 1,000 cycles of
test; E0: OCP at the friction beginning; Egap: OCP drop at the test beginning; Em, 500: mean value of OCP of 500 first seconds
during friction; Eend: OCP at the end of friction test; normal load is equal to 19 N.
Figure 2 b) highlights the free corrosion potential or open circuit potential, OCP, evolution according to the time. Friction coefficient is reported on the same graph. Test conditions were: NaCl concentration of 10-3
mol.L-1, test duration of 1,000 cycles. At the friction beginning, OCP falls to negative values. Due to degradation
of oxides film on stainless steel surface during friction, metal dissolution occurs, i.e. the anodic reaction. Oxygen is dissolved in solution, thus the cathodic reaction is the oxygen reduction. Finally, the mixed potential decreases. During friction, OCP is lower than the one before friction test. At the end of the test, the OCP increases up to the initial value before the test. Frequently, the final OCP was lower than E0. Due to mechanical degradations and
PMMA debris deposit, metal surface is different from the pristine surface.
According to results shown on figure 3, for each ionic strength, the mean value of the friction coefficient decreases when the test duration increases. At the friction beginning, the running-in period involves high dissipated energy between surfaces in contact. After 5,000 cycles of friction, debris are produced and the third body can play the role of bumper and lubricant interface. Consequently, the friction coefficient decreases. Moreover, the friction coefficient increases according to the ionic strength. One might expect attraction between surfaces in contact is better. Moreover, if ionic concentration growths, solution viscosity increases too. This phenomenon could be account for increasing of friction coefficient according to ionic strength.
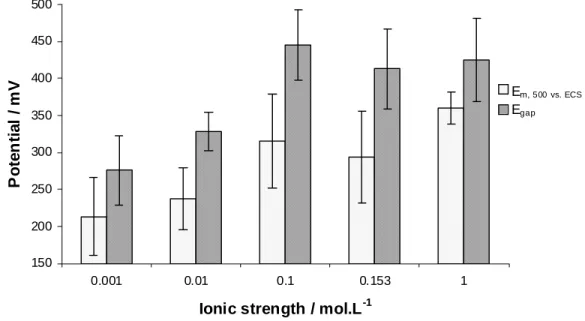
Figure 4 shows the mean value of open circuit potential during the 500 first cycles, Em, 500, and the drop
of free corrosion potential, Egap. It has been decided to present only these results, i.e. Em, 500 and Egap. Indeed, OCP
PMMA debris adsorption can perturb the OCP evolution due to debris barrier on 316L surface avoiding metal dissolution. 0.00 0.02 0.04 0.06 0.08 0.10 0.12 0.14 0.16 0.18 0.20 0.001 0.010 0.100 0.153 1.000
Ionic strength / mol.L
-1Fr
ic
ti
o
n
co
ef
fi
c
ient
1000 cycles 5000 cycles 10000 cycles 20000 cycles 80000 cyclesFigure 3: friction coefficient evolution according to the ionic strength for different tests durations; 1 cycle is equal to 1 second; mean values; the discrepancy corresponds to the standard deviation.
150 200 250 300 350 400 450 500 0.001 0.01 0.1 0.153 1
Ionic strength / mol.L-1
P o te n tia l / m V E m, 500 vs. ECS Egap
Figure 4: Em, 500, mean value of open circuit potential vs. ECS from the friction beginning to 500th cycle (absolute values);
Egap, OCP drop at the test beginning (absolute values); evolutions according to the ionic strength, the discrepancy corresponds
Em, 500 increases according to the ionic strength; the same evolution is shown for Egap. Egap is higher than
Em, 500. This difference is probably due to oxygen diffusion equilibrium concerning the kinetic of the cathodic
reaction.
This particular evolution of potential shift is in accordance with increasing of friction coefficient vs. ionic strength. The contact between surfaces, at high ionic strength, is closer than the one at low ionic strength. This attempt is consistent with the attraction phenomenon. If viscosity plays a role, the free corrosion potential does not decrease. The viscosity can not be account for oxides layer destruction. This conclusion was highlighted in [13].
Moreover, when chlorides concentration increases in a medium, the passive film of stainless steel is easily disrupted [14]. This phenomenon could be account too for increasing OCP drop when friction starts.
3.2.2. Microstructure surface observations
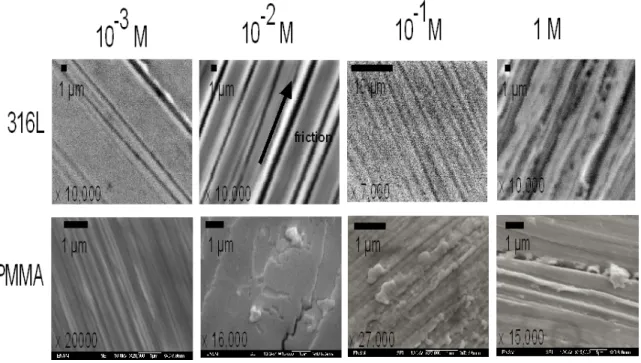
Figure 5 presents materials samples surfaces submitted to friction tests of 80,000 cycles. SEM images, for 316L samples, exhibit grooves, thickness of 1 mm, are more and more deep and inhomogeneous with the ionic strength increasing. These results are consistent with the friction coefficient and OCP increasing according to the ionic strength, as described above. It is worth noting that, at 1 M of NaCl concentration, the image shows degradations zones less localized than at 10-3 M. The corrosion damages are not localized in grooves, therefore
one might expect that more generalized corrosion occurs due to high chlorides concentration.
SEM-FEG images, PMMA samples, show degradations surfaces after 80,000 cycles. At 10-3 M, grooves
are thin, less than 1 µm. At 10-2 M, the PMMA surface exhibits debris plaques pulled out and a crack. These
elements point out the hypothesis that surfaces attraction forces, due to double layer composition, could be account for friction coefficient increasing. With ionic strength increasing, dissipated energy during friction is more and more high, thus cracks on polymers can occur. At 10-1 M, grooves are less and less homogeneous.
PMMA debris are produced from PMMA surface. At 1 M, grooves are deepest and third body is inserted in one of them.
PMMA degradations, figure 5, are too consistent with OCP and friction coefficient increasing. Images of Ringer solution tests will not be presented in this work. However, in a few words, it is worth noting that
degradations on PMMA and 316L are more difficult to figure out. Due to multiple ions in Ringer solution, attraction and friction phenomena are difficult to identify.
3.2.3. Microraman spectroscopy on 316L surfaces
Identifying oxides layer on 316L surface after friction test was a goal of this tudy. Figure 6 a) shows an image obtained from microscope used with the microraman spectrometer. It exhibits rust on 316L surface. Figure 6 b) presents Raman spectra of pristine surface of 316L, i.e. without friction; P14, P15 and P17 zones, worn surfaces. Each spectrum highlights a particular oxides types. All spectra were interpreted according to reviewing and results provided by [16].
800 700 600 500 400 300 200 250 300 350 400 450 5000 6000 7000 8000 9000 10000 11000 149 244 684.5
b)
a)
219 276.5 385 488.5 647Figure 6: a) image obtained thanks to microscope before microraman spectrometry, scale unit is micrometer; b) microraman spectra from pristine 316L surface before friction and 3 zones, P14, P15 and P17 of worn 316L surfaces (test duration of
80,000 cycles and ionic strength of 10-3 mol.L-3); u.a: arbitrary unit.
Spectra were not complete to highlight main results. 316L pristine surface shows no typical oxides because of thin thickness of layer. P14 zone exhibits Fe3O4 (684.5 cm-1) and α-Fe2O3 (276.5 & 219 cm-1). P15
138 328 558.5 688.5 **** *** Ab sorb an ce / u.a Waves number cm-1 **
Pristine surface, oxides layer too thin * P14 Fe3O4 & Fe2O3 **
P15 FeCr2O4 & Fe3O4 & Cr2O3 amorphous ***
P17 Cr203 & FeCr2O4****
zone shows Cr2O3 (150, amorphous phase & 688.5 cm-1) or FeCr2O4 (688.5 cm-1) and Fe3O4. Da Cunha Belo et al.
suggests, due to laser power (higher than 6 mW), the following reaction can occur:
. The spectrum points out if FeCr2O4 is identified, α-Cr2O3 and
Fe3O4 were on 316L surface. These oxides were formed after metal dissolution. P17 zone exhibits same oxides
than P15 zone. The same oxides types were identified for 316L surface wearing by bone cement samples. Linking with orthopaedic fields, these oxides could be assimilated by bone cells around a femoral stem where friction occurs between stem and bone cement.
2 3 3 4 2 3 2 4
α-Cr O +Fe O
⎯⎯
→
α-Fe O +FeCr O
3.3. 316L/PMMA and 316L/bone cement contacts comparison
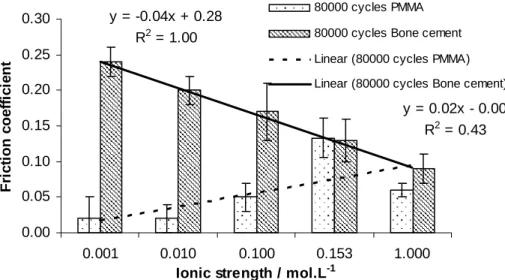
This work aims at understanding if friction behaviour of 316L/PMMA contact is the same than the one of 316L/bone cement contact. As PMMA was considered as a model material of bone cement, both contacts do involve the same friction behaviour? The figure 7 shows the behaviour is opposite. The friction coefficient of 316L/bone cement decreases according to the ionic strength. The contact pressure, in our tests, is of 1.58 MPa. It is worth noting that results of figure 7 are in the same order of magnitude of results from [15].
y = 0.02x - 0.00 R2 = 0.43 y = -0.04x + 0.28 R2 = 1.00 0.00 0.05 0.10 0.15 0.20 0.25 0.30 0.001 0.010 0.100 0.153 1.000
Ionic strength / mol.L-1
F ri c ti o n co e ffi ci en t 80000 cycles PMMA 80000 cycles Bone cement Linear (80000 cycles PMMA) Linear (80000 cycles Bone cement)
Figure 7: friction coefficient, mean value of 80,000 cycles, evolution vs. ionic strength for 316L/PMMA and 316L/bone cement contacts.
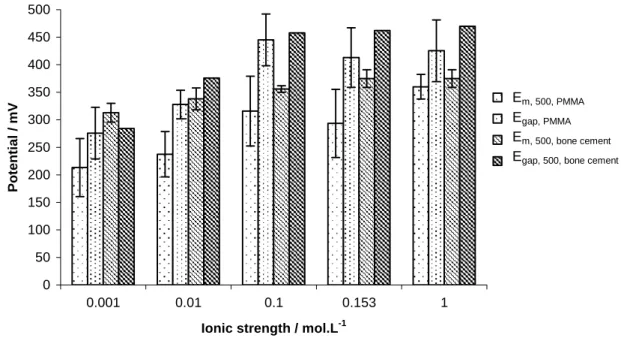
Moreover, the OCP evolution, figure 8, shows that 316L degradations, for 316L/bone cement, are more drastic than the ones, for 316L/PMMA contact. Egap or Em, 500 increases, for both contacts, according to the ionic
0 50 100 150 200 250 300 350 400 450 500 0.001 0.01 0.1 0.153 1
Ionic strength / mol.L-1
Po
tential / mV
Em, 500, PMMA
Egap, PMMA
Em, 500, bone cement Egap, 500, bone cement
Figure 8: Em, 500, mean value of open circuit potential vs. ECS from the friction beginning to 500th cycle (absolute values), the
standard deviation is calculated from 500 measured values; Egap, OCP drop at the test beginning (absolute values), the standard
deviation was calculated from all tests (1,000 to 80,000 cycles) 316L/PMMA, no standard deviation was calculated, only one test at 80,000 cycles was available for 316L/bone cement contact; evolutions according to the ionic strength.
One might expect that metal dissolution is submitted to chlorides concentration influence. Chlorides allow disrupting of passive films and promoting the metal dissolution due to driving force of metallic complexes forming. 316L OCP, 316L/bone cement contact, is slightly higher than the one of 316L/PMMA contact. Bone cement roughness could be account for this OCP drop increasing.
The friction coefficient evolution for 316L/PMMA could be governed by attraction forces between surfaces, under conditions of weak roughness. The point of zero charge, pH, of PMMA (316L) is equal to 3.8 [17] (7 [18]). Before this threshold, charges on surfaces are positive and negative otherwise. Between both values, PMMA surface charges are negative, protons are less attached on the surface, and 316L surface charges are positive, protons reside on surface. At the beginning of the test, solutions pH is controlled by H2CO3, carbonic
acid, and HCO3-, it means pH is close to 6. Consequently, electrostatic attraction forces occur. During friction,
from raman spectroscopy results, chromium and iron ions are dissolved and precipitated in oxides. Metal ions dissolution is account for pH decreasing. Thus, attraction forces are reinforced. Moreover, chlorides ions promote disrupting of oxides film and involve delay concerning the passive film rebuilding. These phenomena are consistent with higher metal ions dissolution, pH decreasing and higher attraction forces. Finally, the friction coefficient could increase according to chlorides concentration increasing. In this study, it is in accordance with ionic strength increasing. Otherwise, one may suggest ions concentration increasing of the bulk solution involves charge density on surface materials. Thus, attraction forces are promoted too.
The above attempts, about the point of zero charge between surfaces in contact, could play a role between third body particles and surfaces in contact. Colloids and oxides particles which constitute the third body could be considered as elements which allow attraction forces occurring. The more the corrosion occurs with chlorides concentration increasing, the more colloids and oxides particles are produced. Consequently the specific surface is higher than the one of a raw material surface. One may attempt this fact could be account for friction coefficient increasing. This hypothesis could be available if roughness, especially 316L roughness, is weak, i.e. less than 20 nm (approximate doube layer thickness) allowing electrostatic interactions with counter material, PMMA, and third body particles.
The 316L/bone cement behaviour is opposite. Ionic strength increasing involves friction coefficient decreasing. The first difference between both contacts is the roughness. Except contact between asperity peak of bone cement and 316L surface, attraction forces with the role of point of zero charge do not occur. The separation between both surfaces, due to high roughness, is too big to consider the electrostatic forces contribution. Chlorides concentration contribution is involved in the same way than the one of 316L/PMMA contact. OCP evolution according to the time, Figure 8, is the same for both contacts. Metal dissolution and pH decrease occur. As the distance between surfaces is too high, the third body particles quantity increases in accordance with chlorides concentration and ionic strength. Thus, the friction coefficient decreasing is related with wear and corrosive debris. Moreover pores play the role of debris tanks which may lubricate the contact.
It is worth noting these hypotheses do not consider charges generation due to friction. Physical phenomena may be described as following: mechanical contribution is account for passive film disrupting, corrosion promotes pH decreasing and charges changing and chlorides concentration involve charges density increasing on material surfaces. Finally, if roughness is weak, less than 20 nm, attraction forces are promoted; otherwise debris play the role of lubricant in the case of 316L/bone cement contact.
4. Conclusion
PMMA was considered as a model material of bone cement in previous studies under friction. PMMA was usually well polished to benefit from its transparency. On the contrary, bone cement sample were rough, in hip implantation conditions. 316L surfaces were well polished as femoral stem of hip prosthesis.
316L/PMMA and 316L/bone cement friction behaviour are similar in the terms of metal dissolution. OCP decreases when ionic strength increases. OCP drop, for 316L/bone cement, is higher than the one for 316L/PMMA. During friction test, high roughness of bone cement sample promotes oxides film disrupting, thus the metal dissolution and finally the OCP drops towards negative values. Moreover, chlorides concentration increasing involve disrupting of passive film and metal dissolution due to driving force of metal complexes forming.
Friction coefficient evolutions, for both contact types, are dissimilar. Friction coefficient of 316L/PMMA (bone cement) contact increases (decreases) when the ionic strength increases. One may suggest that attraction between 316L and PMMA could occur and is reinforced when ionic strength increases. Chlorides concentration increasing promote the passive film disrupting and pH decreasing due to metal dissolution. Due to low roughness, medium pH is related to the point of zero charge, electrostatic forces become efficient. Close to metal surface, pH is locally weak and these conditions highlighted attraction forces between metal surface and PMMA and third body and both materials. Consequently, the friction coefficient increases. When roughness is higher than 1 µm, for bone cement samples, no attraction between surfaces occurs. 316L/bone cement contact is submitted to lubricant effect of third body without electrostatic involvement. Additional investigations have to be carried out to better understand and to confirm hypotheses above.
Finally, concerning 316L/PMMA contact, microstructures analyses point out when the ionic strength increases, grooves on 316L and PMMA are more and more deep. Concerning 316L surfaces at 1 M of ionic strength, signs of generalized corrosion, as pittings, appear. According to tests conditions, 316L dissolution occurs and typical oxides were identified after friction thanks to microraman spectroscopy.
Additional works are in progress: same methodology with others 1:1 salts, Na2SO4 for comparison and
understanding chlorides contribution; investigating of fretting corrosion behaviour to understand attraction phenomenon between surfaces in contact; and modelling, in terms of disjoining pressure, attraction between surfaces in contact during friction.
Acknowledgements
The authors are grateful to J-C. Boulou, Bruker Optics, for the opportunity to interpret spectra provided by SenterraTM Raman spectrometer.
References
[1] K.D. Kühn, R. Specht, Le ciment acrylique osseux: historique, caractéristiques et propriétés physiques, Maîtrise orthopédique, 126 (2003) 6-13.
[2] G. Lewis, Properties of acrylic bone cement: State of the art review, Journal of Biomedical Materials Reserach Part B ; Applied Biomaterials, 38 (1997) 155-182.
[3] M.A. Perez, J. Grasa, J.M. Garcia-Aznar, J.A. Bea, M. Doblaré, Probabilistic analysis of the influence of the bonding degree of the stem-cement interface in the performance of cemented hip prostheses, Journal of Biomechanics 39 (2008) 1859-1872.
[4] PJ. Rubin, PF. Leyvraz, LR. Rakotomanana, Interet de la modelisation numerique dans l’évaluation pre-clinique d’une prothese femorale de hanche, Maîtrise orthopédique 93 (2000) 22-27.
[5] PJ. Rubin, RL Rakotomanana, PF. Leyvraz, PK Zysset, A Curnier, JH Heegaard, Frictionnal interface micromotions and anisotropic stress distribution in a femoral total hip component, Journal of Biomechanics 26 (1993) 725-739.
[6] H. Zhang, L.T. Brown, L.A. Blunt, X. Jiang, S.M. Barrans, Understanding initiation and propagation of fretting wear on the femoral stem in total hip replacement, Wear (2008) in press
[7] B. Trischler, B. Forest, J. Rieu, Fretting corrosion of materials for orthopaedic implants: a study of a metal/polymer contact in an artificial physiological medium, Tribology International 32 (1999) 587-596.
[8] J. Geringer, B. Forest, P. Combrade, Wear analysis of materials used as orthopaedic implants, Wear 261 (2006) 971-979.
[9] J. Geringer, B. Forest, P. Combrade, Fretting-corrosion of materials used as orthopaedic implants, Wear 259 (2005) 943-951.
[10] G. Lewis, S. Mladsi, Effect of sterilization method on properties of Palacos® R acrylic bone cement, Biomaterials 19 (2008) 117-124.
[11] G. Lewis, Apparent fracture toughness of acrylic bone cement: effect of test specimen configuration and sterilization method, Biomaterials 20 (1999) 69-78.
[12] J.F Orra, N.J Dunne, J.C Quinn, Shrinkage stresses in bone cement, Biomaterials 24 (2003) 2933-2940. [13] F.P Bowden, D. Tabor, The friction and lubrication of solids, Clarendon press, Oxford, 1986.
[14] D.D. Macdonald, Passivity-the key to our metals-based civilization, Pure Appl. Chem. 71 (1999) 951-978 [15] N. Nuno, R. Groppetti, N. Senin, Static coefficient of friction between stainless steel and PMMA used in cemented hip and knee implants, Clinical Biomechanics 21 (2006) 956–962
[16] M. Da Cunha Belo, M. Walls, N.E. Hakiki, J. Corset, E. Picquenard, G. Sagon, D. Noel, Composition structure and properties of the oxide films formed on the stainless steel 316L in a primary type PWR environment, Corrosion Science 40 (1998) 447-463.
[17] T. Pongprayoon, N. Yanumet, S. Sangthong, Surface behavior and film formation analysis of sisal fiber coated by poly(methyl methacrylate) ultrathin film, Colloids and Surfaces A: Physicochemical and Engineering Aspects 320 (2008) 130-137

![[PDF] Formation pour débutant dans le logiciel The gimp | Formation informatique](data:image/gif;base64,R0lGODlhAQABAIAAAP///wAAACH5BAEAAAAALAAAAAABAAEAAAICRAEAOw==)