ARTICLE
Social-environmental analysis of methane in the
South China Sea and bordering countries
Hsiao-Chun Tseng, Alice Newton, Chen-Tung Arthur Chen, Alberto V. Borges, and T. Angel DelValls
Abstract: This study is a preliminary assessment of the greenhouse effect of methane (CH4) emissions in the South China Sea (SCS) on human welfare using the driver-pressure-state-impact-response (DPSIR) framework and the systems approach framework (SAF). The SCS is surrounded by nations of the Asia-Pacific region that are currently experiencing rapid urbanization, industrialization, and economic growth, and is one of the most contested maritime areas of the world. Climate change may aggravate regional tensions, promote natural disasters, create climate refugees, and reduce food security by reducing the size of fish catches and crops. International environmental protection, as well as the mitigation of, and adaptation to, climate change not only protect environmental sustainability, but also provide an international platform of cooperation for all countries around the SCS. The study analyzed the economic drivers and human activities that cause the pressure on the environment and increase CH4emissions in the region. In addition, the possible future impact of climate change on human welfare is also discussed in the study. Finally, the study identified eight management responses across various spatial and temporal scales that can be useful in addressing the issue of greenhouse gas (CH4) in the SCS.
Key words: South China Sea, CH4, greenhouse gases, driver-pressure-state-impact-response,
systems approach framework.
1. Introduction
The Earth’s climate system is powered by solar radiation. Infrared radiation from the sun that is emitted from the Earth’s surface is largely absorbed by certain atmospheric constitu-ents: water vapor (H2O), carbon dioxide (CO2), methane (CH4), nitrous oxide (N2O), and other greenhouse gases (GHGs). Atmospheric GHGs retain the heat from the sun and insu-late the Earth. Human activities have a huge influence on the global carbon cycle. Since the industrial era, as the use of machinery has increased, demand for fossil fuels, Received 30 December 2017. Accepted 24 June 2018.
H.-C. Tseng. Institute of Marine Environment and Ecology, National Taiwan Ocean University, Keelung 202, Taiwan; CIMA, Campus de Gambelas, Universidade do Algarve, 8005-139 Faro, Portugal; Department of Oceanography, National Sun Yat-sen University, Kaohsiung 804, Taiwan; UNESCO UNITWIN/WiCop, Physical Chemistry Department, Faculty of Marine and Environmental Sciences, Polígono río San Pedro s/n, University of Cadiz, 11519, Puerto Real, Cadiz, Spain. A. Newton. CIMA, Campus de Gambelas, Universidade do Algarve, 8005-139 Faro, Portugal; NILU-IMPEC, Box 100, 2027 Kjeller, Norway.
C.-T. Arthur Chen. Department of Oceanography, National Sun Yat-sen University, Kaohsiung 804, Taiwan. A.V. Borges. Université de Liège, Unité d’Océanographie Chimique, Institut de Physique (B5), B-4000, Belgium.
T.A. DelValls. UNESCO UNITWIN/WiCop, Physical Chemistry Department, Faculty of Marine and Environmental Sciences, Polígono río San Pedro s/n, University of Cadiz, 11519, Puerto Real, Cadiz, Spain; Department of Ecotoxicology, Santa Cecília University (UNISANTA), Santos, São Paulo, Brazil.
Corresponding author: Chen-Tung Arthur Chen (e-mail:ctchen@mail.nsysu.edu.tw).
Copyright remains with the author(s) or their institution(s). This work is licensed under aCreative Commons Attribution 4.0 International License(CC BY 4.0), which permits unrestricted use, distribution, and reproduction in any medium, pro-vided the original author(s) and source are credited.
Anthropocene Coasts Downloaded from www.nrcresearchpress.com by 139.81.27.25 on 10/17/18
deforestation, and intense agriculture, atmospheric GHG concentrations have been increas-ing and the climate system has changed (IPCC 2013).
CH4, the second most important GHG after CO2, has a global warming potential over a 20-year time frame (GWP20) that is 86 times that of CO2, and accounts for 32% of anthropo-genic global radiative forcing (Saunois et al. 2016). The global atmospheric CH4 concentra-tion has increased significantly from a pre-industrial value of 722± 25 ppb in 1750 to 1803± 2 ppb in 2011 (IPCC 2013). This increase in CH4concentration is probably caused by human activities (IPCC 2013). A massive increase in animal farming, especially ruminants (Barnosky 2008), emissions associated with fossil fuel extraction and use, the expansion of rice paddy agriculture, and emissions from landfills and waste, are the dominant anthropo-genic sources of CH4(Fig. 1). According toIPCC (2013), anthropogenic sources contribute at present between 50% and 65% of all atmospheric CH4sources.
Most CH4in marine areas is generated either by biological production in water or exter-nally, including by diffusion from the organic-rich anaerobic sediment (Borges et al. 2017), and inputs of methane-rich freshwater (Scranton and McShane 1991). In the ocean, the redox state of the environment is an important factor in determining the biological cycling of CH4. Because this redox state is determined by the ambient oxygen (O2) concentration, changes in O2distribution may alter the strength of CH4sources. Such changes in the oce-anic O2distribution may be caused by changes in circulation or stratification in response to global warming, and (or) by the elevated respiration of organic matter as a result of an increased supply of nutrients from land (Naqvi et al. 2010;Borges et al. 2017) or the upwell-ing of increasupwell-ingly nutrient-rich subsurface waters (Lui et al. 2014).
The open ocean is a much weaker source of CH4to the atmosphere (0.4–1.8 Tg CH4yr−1) than other natural (230–350 Tg CH4yr−1) and anthropogenic (330–335 Tg CH4yr−1) CH4 sources, and coastal regions are greater sources of CH4to the atmosphere than are open oceanic waters (Kirschke et al. 2013). The high CH4concentrations in surface waters of continental shelves arise from direct CH4inputs from rivers, estuaries, and sediments wherever methanogenesis is sustained by extensive sedimentation of organic matter (Upstill-Goddard et al. 2000;Borges et al. 2017). Natural gas and CH4gas hydrates seep from continental shelves and slopes as another source of CH4in coastal regions. CH4gas hydrates are ice-like solids that are composed of water molecules that encase CH4and other gases. Because the quantity of CH4gas within hydrate-bearing sediments is substantial, CH4gas hydrates have been considered to be potential sources of energy (Boswell 2009). Biogenic or thermogenic CH4can accumulate in large quantities in the sub-surface seabed (gassy sediments) in deep and shallow areas, and can be released as bubbles (gas flares) or by pore water diffusion (Borges et al. 2016).
The release of more GHGs into the atmosphere will increase global warming, causing the thawing of permafrost and the destabilization of marine CH4gas hydrates (Archer 2007;
Kennedy et al. 2008;Archer et al. 2009;O’Connor et al. 2010), which will have a huge effect on the climate. As CH4has greater global warming potential than CO2, the release of CH4 from thawing permafrost and gas hydrates may magnify global warming. However, because CH4has a short residence time in the atmosphere (around 10 years), if we act on CH4 emis-sion reduction we can mitigate climate change on very short time scales, unlike CO2that has a much longer residence time in the atmosphere (about 100 years).
Human activities influence the ecosystem and have caused the environment to change. Environmental change affects human livelihoods and well-being. The impact of increasing CH4concentrations in the atmosphere and the ocean on human welfare is uncertain. Around 60% of the South China Sea (SCS) bottom is continental shelf and upper slope. Those areas are strongly influenced by human activities and account for approximately 72% of CH4emission from the SCS (Tseng et al. 2017). As the SCS has a large percentage of
Tseng et al. 63
Published by Canadian Science Publishing in partnership with East China Normal University
Anthropocene Coasts Downloaded from www.nrcresearchpress.com by 139.81.27.25 on 10/17/18
coastal regions and is strongly affected by anthropogenic activities, the situation in the SCS may have become more severe compared with the open ocean. In addition, coastal CH4 emissions may increase in response to global warming (Zhang and Zhai 2015;Borges et al. 2016,2017). However, because anthropogenic activities strongly influence the coastal regions, we could reduce CH4emission by changing our behaviors and it may help mitigate climate change. This paper analyzes the issue of CH4in the SCS in the context of global change, using a social-environmental approach and scientific and economic data. It consid-ers both global change of the human (population and organic matter inputs) and the envi-ronmental (climate change and GHGs, for example) dimensions. It also provides management recommendations to reduce CH4emissions in the SCS.
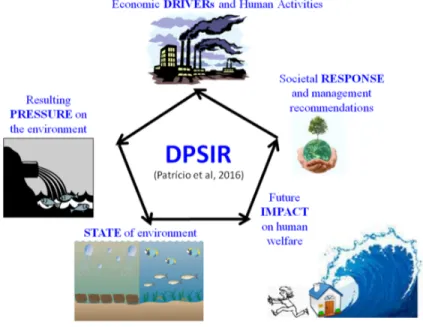
2. Methods of social-environmental analysis
Climate change is an environmental issue that also involves human activities. Therefore, two main social-environmental frameworks are used in the analysis herein. They are the system approach framework (SAF;Hopkins et al. 2011;Newton 2012) and a modified Driver-Pressure-State-Impact-Response (DPSIR;Gari et al. 2015;Patrício et al. 2016) frame-work. A combined social-environmental analysis of carbon fluxes has not previously been attempted. This research uses the following parts of the SAF (Hopkins et al. 2011): issue def-inition, system definition and design, and system appraisal (IPCC 2013). The DPSIR frame-work, adopted by the European Environment Agency and others (Elliott 2002;Rogers and Greenaway 2005;Borja et al. 2006;Maxim et al. 2009;Gray and Elliott 2009;Atkins et al. 2011), describes a framework for assessing the causes, consequences, and responses to change in a holistic way. The modified version of DPSIR (Gari et al. 2015;Patrício et al. 2016) involves economic drivers and human activities, pressures from activities, state of environment, impact on human welfare, and responses of society and management mea-sures. The study analyzed both the scientific data, such as CH4, dissolved organic carbon Fig. 1. Conceptual diagram representing sources of CH4.
Anthropocene Coasts Downloaded from www.nrcresearchpress.com by 139.81.27.25 on 10/17/18
(DOC) and chemical oxygen demand (COD) as well as societal data, such as population, population density, and wastewater treatment rate. The DPSIR analysis (Fig. 2) addresses the following research questions. (i) What are the Drivers and human activities that increase CH4concentrations in the SCS? (ii) How do those human activities influence (pres-sure) the environment? (iii) What are the consequences thereof the state of the environ-ment? (iv) What are the impacts on human welfare? (v) Which societal responses and management measures can reduce CH4emissions from the SCS?
3. Results of social-environmental analysis
This section presents the results of the social-environmental analysis under the follow-ing headfollow-ings: issue definition, system definition and design, economic drivers and human activities, resulting pressure on the environment, state of the environment of the SCS, and impact on human welfare.
3.1. Issue definition (Hopkins et al. 2011)
Continental shelves and estuaries are responsible for approximately 75% of global oce-anic CH4emissions (Bange et al. 1994). According toBorges et al. (2016,2017), the contribu-tion from sedimentary sources in well-mixed coastal zones may be the cause of the higher CH4emissions from continental shelves and estuaries than from open ocean, especially in areas of hydrocarbon seepage or hydrate destabilization. Industrialization has changed peo-ple’s lifestyles, especially in developed countries. Human activities have increased the input of organic matter from domestic waste and industry (predominantly agriculture, industrial-ized animal farming, and aquaculture) into rivers and coastal areas, increasing CH4 concen-trations and emissions in the SCS. The estuaries and embayment mark human disturbance, and prominent impacts on the coastal environment and ecosystem have been observed (Liu et al. 2009). The ongoing increasing of eutrophication-induced hypoxia will increase CH4concentrations in coastal waters and possibly the emission of CH4into the atmosphere (Bange 2006;Naqvi et al. 2010;Borges et al. 2017).
Fig. 2. DPSIR framework (Patrício et al. 2016).
Tseng et al. 65
Published by Canadian Science Publishing in partnership with East China Normal University
Anthropocene Coasts Downloaded from www.nrcresearchpress.com by 139.81.27.25 on 10/17/18
3.2. System definition and design (Hopkins et al. 2011)
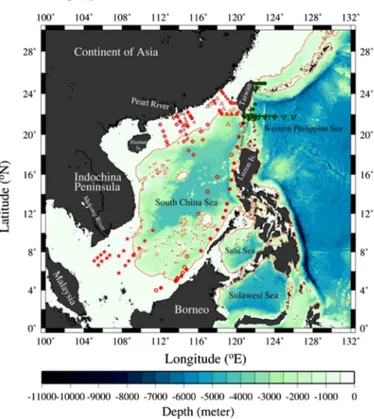
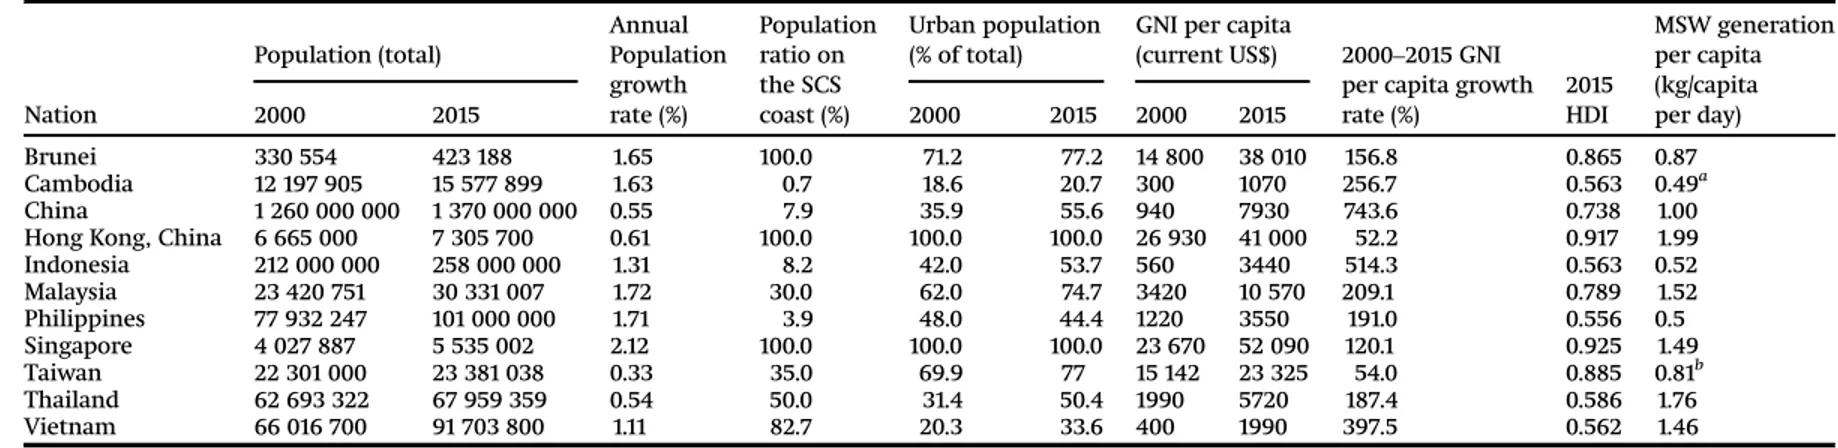
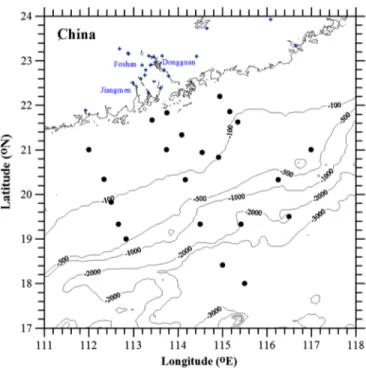
The SCS (Fig. 3) is the largest marginal sea in the world, with an area of 3.5× 10⁶km2; it is also one of the world’s busiest maritime areas (Chen 2013). It is surrounded by nations in the Asia-Pacific region that are currently experiencing rapid urbanization, industrializa-tion, and economic growth, especially China, Indonesia, and Vietnam (Table 1). The SCS, typical of a sea in a tropical climate, has both a deep basin and extensive shelf systems at its northern and southern boundaries, which are associated with large riverine inputs. About 122 major rivers drain 2.5× 10⁶km2of catchment area and deliver materials, includ-ing suspended sediments, nutrients, organic matter and pollutants, to the SCS (Pernetta and Bewers 2013).
Historically, the SCS has been critical to the economic and political stability in Southeast Asia and adjacent regions; today, it is crucial for the environmental sustainability and food security of its surrounding nations. The coastal sub-regions of these nations are home to 270 million people or 5% of the world’s population (Pernetta and Bewers 2013).
3.3. DPSIR framework (Patrício et al. 2016)
This study uses the DPSIR framework (Patrício et al. 2016) to the social-environment of the SCS. Human activities (economic drivers) that may be sources of CH4in the SCS are firstly identified. The way in which those human activities influence the CH4concentration in the SCS (pressure) is analyzed. The state of the SCS is then elucidated and its possible impact on human welfare considered.
3.4. Economic drivers— and human activities
The following sections analyze several anthropogenic sources of CH4, which are (D1) urbanization and increases in municipal solid waste (MSW), (D2) economic growth and Fig. 3. Map of study area and sampling stations.
Anthropocene Coasts Downloaded from www.nrcresearchpress.com by 139.81.27.25 on 10/17/18
Table 1. Population, gross national income (GNI), and human development index (HDI) of countries that surround the SCS and amount of municipal solid waste (MSW) generated thereby. Nation Population (total) Annual Population growth rate (%) Population ratio on the SCS coast (%) Urban population (% of total)
GNI per capita
(current US$) 2000–2015 GNI per capita growth rate (%) 2015 HDI MSW generation per capita (kg/capita per day) 2000 2015 2000 2015 2000 2015 Brunei 330 554 423 188 1.65 100.0 71.2 77.2 14 800 38 010 156.8 0.865 0.87 Cambodia 12 197 905 15 577 899 1.63 0.7 18.6 20.7 300 1070 256.7 0.563 0.49a China 1 260 000 000 1 370 000 000 0.55 7.9 35.9 55.6 940 7930 743.6 0.738 1.00
Hong Kong, China 6 665 000 7 305 700 0.61 100.0 100.0 100.0 26 930 41 000 52.2 0.917 1.99
Indonesia 212 000 000 258 000 000 1.31 8.2 42.0 53.7 560 3440 514.3 0.563 0.52 Malaysia 23 420 751 30 331 007 1.72 30.0 62.0 74.7 3420 10 570 209.1 0.789 1.52 Philippines 77 932 247 101 000 000 1.71 3.9 48.0 44.4 1220 3550 191.0 0.556 0.5 Singapore 4 027 887 5 535 002 2.12 100.0 100.0 100.0 23 670 52 090 120.1 0.925 1.49 Taiwan 22 301 000 23 381 038 0.33 35.0 69.9 77 15 142 23 325 54.0 0.885 0.81b Thailand 62 693 322 67 959 359 0.54 50.0 31.4 50.4 1990 5720 187.4 0.586 1.76 Vietnam 66 016 700 91 703 800 1.11 82.7 20.3 33.6 400 1990 397.5 0.562 1.46
Note: Data fromThe World Bank (2015)andDirectorate-General of Budget, Accounting and Statistics, Executive Yuan, R.O.C. (Taiwan) (2018). aSethy et al. 2014. bLu et al. 2006. Tseng et al. 67 Published by Canadian Science Publishing in partnership with East China Normal University
Anthropocene Coasts Downloaded from www.nrcresearchpress.com by 139.81.27.25 on 10/17/18
lifestyle change, (D3) increasing size of animal farming and aquaculture, (D4) agricultural intensification, and (D5) rapid industrial development and the bio-economy.
(D1) Urbanization and increases in MSW
The Pearl River Delta (PRD), in south China’s Guangdong province, has been among the fastest growing regions of China, since China’s open-door policy in 1978 and the adoption of economic reform. Urbanization and industrialization have led to increasingly serious environmental problems, exacerbated by the lack of a good urban plan, management, and policy (Yeh and Li 1999;Ouyang et al. 2006). The PRD is the second largest delta in China, with an area of 5.6× 10⁴km2. Owing to the economic growth, people have moved to the PRD for work and the population in the river basin has increased. The population was 21.4 million in 1990, had increased to 47.2 million by 2007 (Wang and Chen 2009), and more than 57 million people by the end of 2013 (The World Bank 2015). According to the Sixth National Population Census of the People’s Republic of China, the population density in the PRD was about 1000 people per km2, compared to a national average of 118 people per km2. The high population density, rapid urbanization, and industrialization have put severe stress on the aquatic environment. As the population increases, so does the discharge of chemicals and organic matter. According toSeto (2002), the daily discharge of wastewater had already reached 10.6× 10⁶m3in 1985, resulting in eutrophication and red tides.
Figure 4ashows that high concentrations of DOC appeared within 200 km of the Pearl River mouth1(Chen et al. 2008), where populations density increased. In addition, DOC con-centration increased positively with cumulative population on the river watershed (Fig. 4b).
(D2) Economic growth and lifestyle change
China has experienced fast economic growth with an annual gross domestic product (GDP) growth rate of 8% over the past two decades, the highest rate in recent history (Liu and Savenije 2008). Consumers’ income has risen substantially, resulting in rapid dietary change towards more meat consumption (Du et al. 2004;FAO 2006). Chinese diets have shifted from high-carbohydrate foods toward animal products, particularly meat (Du et al. 2004). Meat consumption was low before 1980. Animal products were luxury foods in China and only a few rich people could regularly consume them before that year, but most people can afford them now (Liu and Savenije 2008). With rapid economic growth and a large increase in per capita income, urbanization, and market size, meat consumption rose by a factor of 3.7 from 1980 to 2003 (Huang et al. 1999;Hsu et al. 2002). According toDu et al. (2004), following rapid economic and social change, the nutrition transition (from carbohy-drate foods to animal products) accelerated in developing countries. Animals raised for food require more land and water than crops, and they produce more organic waste.
(D3) Increasing size of animal farming and aquaculture
This section considers animal farming and aquaculture together because they have sim-ilar effects on the carbon cycle, although animal farming is on land and aquaculture is in the water. The term“livestock revolution” has been used to describe the rapid expansion of livestock production in developing countries (Delgado et al. 1999). As a consequence of growth in the human population, economy, and urbanization, Asia has the fastest develop-ing livestock sector among the developdevelop-ing countries. (The annual growth rate of meat pro-duction over the same time period was 8.4% in China and 5.7% in Southeast Asia (Gerber et al. 2005)). Southeast Asia is dominated by monogastric species (such as pigs, laying hens, broilers, and ducks), not only because monogastrics have a better feed conversion ratio
1
Unpublished data from Prof. Chen-Tung. Arthur Chen 2003.
Anthropocene Coasts Downloaded from www.nrcresearchpress.com by 139.81.27.25 on 10/17/18
than ruminants (such as cattle, sheep, and goats), but also because of the preferences of its consumers. (Most Asians view cattle as scared or workers in farm but not for meat con-sumption so eating beef is against the culture and the religion in most Asian countries.)
According toGerber et al. (2005), high densities of pigs and poultry are observed around urban centers, such as Hanoi, Bangkok, Manila, and Guangzhou, and in highly populated areas, such as the southeastern Chinese coast, because of the demand on meat consumption in the urban centers. However, very low pig densities and a strong poultry population are found in Indonesia because this country has the largest Islamic population of any nation.
According toHolm-Nielsen et al. (2009), an average pig in European countries produces 1.84 (wet) ton of manure. Pig manure has a low dry matter content of 6%–10% of which 40.7% is organic carbon (Moral et al. 2005). China’s Guangdong province is near the SCS and had 35 319 thousand heads of pig in 2016 (Guangdong agriculture statistics 2016). If the annual average amount of manure per head of pig in Guangdong province is the same as that in European countries, then pig farms in Guangdong province produce about 1.6–2.6 million tons of total organic carbon (TOC) annually. Most Asian cities do not have effective animal farming wastewater treatment systems. In the Philippines, for example, only 10% of wastewater is treated while in Indonesia the figure is 14%, and in Vietnam, it is 4% (Asian Development Bank 2011). In many countries, disposal and delivery systems for animal manure from intensive non-ruminant agriculture are not in place, and wastewater Fig. 4. (a) Cumulative population on the river watershed (million inhabitants) and DOC (μmol L−1) concentration versus distance (km) from Pearl River mouth; (b) DOC (μmol L−1) concentration versus cumulative population on the river watershed (million inhabitants).
Tseng et al. 69
Published by Canadian Science Publishing in partnership with East China Normal University
Anthropocene Coasts Downloaded from www.nrcresearchpress.com by 139.81.27.25 on 10/17/18
from livestock production enters streams and coastal waters through discharge, run-off or the overflow from lagoons. The wastewater from pig farms contains a high concentration of organic matter that exceeds the carrying capacity of the environment (González et al. 2008), causing soil and water contamination, emerging health hazards, and increasing GHG emissions.
Coastal aquaculture has been a traditional practice in Southeast Asia for over 500 years. However, significant strides in aquaculture have been made in the last few decades, during which period production has reached a commercial scale through the improvement of fish farming techniques, such as the intensification of farm operations, refinement of hatch-eries by controlled breeding, and general improvements in farm management (Chua et al. 1989). The proportion of edible fish that have been produced through aquaculture increased from 10% of total fish production in Southeast Asia in 1980 to 17% in 2000, and 27% in 2006 (Hishamunda et al. 2009). Overfeeding in aquaculture may increase nutrients and organic matter in the water. Eutrophication in the surface water (Gerber et al. 2005) and hypoxia in the intermediate and bottom waters (Lui et al. 2014) may occur as a result of the increased input of organic substances.
(D4) Rapid industrial development and the bio-economy
Since the early 1960s, the economic development strategies of virtually all the Southeast Asian states, and especially those countries around the SCS, emphasized urban industriali-zation. This is mostly owing to large inflows of direct foreign investment. Industrialization has involved low value-added manufacturing to higher value-added manufacturing and, more recently, services. Paper and food-processing industries produce a lot of organic waste, which can be discharged into the rivers and coastal waters as sewage.
In 2009, China overtook the United States as the world’s leading producer of paper and is now responsible for around one-quarter of the total global production (Bajpai 2016). The pulp and paper industry in Indonesia has also been expanding recently as a result of increas-ing paper consumption in Asia, and particularly in China. In the newsletter ofIndonesia Investments (2014), the Deputy Chairman of the Indonesia Pulp and Paper Association said that“growing pulp and paper consumption in Asia is important for the industry globally as consumption of these products has been declining in North America and Europe, where computers and mobile devices have increasingly succeeded in replacing paper products.”
The environmental problems of the pulp and paper industry are high water consump-tion, wastewater generaconsump-tion, the generation of solid waste, including sludge from waste-water treatment plants (WWTPs), and GHG emissions. The major problem of wastewaste-water is its high organic content equivalent to COD of around 20–110 kg per ton of air-dried paper (Ince et al. 2011). COD is widely used in wastewater monitoring, and in the design, model-ing, and operational analysis of treatment plants (Mittal and Ratra 2000;Kim et al. 2007).
Dubber and Gray (2010)found significant linear relationships between COD and TOC con-tent in settled (influent) domestic and municipal wastewater. The study concludes that TOC can be reliably used to evaluate COD (COD= 49.2 + 3 × TOC) in influent wastewaters. One ton of air-dried paper can produce as much as 20 kg of TOC.
The food processing industry is important for the economic development of Southeast Asian nations; the tropical climate and diversity of agricultural products (Ngoc and Schnitzer 2009). Food processing industry has rapidly grown in Southeast Asian countries, and Thailand is one of the world’s leading agricultural suppliers, primarily owing to its well-developed food processing sector (GAIN 2014). Thailand’s growing agriculture sector currently accounts for more than 10% of the country’s GDP, and employs nearly 40% of its labor force (GAIN 2014). The demand for processed foods and ready-to-eat meals has increased owing to rapid urbanization and a growing number of women in the workforce.
Anthropocene Coasts Downloaded from www.nrcresearchpress.com by 139.81.27.25 on 10/17/18
Waste and wastewater from the food processing industry contain large amounts of organic matter. For example, when one ton of citrus is processed, approximately 300 kg of citrus waste is generated; all of it is organic waste (Ngoc and Schnitzer 2009). Packaging creates additional waste.
(D5) Agricultural intensification
The dominant form of agriculture in the countries around the SCS is wet rice cultivation. Farmers usually flood rice fields throughout the growing season, causing CH4to be pro-duced by microbes in the submerged soil when organic matter decays. Flooded rice paddy fields are responsible for approximately 10% of global anthropogenic CH4emission (Kirschke et al. 2013). CH4emissions from rice paddies in tropical Asian countries account for 90% of annual CH4emissions from rice paddies globally (Yan et al. 2009;IPCC 2013).
According to the data from Food and Agriculture Organization of the United Nations (FAO 2011), the area of rice cultivation in Asia increased from 107 million ha in 1961 to 137 million ha in 2010 due to population growth. Although the area of rice cultivation only increased 28%, rice production increased significantly from 200 million tons in 1961 to 600 million tons in 2010. The rice yield was 1.86 tons per ha in 1961 and 4.45 tons per ha in 2010 due to agrochemical usage and improvement in agricultural technology. Although the main crop (rice) species has not changed much, the use of agrochemicals has intensified agriculture in the last few decades.
Most of the CH4emissions from rice fields involve bubble ebullition from the soil, which account for 35%–62% of all such CH4emissions (Komiya et al. 2015). The decomposition of organic carbon in rice paddy soil has two steps: organic carbon is initially decomposed into floodwater or DOC, which is then converted into CO2and CH4 (Cheng et al. 2001). Floodwater with a high organic carbon concentration and surplus agrochemicals can flow into rivers, groundwater or coastal waters, increasing CH4concentrations in, and emissions from, those rivers and coastal waters. As the countries that surround the SCS are dominated by wet rice cultivation, which is an important anthropogenic CH4source, agriculture inten-sification in those countries increases the CH4concentration in, and emission from, the SCS.
3.5. Resulting pressure on the environment
Economic drivers and human activities cause environmental pressures, which are (P1) increased organic carbon in rivers and the SCS, (P2) increased COD of the water that is dis-charged into the SCS, and (P3) increased CH4concentrations in rivers and the SCS.
(P1) Increased organic carbon in rivers and the SCS
Most riverine organic carbon derives from living and dead biota. Other sources include geological features, pollution, and groundwater (Raymond et al. 2004;Chen et al. 2012). Changes in land use have also caused the release of organic carbon that had been stored in the soil. Soil is the largest terrestrial pool of organic carbon, which is at least three times larger than the pool of atmospheric CO2(Jobbágy and Jackson 2000;Amundson 2001). Conversion from forest to farmland, grassland or building significantly decreases soil car-bon stocks (Deng et al. 2016).
The countries that surround the SCS have experienced explosive economic growth over the last two decades, resulting in rapid industrialization, urbanization, and a substantial increase in population. Intense anthropogenic activities on land have generated large amounts of organic pollutants that may be transported into the SCS (Ni et al. 2008). In the urban areas in these surrounding countries, people generate 0.49 kg MSW from per person daily (Cambodia) to 1.99 kg per person daily (Hong Kong) (Table 1) and about 50% of the
Tseng et al. 71
Published by Canadian Science Publishing in partnership with East China Normal University
Anthropocene Coasts Downloaded from www.nrcresearchpress.com by 139.81.27.25 on 10/17/18
MSW is organic matter (The World Bank 2012). If only 1% of the organic matter from the MSW is transported by the rivers and into the coastal areas, then the SCS receives around 1700 tons of organic matter daily.
(P2) Increased COD of the water that is discharged into the SCS
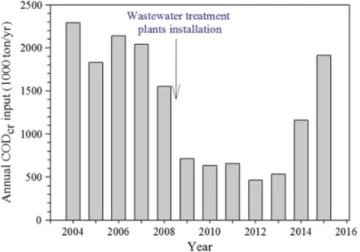
Based on data from the Bulletin of the Marine Environmental Status of China for the years 2004-2015 (National Oceanic Administration 2012),Fig. 5shows the annual amount of the CODcrin the Pearl River. The CODcrof the Pearl River increased from 2004 to 2008. China-Second Guangdong PRD Urban Environment Project, 2007–2013, had the objective of reducing water pollution in the Pearl River system that originated from Foshan and Jiangmen municipalities (The World Bank 2015). The Dongguan municipal government spent more than 10 billion yuan (US$ 1.5 billion) on building 35 WWTPs in 2007. Some of the WWTPs became operational in February 2008, and water quality in the canal since improved to Grade IV from Grade V (Chinadialogue 2011). Dongguan, Foshan, and Jiangmen (Fig. 6) are three of the most populous municipalities in the PRD, and account for about one third of the population there. Also, the PRD is one of the fastest growing eco-nomic areas in China.
Since the aforementioned WWTPs became operational in 2008, the CODcrinput in the Pearl River has decreased (Fig. 5). The improvement has been supported by the economic slowdown that forced some factories to close down, reducing pollution (and population, since fewer jobs were available for migrant workers). However, from 2013, a rebounding economy and the return of the migrant workers increased the annual input of CODcrin the Pearl River. Moreover, the industrial structure in the PRD changed from 2010 to 2013. Most new factories are built in suburbs or other municipalities in the PRD, where the land is cheaper but WWTPs are absent, so the annual input of CODcrin the Pearl River has risen since 2014.
The wastewater that is generated by inhabitants is often expressed using the unit Population Equivalent (PE).
1 PE= 60 g BOD5=d = 126 g COD=d
This formula is based on a fixed value of generating COD per day per person. However, the actual contribution to the environment of a person who lives in a sewer catchment, Fig. 5. Annual CODcrinput (1000 ton yr−1) of Pearl River.
Anthropocene Coasts Downloaded from www.nrcresearchpress.com by 139.81.27.25 on 10/17/18
the so-called person load, can vary considerably (Henze et al. 2001). The reasons for variation can be work outside the catchment, socio-economic factors, lifestyle, type of household, and others. Because the coastal sub-regions of the SCS are home to 270 million people (Pernetta and Bewers 2013), the wastewater from its inhabitants contains about 34 000 tons COD/day. If the wastewater from the coastal sub-regions were discharged into the SCS without any treatment, then the SCS would annually receive discharged water that had 12.4 million tons of COD.
(P3) Increased CH4concentrations in rivers and the SCS
CH4in marine areas is biologically produced in seawater, has diffused from organic-rich anaerobic sediment (Borges et al. 2017), and (or) is contained in inputs of CH4-rich fresh-water (Scranton and McShane 1991). Human activities have increased organic carbon and decreased dissolved oxygen (DO) concentrations in the aquatic systems (Diaz and Rosenberg 2008). As increasing amounts of organic matter are input from the land and eutrophication-induced hypoxia in the aquatic environment increases, CH4concentrations in the rivers and the coastal waters increase, increasing CH4emissions to the atmosphere (Bange 2006;Naqvi et al. 2010;Borges et al. 2017).
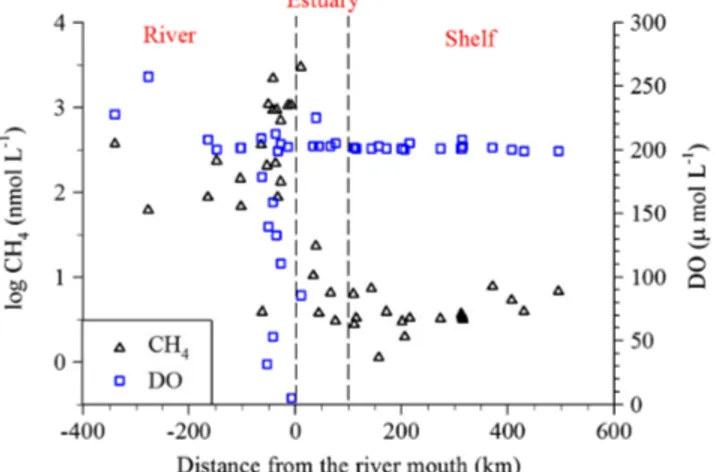
Chen et al. (2008)sampled surface waters from the tributaries of the Pearl River and its estuary in September 2003 (Fig. 6). Degradation of organic carbon in freshwater and estua-rine environments is partially mediated by anaerobic processes, including methanogenesis, which leads to the production of CH4and high CH4emissions from surface waters to the atmosphere, in particular in sub-tropical and tropical environments (Borges and Abril 2011;Borges et al. 2015). High concentrations of CH4were found to be present in the Pearl River; after the river entered the SCS, mixing with the open ocean water, CH4 concentra-tions decreased rapidly and DO concentraconcentra-tions increased (Fig. 7).
Fig. 6. Map of sampling stations in PRD and estuary.
Tseng et al. 73
Published by Canadian Science Publishing in partnership with East China Normal University
Anthropocene Coasts Downloaded from www.nrcresearchpress.com by 139.81.27.25 on 10/17/18
3.6. STATE of the environment of the SCS
This section analyzes how the environmental state of the SCS has changed, with particu-lar consideration of (S1) increased CH4concentrations in the SCS; (S2) reduced DO concen-trations in the SCS, possibly causing coastal hypoxia and increasing CH4generation; (S3) increased temperature as a result of the greenhouse effect of CH4; and (S4) destabilized seabed (high concentrations of interstitial gas in sediments).
(S1) Increased CH4concentrations in the SCS
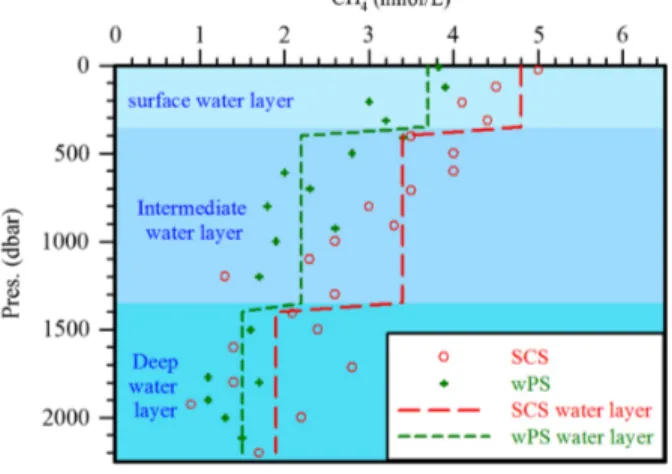
The northeastern SCS is connected to the western Philippine Sea (wPS;Fig. 3) via the Luzon Strait, which has the deepest sill that connects the SCS with any adjacent body of water. Because the Luzon Strait is 2200 m deep, surface and intermediate waters are exchanged freely between the SCS and the wPS; the waters deeper than 2200 m in the SCS are relatively homogeneous, with hydrochemical properties similar to the water at 2200 m in the wPS (Chen et al. 2006a). Only recently has CH4in the SCS been studied and few historical CH4data are available. Because the majority of the water in the SCS origi-nates from the wPS (Chao et al. 1996;Chen et al. 2001), we can calculate the amount of increasing CH4concentrations by comparing the CH4concentrations in the SCS with those in the wPS.
Figure 8shows the average CH4concentrations at depths at intervals of 100 m in the SCS and in the wPS. In the surface water layer (0–350 m), the average CH4concentrations in the SCS and in the wPS were 4.8± 5.7 (n = 416) and 3.7 ± 1.3 (n = 70) nmol L−1, respectively; in the intermediate water layer (350–1350 m), the average CH4concentrations in the SCS and in the wPS were 3.4± 3.0 (n = 155) and 2.2 ± 1.1 (n = 68) nmol L−1; in the deep water layer (1350–2200 m), they were 1.9 ± 1.7 (n = 48) and 1.5 ± 0.6 (n = 29) nmol L−1(Tseng et al. 2017). As a result, the CH4concentration in the SCS is higher than that in the wPS throughout the water column. The surface water of the SCS is strongly influenced by terrestrial input and has a CH4concentration that is about 20% higher than that of the wPS, presumably due to human activities.
(S2) Reduced DO concentrations in the SCS, possibly causing coastal hypoxia and increasing CH4generation
Eutrophication and related hypoxia adversely affect marine ecosystems (Newton et al. 2003;Howarth 2008;Rabalais et al. 2010;Lui and Chen 2012). As the stratification of sea-water increases under global warming and nutrient fluxes from terrestrial sources also Fig. 7. Log CH4(nmol L−1) and DO (μmol L−1) concentrations versus distance (km) from Pearl River mouth.
Anthropocene Coasts Downloaded from www.nrcresearchpress.com by 139.81.27.25 on 10/17/18
increase (Chen 2008;Diaz and Rosenberg 2008;Rabalais et al. 2010), more coastal ecosys-tems reportedly exhibit hypoxia.
Tseng et al. (2016)reveals that the DO concentrations in the SCS are generally lower than those in the wPS at depths up to 800 m.Lui and Chen (2012)found that DO% was low (some-times hypoxia) in the bottom water, especially in the summer. The weather systems in the SCS region are dominated by the Asian monsoon and approximately 80% of annual rain falls in the rainy season between May and October (Debenay and Luan 2006). The nutrient-enriched freshwater enhances the local primary production in the surface water and the organic matter from the surface water then decomposes in the bottom water or on the continental shelf (Lui and Chen 2012;Lui et al. 2014). In addition, summer stratifica-tion reduces the ventilastratifica-tion between the subsurface water and the atmosphere. As a result, the DO concentration is low or hypoxia occurs in the intermediate or bottom waters of the continental shelf, during the wet season. Because of increasing organic matter from land and the hypoxia in the intermediate or bottom waters of the continental shelf, CH4 gener-ation may have occurred and it may increase the coastal CH4emissions.
(S3) Increased temperature as a result of the greenhouse effect of CH4
The sea-to-air flux of CH4 in the wet season (May to October) in the SCS is 8.6± 6.4μmol m−2d−1 (Tseng et al. 2017). The GWP20of CH4is 86, so the flux of CH4is about 740μmol m−2d−1in CO2equivalents. This value is similar to the sea-to-air flux of CO2 (631.2± 163.2 μmol m−2d−1,Chou et al. 2005; 729.6μmol m−2d−1,Chen et al. 2006b) in the wet season. CH4emissions in the SCS currently cause similar warming as CO2in the wet season. However, as CH4emissions increase, the greenhouse effect of CH4will significantly increase, as well as the temperature.
(S4) Destabilized seabed (high concentrations of interstitial gas in sediments)
Beneath the SCS seabed may be huge oil, gas, and gas hydrate reserves (Morton and Blackmore 2001). The southern SCS near Brunei has abundant petroleum and gas (OPL 2000). Recent research has revealed CH4seepage in the northeastern part of the SCS (Boetius et al. 2000;Boetius and Suess 2004), with buildups of authigenic carbonate, named the Jiulong Methane Reef (Suess 2005;Han et al. 2008). CH4gas hydrates have been detected in the northern SCS. Seismic profiles of these areas demonstrate that bottom simulating reflectors are widespread under the sea floor, possibly indicative of gassy sediments Fig. 8. Vertical distributions of average CH4concentration (nmol L−1) every 100 m in SCS and wPS above 2300 m.
Tseng et al. 75
Published by Canadian Science Publishing in partnership with East China Normal University
Anthropocene Coasts Downloaded from www.nrcresearchpress.com by 139.81.27.25 on 10/17/18
(Wu et al. 2005,2009). In addition, geochemical evidence suggests the presence of subma-rine gas hydrate deposits around these areas (Chen et al. 2005;Su et al. 2005). High CH4 concentrations in the seawater have been found (Chen and Tseng 2006;Zhou et al. 2009;
Tseng et al. 2017) and are possibly caused by the seepage of CH4from seafloor sediments. Warming seawater reduces the solubility of CH4and may increase the amount of CH4gas that is released from gassy sediments in it, potentially destabilizing the seabed.
3.7. IMPACT on human welfare
As economic drivers and human activities cause environmental pressure, the state of the environment is changing. This section concerns the possible changes in human welfare as a result of changes in the environment. Possible future effects are as follows. (I1) Reduced catches of commercial species of benthos and fish; (I2) rising sea levels and storminess as a result of increased surface seawater temperature, increasing the vulnerability of coastal populations; (I3) destabilization of seabed, causing blowout or collapse of offshore struc-tures; (I4) future energy prospecting for gas hydrate extraction, potentially creating jobs and increasing energy security; and (I5) escalation of geopolitical tensions because of valu-able maritime resources.
(I1) Reduced catch of commercial species of benthos and fish
Based on Intergovernmental Panel on Climate Change (IPCC) scenarios (IPCC 2013), as the ocean warms, some marine species may find that areas that were previously suitable for their survival have become unfavorable, so many populations of marine fish and inver-tebrates shift following changes in ocean conditions (Sunday et al. 2011). Studies of the potential effects of climate change on global fisheries have predicted a large-scale redistrib-ution of catch potential (Cheung et al. 2010;Blanchard et al. 2012) and increased vulnerabil-ity of many coastal fisheries, particularly in the tropics (Allison et al. 2009). Populations of marine fish and invertebrates tend to be shifting to higher latitudes and deeper waters (Cheung et al. 2013). The overall abundance of species with limited dispersal potential or a narrow range of temperature tolerance, such as in semi-enclosed seas and the tropics, will decrease (Portner and Knust 2007;Ben Rais Lasram et al. 2010). The SCS is a semi-enclosed marginal sea and a region where the climate is tropical. Consequently, catches of commer-cial species of benthos and fish in the SCS are likely to shrink.
A report based on a global database on marine fisheries and ecosystems (Sea Around Us 2007) claims that approximately 6 million tons of fish were caught in the SCS in 2004, with a value of US$ 6 billion. The Wall Street Journal reported that fish stocks in the SCS have fallen by 70%–95% from 1950s levels, according to research done at the University of British Columbia. Not only may coastal hypoxia, caused by an increasing input of organic matter from land, kill fish, but also increasing seawater temperature owing to global warm-ing will reduce the size of catches of commercial benthos and fish in the SCS.
(I2) Rising sea levels and storminess as a result of increased surface seawater temperature, increasing vulnerability of coastal populations
Surface temperature is projected to rise over the 21st century in all assessed GHG emis-sion scenarios (IPCC 2014). According to the fifth assessment report (AR5) of the IPCC, the global mean sea level is very likely to continue to rise during the 21st century, owing to an increase in ocean warming (thermal expansion) and a loss of mass from glaciers and ice sheets. Additionally, climate model projections through the 21st century show an increase in total monsoon rainfall. Heat waves are very likely to occur more often and last longer, and extreme precipitation events will become more intense and frequent in many regions (IPCC 2014). Moreover, as typhoons form over warm water, the frequency of the
Anthropocene Coasts Downloaded from www.nrcresearchpress.com by 139.81.27.25 on 10/17/18
most intense storms and typhoons is likely to increase. As sea level rises and storminess increases, coastal populations will become more vulnerable.
(I3) Destabilization of seabed, causing blowout or collapse of offshore structures
Submarine landslides are especially prevalent in river deltas, because of the high rate of sediment delivery, and the presence of submarine canyons (Archer 2007). In addition, warming may trigger the melting of gas hydrate deposits, provoking landslides (Kvenvolden 1999;Driscoll et al. 2000;Vogt and Jung 2002). As gas hydrates are very sensi-tive to changes in temperature and pressure (Dickens and Quinby-Hunt 1994;Brewer et al. 1997), global warming may destabilize gas hydrates (Archer 2007;Kennedy et al. 2008;
Archer et al. 2009;O’Connor et al. 2010) and increase the flux of CH4to the atmosphere. The instability of gas hydrates may destabilize the seabed, trigger submarine landslides or cause submarine earthquakes. The primary hazards that are associated with submarine landslides and submarine earthquakes are the direct destruction of infrastructure and sub-marine cables, and the occurrence of tsunamis.
(I4) Future energy prospecting for gas hydrate extraction, potentially creating jobs and increasing energy security
Gas hydrates are considered to be an important new resource (Chen and Tseng 2006). Exploring and extracting gas hydrates may create jobs and increase energy security. For example,Oil and Gas UK (2018)has shown that this industry in the North Sea employed an estimated 41 700 people in 2014, and the number of jobs that rely on the industry— including taxi drivers, hotel staff, and caterers— is about 453 800. However, the use of sonar for prospection may disrupt other marine activities, such as fishing. The SCS is one of the world’s most important fishing grounds, employing more than 3.7 million people and generating billions of dollars every year (Pauly et al. 2014). Exploring and extracting activities affect the marine ecosystem and the fisheries on which 3.7 million people rely. Furthermore, gas hydrates are very sensitive to temperature and pressure, and they expand very quickly in response to temperature and (or) pressure changes. One litre of CH4gas hydrates under standard conditions (1 atm, 0 °C) can become 168 L of CH4gas, so extracting gas hydrates has a high risk of explosion and may cause a serious hazard. Therefore, risk assessments must be conducted and counter measures taken before extraction, especially in warm seas.
(I5) Escalation of geopolitical tensions because of valuable maritime resources
The SCS is one of the most contested maritime areas of the world. Competing territorial claims over the SCS and its resources are numerous with the most contentious revolving around the Spratly and Paracel Islands (Chen 2013). Geopolitical tensions escalate because of valuable maritime resources. According toHill et al. (1991), the northern, western, and southern regions of the SCS contain between 10 and 14 billion barrels of oil. However, most of the sea areas and island groups are disputed. Climate change may worsen regional ten-sions and natural disasters, increase the number of climate refugees and reduce food secu-rity as a result of reduced fish catches and crop production.
4. Discussion and recommendations
4.1. Societal response and management recommendations from DPSIR
Previous sections analyzed the economic drivers and human activities that have caused environmental pressure, changed the state of the environment, and will potentially impact human welfare. This section discusses societal responses and management recommenda-tions. Those responses are as follows: (R1) education and raising awareness, (R2) research into the exploitation of CH4gas hydrates, (R3) the development of the circular economy,
Tseng et al. 77
Published by Canadian Science Publishing in partnership with East China Normal University
Anthropocene Coasts Downloaded from www.nrcresearchpress.com by 139.81.27.25 on 10/17/18
(R4) construction of infrastructure (building WWTPs), (R5) technological development (recycling reusable items and reducing waste), (R6) application of agricultural technology (new rice cultivation methods), (R7) optimization of agricultural practices (stop using excess agrochemicals and start smart fertilizer application), and (R8) governance measures.
(R1) Education and raising awareness
Education affects our future.“Anthropogenic GHG emissions are mainly driven by popu-lation size, economic activity, lifestyle, energy use, land-use patterns, technology and cli-mate policy” (IPCC 2014). Changing of human behaviors and lifestyles may slow down climate change, provide more opportunities for human beings, as well as allowing other life forms, to adapt to the changing climate. Education not only raises people’s awareness but also helps them make better choices concerning the environment and themselves. For example, a balanced diet should contain only 20% animal products (or protein alterna-tives); such a diet is good not only for health but also for the environment (Liu and Savenije 2008). Furthermore, consuming local products supports local business and reduces transport distances and carbon footprints.
People make choices about their economic activities, lifestyle, energy use, and land-use patterns. If more people were informed, willing to change, and able to make better choices, then the greenhouse effect could be more easily mitigated and climate change more easily slowed down. Education can help to achieve these goals.
(R2) Research into the exploitation of CH4gas hydrates
Gas hydrates are stable at low temperature and high pressure, which prevail in oceanic sediments along continental margins, where water depths are>500 m (Sha et al. 2015). This minimum stability depth is less in the high-latitude oceans, and about 200 m in the Arctic Ocean, because the upper water column is colder (Archer 2007). Although gas hydrates have been considered to be a potential source of energy, research into the extrac-tion of CH4gas hydrates has begun only recently. In Canada, Norway, Japan, and Alaska, where the latitude is high, the gas hydrate stability depth is smaller. The SCS is located in a tropical area where the seawater is warm and the gas hydrate stability depth is large so extraction is even more complicated. CH4gas hydrates are released faster in warm seas than in cold waters so extraction of CH4gas hydrates in the SCS is more difficult and dan-gerous than it is at high latitudes. Moreover, when the temperature increases and (or) pres-sure decreases, the volume of gas hydrates expands rapidly (changes from solid phase to gas phase) with a high probability of explosion. Thus, more research on the exploitation of CH4 gas hydrates, especially in warm seas, is needed.
The SCS is one of the most contested maritime areas in the world. Competing territorial claims over the SCS, and especially over the Spratly and Paracel Islands, exist (Chen 2013). While countries are trying to consolidate their claims to sovereignty, they still share a desire to sustain a peaceful regional environment to promote prosperous economic devel-opment (Chen 2013). Once the methods of extracting CH4gas hydrates have been resolved, they will be a valuable natural resource. Competition to extract CH4gas hydrates may esca-late geopolitical tensions around the SCS if no internationally agreed upon governance measures are in place.
(R3) The development of the circular economy
A circular economy is an industrial economy that is restorative and regenerative by design. Its aim is to promote greater resource productivity, reduce waste, and avoid pollu-tion (Tukker 2015). Recently, the concept of the circular economy has gained increased attention with a focus on transforming waste into resources while bridging production and consumption activities (Witjesa and Lozanoa 2016).Yong (2007)andYuan et al. (2006)
Anthropocene Coasts Downloaded from www.nrcresearchpress.com by 139.81.27.25 on 10/17/18
indicated that such a circular economy has to be achieved by closing loops of different types and levels of recovery of valuable resources between parties in society. For instance, the food processing industry produces a lot of organic waste. The discharging of those organic wastes into rivers, lakes or coastal waters without treatment causes eutrophication and hypoxia in the aquatic system and increases GHG emissions. On the other hand, the processing and re-production of organic waste as a fertilizer reduces the amount of waste that is generated by the food processing industry with the added benefit of using natural fertilizer instead of chemicals.
Another example of circular economy is the generation of electricity using the CH4gas from manure in pig farms. Anaerobic digestion has been applied to treat swine waste (Montalvo 1995:Boopathy 1998;Hill and Bolte 2000). The process converts organic waste into biogas (which is a gas mixture of approximately 70% CH4and 30% CO2) that can be used to generate heat and (or) power. According toSu et al. (2003), the emission of CH4from an anaerobic swine wastewater treatment system in Taiwan is 0.768 kg per head per year and about 5756 tons annually. The average calorific value of biogas is about 6 kWh m−3, which corresponds to about half a litre of diesel fuel (FNR 2009). The CH4gas that is produced by a swine waste treatment system in Taiwan can generate up to about 52 million kWh m−3 of energy annually, which corresponds to 26 million L of diesel fuel. (The density of CH4is 0.668 kg m−3at 20 °C.) Based on the price of diesel oil in Taiwan (1 L of diesel oil cost around NT$ 22.2 in March 2017), the total economic value of the CH4gas from the swine waste treat-ment system in Taiwan is approximately NT$ 577 million (US$ 19 million, based on the exchange rate in March 2017).
(R4) Construction of infrastructure: building WWTPs
One of the most common forms of pollution control is wastewater treatment. Sewers collect wastewater from households, businesses, and many industries, and then deliver it to plants for treatment. Currently, most WWTPs provide a minimum of secondary treatment (EPA 2004;EC 2013). After the primary and secondary treatments have been performed in the WWTPs, 90% of the organic matter in the wastewater can be removed (EPA 2004). Because most of the pollutants and organic matter is absent from the waste-water beyond the WWTPs, the reclaimed waste-water can be reused or discharged into streams or coastal waters. Building WWTPs not only reduces the amount of pollutants and organic matter in rivers and coastal waters, but also increases their oxygen levels by reducing the COD (Fig. 5). Reducing the amount of organic matter and increasing the oxygen levels in rivers and coastal waters can reduce their CH4emissions. The CH4that is produced by the WWTPs can also be utilized as a form of energy (see R3 above).
(R5) Technological development: recycling reusable items and reducing waste
Recycling and reusing food waste and agricultural waste, such as rice straw, can reduce CH4emissions. In factories, recycling reusable items and material reclamation reduce waste. Environmentally friendly designs and new technology not only reduce the impact of industry on the environment, but also save on manufacturing costs.
The pulp and paper industry has found many ways to re-use their waste. For example, black liquor, a by-product of pulp production, is used as a fuel in a recovery boiler that can produce steam and electricity. Paper sludge, which contains a large amount of organic matter, can be recycled into a reusable product, such as glass aggregate, which is then used for various construction and industrial purposes (Holmen and its World 2009). Sludge from de-inking can be used as a fuel and as a binding agent in the production of building blocks (Holmen and its World 2009). Recycling used chopsticks and newspapers as paper pulp to make new paper not only reduces waste but also produces useful products.
Tseng et al. 79
Published by Canadian Science Publishing in partnership with East China Normal University
Anthropocene Coasts Downloaded from www.nrcresearchpress.com by 139.81.27.25 on 10/17/18
(R6) Application of agricultural technology: new rice cultivation methods
Rice cultivation is one of the main anthropogenic sources of atmospheric CH4and wet-land rice agriculture accounts for about 10% of global anthropogenic CH4 emission (Kirschke et al. 2013). Therefore, many studies on reducing CH4emissions from rice paddies have been published. With further research and the introduction of new rice cultivation methods, CH4emissions from the rice paddies and CH4concentrations in the water with which they are flooded can be reduced, reducing the flux of CH4from the flood water into rivers and the SCS.
Research has shown that installing single or multiple drainage in continuously flooded rice fields can reduce the average CH4fluxes from rice fields by about 52% to 60% (Cai
et al. 2003;Yan et al. 2005;Yan et al. 2009). Further research indicates that using slag-type silicate fertilizer, which contains a large amount of active iron oxide, suppresses the pro-duction of CH4and sustains rice productivity (Ali et al. 2008). Using rice straw off-season wherever and whenever possible further reduces CH4 emissions (Yan et al. 2009). According toIPCC (2013), the global CH4emission from rice fields is around 36 (33–40) Tg annually. New rice cultivation methods could reduce global CH4emission from rice fields by 19–22 Tg annually, based on the 52% to 60% flux reduction (Cai et al. 2003;Yan et al. 2005;Yan et al. 2009).
(R7) Optimization of agricultural practices: stop using excess agrochemicals and start smart fertilizer application
Agrochemicals provide many benefits, such as increased yields of plant and animal crops, and less spoilage during storage (Aktar et al. 2009). Genetically improved crop species and agrochemical applications have significantly increased crop yields (Warren 1998). Increasing food supply and improving food security for the rapidly increasing global popu-lation. However, excessive use of agrochemicals can lead to contamination of soil and groundwater (Aktar et al. 2009). In addition, the run-off of agricultural fertilizer into streams, lakes, and other surface waters can cause eutrophication (Newton et al. 2003). The ecological effects of eutrophication can include low oxygen content or hypoxia in water, increased CH4 concentrations and emissions, high mortality of fish, excessive growth of harmful algae, and poor tasting drinking water.
The timing of fertilizer application is important and significantly affects crop yields. Smart fertilizer use requires the establishment of a soil management plan that will create a more sustainable soil system. Using fertilizer at the correct time and in the correct amount or placing fertilizer at the proper depth can increase crop yields, reduce nutrient losses, increase the efficiency of nutrient use and prevent damage to the environment (Krans 2015). Smart fertilizer application also reduces the wasting of fertilizer, water usage, and cost.
Reducing the excessive use of agrochemicals through smart fertilizer application and environmentally friendly methods can maintain the benefits of the use of agrochemicals, such as high crop yields, while reducing water usage and costs. Thus, agricultural best prac-tice could substantially reduce CH4concentrations and emissions from rivers, lakes, and coastal waters.
(R8) Governance measures
Ostrom (2009)emphasized the importance of good governance at all levels, and the com-munity-based management of common pool resources, such as CH4gas hydrates. Here, we discuss governance measures from both national and international perspectives. Top-down management by the governmental authority can support various solutions for the reduc-tion GHG emissions, such as law enforcement, tax shifting, and internareduc-tional cooperareduc-tion.
Anthropocene Coasts Downloaded from www.nrcresearchpress.com by 139.81.27.25 on 10/17/18
Local–national governance measures
Local or municipal authorities usually make decisions on building, expanding or improv-ing WWTPs to protect the environment, reduce GHG emissions, improve the quality of water, and treat domestic sewage. National environmental laws can be used to control and reduce the amount of organic matter and nutrient pollution on land and into waters. Implementing environmental policy can improve land-use and urban planning, linking housing to sanitation facilities. Subsidies, taxes and fines may also be used nationally to encourage environmental friendly industries, such as by levying a tax on polluting compa-nies or pollutants on a“polluter pays” basis. For example, the government can levy a tax on chemical fertilizer and allocate the money thus collected to subsidize biogas plants.
Concerted actions of this type by a group of nations, such as the Water Framework Directive in Europe (EEA 2015), can result in significant abatement, such as the concentra-tion of phosphorus in European rivers (EEA 2005).
Regional–international governance measures
International cooperation, especially in the SCS, is difficult (Chen 2013). Historically, numerous conflicts and disputes have arisen concerning the SCS (Valencia 1995;Catley and Keliat 1997;Kivimaki 2002;Odgaard 2002). Nevertheless, joint scientific progress has been made in the region. For example, a project of the United Nations Environment Programme (UNEP) that was entitled“Reversing environmental degradation trends in the South China Sea and Gulf of Thailand” was implemented from 2002 to 2008. According to the research that formed part of this project, the socioeconomic impact of environmental deterioration was significant for the newly developed economies of this region (Bewers and Pernetta 2013). This environmental cooperative project provided an opportunity to exchange and share information for environmental protection and a forum in which duly accredited representatives of the participating countries could discuss environmental man-agement of the SCS (Chen 2013). Unfortunately, relations among countries that border the SCS have deteriorated significantly since 2009. Thus, after this project ended in 2008, no fol-low-up actions have been taken and no international cooperative association of the coun-tries around the SCS exists. Regional Seas Conventions, such as HELCOM (Baltic), the Bucharest Convention (Black Sea), and NOWPAP (North West Pacific) can provide a frame-work for international environmental protection, climate change mitigation, and adaption (Newton et al. 2014). Such participative conventions can also provide an international cooperative platform on which all the countries around the SCS can maintain environmental sustainability, such as by taking concerted actions to reduce the concentrations of organic matter in effluents that lead to CH4production.
4.2. Summary: societal response and management recommendations from DPSIR
A range of societal responses should be implemented across different time scales (from short to long), and spatial scales (local to international) to reduce CH4emissions in the SCS. The previous section discussed eight societal responses.Table 2presents the imple-mentation timeframe and relative cost of each response.
Relatively low-cost, immediate, and local management responses include the implementation of the following:
1. education and raising awareness (R1);
2. technological development (recycling reusable items and reducing waste) (R5);
3. optimization of agricultural practices (stop using excess agrochemicals and start smart
fer-tilizer application) (R7); and
4. local governance measures to implement recycling to reduce waste (R8).
Tseng et al. 81
Published by Canadian Science Publishing in partnership with East China Normal University
Anthropocene Coasts Downloaded from www.nrcresearchpress.com by 139.81.27.25 on 10/17/18
Relatively high-cost, long-term management responses that would provide enormous benefits include the following:
1. research into the exploitation of CH4gas hydrates, (R2); and
2. international governance measures, such as co-management of the SCS (R8).
4.3. Future study
Anthropogenic activities have increased GHG emissions since the industrial era and human activities have also increased the input of organic matter into rivers and coastal areas. Facing human-induced climate change and human-influenced coastal environments, more social–environmental research is needed. Additionally, in dealing with the complex issues of reducing GHG emissions, many interrelated factors exist, such as cost, level of technology development, and expenditures on research and development. To mitigate cli-mate change, many aspects must be considered, such as GHG emission monitoring, renew-able energy development, carbon tax levy, environmental law legislation, and climate policy implementation. All in all, future study on social–environmental analysis and multi-disciplinary approach are essential and may provide an appropriate recommendation for a lower human impacted environmental development.
5. Conclusions
In this study, a social-environmental approach was used to analyze the issue of CH4in the SCS. The economic drivers and human activities that cause pressure on the environ-ment and increase CH4emissions in the region are analyzed. These economic drivers and human activities are urbanization and increases in MSW production, economic growth, life-style change, increasing size of animal farming and aquaculture, rapid industrial develop-ment and developdevelop-ment of the bio-economy, and agricultural intensification. They impose environmental pressures by increasing the COD of water that is discharged into the SCS and increasing organic matter and CH4concentrations in rivers and the SCS. This research provides information about changes in environmental state based on available scientific data, and in particular on increased CH4concentrations and reduced DO concentrations Table 2. Timeframe, relative cost, and governance level involved in implementing societal responses.
Societal response
Timeframe for implementation
Relative cost of
implementation Governance level
(R1) Education and raising awareness Very short $ Local
(R5) Technological development: recycling reusable items and reducing waste
Very short $ Local
(R7) Optimization of agricultural practices: stop using excess agrochemicals and start smart fertilizer application
Very short $ Local
(R8) Local governance measures Very short $$ Local
(R6) Application of agricultural technology: new rice cultivation methods
Short $$ Local
(R8) National governance measures Short $$$ National
(R4) Construction of infrastructure: building WWTPs
Short $$$ Local/National/Regional
(R3) The development of the circular economy
Medium $$ Local/National
Regional/International (R2) Research into the exploitation of CH4
gas hydrates
Long $$$$$ Regional/International
(R8) International governance measures Very long $$$$ Regional/International
Note: Low cost, $; high cost, $$$$$.
Anthropocene Coasts Downloaded from www.nrcresearchpress.com by 139.81.27.25 on 10/17/18
in the SCS, increased temperatures as a result of the greenhouse effect of CH4, and destabi-lization of the seabed.
The possible future impact of climate change on human welfare is also discussed. These possible future impacts are reduced commercial fish hauls, increased vulnerability of coastal populations, potential collapse of offshore structures, new job opportunities and increased energy security as a result of the extraction of gas hydrates, and escalation of geo-political tensions because of valuable maritime resources.
Finally, possible societal responses and management measures that can be implemented to reduce CH4emissions in the SCS are identified. The responses are education, research into the exploitation of CH4gas hydrates, the development of the circular economy, the construction of infrastructure, the implementation of new technology and agricultural technologies, a reduction of agrochemicals and fertilizer use, and the implementation of governance measures.
Acknowledgements
The authors wish to thank the Ministry of Science and Technology of the ROC, Taiwan (MOST 105-2611-M-110-017 and MOST 105-2119-M-110-004) and the Aim for the Top University Program Project (05C 030204 and 06C 030203), for supporting this research. The first author thanks the international grant from Bank Santander/UNESCO Chair UNITWIN/WiCop and the Erasmus Mundus Programme for the MACOMA Doctoral funding contract (SGA 2012-1701/001-001-EMJD). Alice Newton’s research was partially supported by the Chinese Academy of Sciences (Yantai Institute of Coastal research professorship), DEVOTES project (EU 7FP grant agreement n°308392), and Future Earth Coasts. AVB is a senior research asso-ciate at the Fonds National de la Recherche Scientifique (FNRS).
References
Aktar, M.W., Sengupta, D., and Chowdhury, A. 2009. Impact of pesticides use in agriculture: their benefits and hazards. Interdiscip. Toxicol. 2(1): 1–12. doi:10.2478/v10102-009-0001-7. PMID:21217838.
Ali, M.A., Lee, C.H., and Kim, P.J. 2008. Effect of silicate fertilizer on reducing methane emission during rice cultivation. Biol. Fertil. Soils, 44: 597–604. doi:10.1007/s00374-007-0243-5.
Allison, E.H., Perry, A.L., Badjeck, M.-C., Adger, W.N., Brown, K., Conway, D., et al. 2009. Vulnerability of national economies to the impacts of climate change on fisheries. Fish Fish, 10: 173–196. doi:10.1111/j.1467-2979. 2008.00310.x.
Amundson, R. 2001. The carbon budget of soils. Annu. Rev. Earth Planet Sci. 29: 535–562. doi:10.1146/annurev. earth.29.1.535.
Archer, D. 2007. Methane hydrate stability and anthropogenic climate change. Biogeosciences, 4: 521–544. doi:10.5194/bg-4-521-2007.
Archer, D., Buffett, B., and Brovkin, V. 2009. Ocean methane hydrates as a slow tipping point in the global carbon cycle. Proc. Natl. Acad. Sci. USA, 106(49): 20596–20601. doi:10.1073/pnas.0800885105. PMID:19017807.
Asian Development Bank (ADB). 2011. Fast facts: urbanization in Asia. Asian Development Bank, Manila, Philippines.
Atkins, J.P., Burdon, D., Elliott, M., and Gregory, A.J. 2011. Management of the marine environment: integrating eco-system services and societal benefits with DPSIR framework in a eco-systems approach. Mar. Pollut. Bull. 62: 215–226. doi:10.1016/j.marpolbul.2010.12.012.
Bajpai, P. 2016. Chapter 2— Global pulp and paper production and consumption. Pulp Paper Indus. 2016: 9–14. doi:10.1016/B978-0-12-803411-8.00002-0.
Bange, H.W. 2006. Nitrous oxide and methane in European coastal waters. Estuarine, Coastal Shelf Sci. 70: 361–374. doi:10.1016/j.ecss.2006.05.042.
Bange, H.W., Bartell, U.H., Rapsomanikisa, S., and Andreae, M.O. 1994. Methane in the Baltic and North Seas and a reassessment of the marine emissions of methane. Global Biogeochem. Cycles, 8(4): 465–480. doi:10.1029/ 94GB02181.
Barnosky, A.D. 2008. Colloquium Paper: Megafauna biomass tradeoff as a driver of Quaternary and future extinc-tions. Proc. Natl. Acad. Sci. USA, 105: 11543–11548. doi:10.1073/pnas.0801918105. PMID:18695222.
Ben Rais Lasram, F., Guilhaumon, F., Albouy, C., Somot, S., Thuiller, W., and Mouillot, D. 2010. The Mediterranean Sea as a‘cul-de-sac’ for endemic fishes facing climate change. Glob. Chang. Biol. 16: 3233–3245. doi: 10.1111/j.1365-2486.2010.02224.x.
Bewers, J.M., and Pernetta, J.C. 2013. Special issue on South China Sea Project. Ocean Coast Manage. 85: 268–275. doi:10.1016/j.ocecoaman.2012.12.008.
Tseng et al. 83
Published by Canadian Science Publishing in partnership with East China Normal University
Anthropocene Coasts Downloaded from www.nrcresearchpress.com by 139.81.27.25 on 10/17/18