February 13, 2019
Combined asteroseismology, spectroscopy, and astrometry of the
CoRoT B2V target HD 170580
?
C. Aerts
1, 2, 3, M. G. Pedersen
1, E. Vermeyen
1, L. Hendriks
2, C. Johnston
1, A. Tkachenko
1, P. I. Pápics
1, J.
Debosscher
1, M. Briquet
4, A. Thoul
3, 4, M. Rainer
5, 6, and E. Poretti
61 Instituut voor Sterrenkunde, KU Leuven, Celestijnenlaan 200D, 3001 Leuven, Belgium
e-mail: Conny.Aerts@ster.kuleuven.be
2 Department of Astrophysics/IMAPP, Radboud University Nijmegen, 6500 GL Nijmegen, The Netherlands 3 Kavli Institute for Theoretical Physics, University of California, Santa Barbara, CA 93106, USA
4 Space sciences, Technologies and Astrophysics Research (STAR) Institute, Université de Liège, 17 Allée du 6 Août 19C, Bat. B5C,
4000, Liège, Belgium
5 INAF - Osservatorio Astrofisico di Arcetri Largo E. Fermi 5, 50125 Firenze, Italy 6 INAF - Osservatorio Astronomico di Brera, via E. Bianchi 46, 23807 Merate, Italy
Submitted/Accepted
ABSTRACT
Context.Space asteroseismology reveals that stellar structure and evolution models of intermediate- and high-mass stars are in need
of improvement in terms of angular momentum and chemical element transport.
Aims.We aim to probe the interior structure of a hot massive star in the core-hydrogen burning phase of its evolution.
Methods.We analyse CoRoT space photometry, Gaia DR2 space astrometry, and high-resolution high signal-to-noise HERMES and
HARPS time-series spectroscopy of the slowly rotating B2V star HD 170580.
Results.From the time-series spectroscopy we derive v sin i= 4±2 km s−1, where the uncertainty results from the complex pulsational
line-profile variability that was so far ignored in the literature. We detect 42 frequencies with amplitude above five times the local noise level. Among these we identify five rotationally split triplets and one quintuplet. Asteroseismic modelling based on CoRoT, Gaia DR2 and spectroscopic data leads to a star of M ∼ 8 M near core-hydrogen exhaustion and an extended overshoot zone. The
detected low-order pressure-mode frequencies cannot be fit within the uncertainties of the CoRoT data by models without atomic diffusion. Irrespective of this limitation, the low-order gravity modes reveal HD 170580 to be a slow rotator with an average rotation period between 73 and 98 d and a hint of small differential rotation.
Conclusions.Future Gaia DR3 data taking into account the multiplicity of the star, along with long-term TESS photometry would
allow to put better observational constraints on the asteroseismic models of this blue evolved massive star. Improved modelling with atomic diffusion, including radiative levitation, is needed to achieve compliance with the low helium surface abundance of the star. This poses immense computational challenges but is required to derive the interior rotation and mixing profiles of this star.
Key words. Asteroseismology - Stars: interiors - Stars: evolution - Stars: oscillations (including pulsations) - Stars: rotation - Stars: individual: HD 170580
1. Introduction
In the context of the chemical evolution of galaxies, stars of spec-tal type O and B play a dominant role. It is therefore essential to know the amount of helium in the core at the end of their
main-Send offprint requests to: Conny.Aerts@kuleuven.be
? Based on photometric data assembles with the CoRoT space
mis-sion, which was developed and operated by the French space agency CNES, with participation of ESA’s RSSD and Science Programmes, Austria, Belgium, Brazil, Germany and Spain. Based on spectroscopic observations made with the HERMES spectrograph supported by the Research Foundation Flanders (FWO), Belgium, the Research Coun-cil of KU Leuven, Belgium, the Fonds National Recherches Scientific (FNRS), Belgium, the Royal Observatory of Belgium, the Observatoire de Genève, Switzerland, and the Thüringer Landessternwarte Tauten-burg, Germany; HERMES is attached to the Mercator telescope, op-erated by the Flemish Community on the island of La Palma at the Spanish Observatorio del Roque de los Muchachos of the Instituto de Astrofísica de Canarias. Also based on spectroscopy made with the ESO 3.6m telescope at La Silla Observatory under the ESO Large Pro-gramme LP182.D-0356.
sequence phase (TAMS), because this determines the efficiency and amount of heavy element production during the final 10% of such stars’ lives. Determining the helium core mass of OB-type stars, which are born with a well-developed convective core and a radiative envelope, requires a quantitative estimate of the level and shape of the core overshooting properties and chemical mix-ing in the envelope for a representative sample of such stars. This sample must cover the entire main sequence and various levels of stellar rotation. Traditionally, the macroscopic envelope mixing in radiatively stratified layers of stars has been assumed to have a rotational origin (e.g., Brott et al. 2011). However, this does not offer a satisfactory explanation for slowly rotating OB stars that are nitrogen enriched (e.g. Dufton et al. 2018). Moreover, pulsational mixing was found to be an alternative interpretation for slow to moderate rotators based on observational and numer-ical studies of the rotation and waves active in B stars (Aerts et al. 2014; Rogers & McElwaine 2017). Along with the fact that internal gravity waves are also able to explain the angular mo-mentum transport needed to bring stellar models in agreement with the interior rotation rates derived from asteroseismology
(Rogers 2015; Aerts et al. 2019), the search for and modelling of non-radial pulsators born with a mass about 8 M was recently intensified.
Thanks to high-precision uninterrupted space photometry of long duration, it has become possible to derive a quantitative model-independent measurement of the interior rotation of B stars from detected non-radial gravity modes and their period spacing patterns (Triana et al. 2015; Pápics et al. 2017; Kallinger et al. 2017; Szewczuk & Daszy´nska-Daszkiewicz 2018). Astero-seismic modelling of such modes in B stars also offers estimation of the core overshooting (and along with it the core mass) and of the level of macroscopic chemical element transport in the envelope, as first established by Moravveji et al. (2015, 2016). Meanwhile, statistical methodology taking into account the ef-fects of the Coriolis force for the computation of the mode fre-quencies and parameter degeneracies in the estimation was de-veloped by Aerts et al. (2018) for single stars and by Johnston et al. (2019) for binaries. Those methodological frameworks re-quire frequency precisions from time-series data covering sev-eral times the ovsev-erall beating pattern due to the rotational and pulsational variability, as well as unambiguous identification of the degree and azimuthal order of the modes from frequency splittings (Triana et al. 2015) and/or from period spacing pat-terns (Pápics et al. 2014, 2015, 2017; Szewczuk & Daszy´nska-Daszkiewicz 2018).
Gravity-mode asteroseismology of B stars came on the radar after the first discovery of period spacings expected for such modes in CoRoT space photometry of the slowly rotating B3V star HD 50230 (Degroote et al. 2010). This gave the first oppor-tunity for asteroseismic estimation of the amount of core over-shooting based on gravity modes in a core-hydrogen burning star. Adopting the description of convective penetration by Zahn (1991), Degroote et al. (2010) found a value between 0.2 and 0.3 local pressure scale heights, for a star with M ∈ [7, 8] M and a central hydrogen mass fraction of some 0.28, adopting so-lar metallicity. Moreover, the very small yet clearly periodic de-viations from a constant period spacing pattern implied a tran-sition region between the core overshoot zone and the radia-tive envelope, where chemical mixing occurs at the level of Dmix ' 10, 000 cm2s−1. These first rough results based on as-teroseismic inference relying on gravity modes were confirmed by Hendriks & Aerts (2019), adopting a machine-learning ap-proach for grid-based asteroseismic modelling.
The 5-months long CoRoT monitoring turned out to be barely sufficient in duration to discover gravity-mode period spacings and to establish inferences of the mass, age, convec-tive core overshooting and envelope mixing. Those quantities can be assessed roughly, but only by fixing the initial hydrogen fraction and metallicity. However, this time base is insufficient to assess the interior physics properties with high precision, un-less one has additional independent information. This was the case for the CoRoT target HD 43317, which was found to be a magnetic gravity-mode B-type pulsator rotating at half its crit-ical rotation rate (Pápics et al. 2012; Briquet et al. 2013). In a combined polarimetric asteroseismic study, Buysschaert et al. (2017) and Buysschaert et al. (2018) were able to derive a high-precision estimate of the surface rotation frequency of this star, which subsequently allowed forward asteroseismic modelling. Although limited in capacity due to the limited number of identi-fied modes, this revealed a relatively young star of ∼ 5.8 M with a very weak core overshooting of value fov' 0.004, assuming an exponential functional form as proposed by Freytag et al. (1996) and adopting the radiative temperature gradient in the overshoot zone. It is tempting to assign the limited overshooting to the
in-hibition of particle mixing from the magnetic field, but the errors for fov' 0.004 were too large to come to a firm conclusion. The 5-month CoRoT light curve is not long enough to detect su ffi-cient independent gravity modes, due to the limited frequency resolution.
The Kepler space mission (Gilliland et al. 2010) monitored stars during four years, leading to a ten times better frequency resolution than achieved with CoRoT. Thanks to these 4-year uninterrupted light curves, gravity-mode asteroseismology of core-hydrogen burning stars is meanwhile an established prac-tise (Aerts et al. 2018). Nevertheless, applications to B stars are still scarce because a limited sample was monitored and among those only a handful were found to reveal appropriate and well identified modes so far (Aerts et al. 2019). In order to improve stellar evolution models of OB-type stars from asteroseismology, the sample of modelled stars must be increased drastically. Stud-ies of numerous Kepler, K2, BRITE, and TESS B-type targets are ongoing or foreseen with this aim. In anticipation of those, and with the knowledge assembled from Kepler B-star astero-seismology, we consider a CoRoT B-type target in an attempt to detect and interpret gravity-mode oscillations in this B2V star.
2. The target star HD 170580
After a preparatory spectroscopic study by Morel & Aerts (2007), the B2 primary star of the multiple system HD 170580 (V magnitude 6.7) was accepted as primary asteroseismology target for the sixth long run of the CoRoT space mission (Au-vergne et al. 2009). As such it was also included in the ESO Large Programs for ground-based follow-up spectroscopy of CoRoT asteroseismology targets with the HARPS spectrograph (Poretti et al. 2013), the data products of which have been made available in the SIMBAD archive (Rainer et al. 2016). The choice for this star, despite its poorly known multiplicity, was motivated by its spectroscopic similarity to HD 50230, in addi-tion to it being situated in an acceptable area on the sky for exo-planet hunting in the adjacent CCDs. Indeed, just as HD 50230, HD 170580 was known to have a very low projected rotation velocity, with v sini = 11 ± 1 km s−1 derived by Lefever et al. (2010) and v sini = 3 ± 1 km s−1 by Bragança et al. (2012), while Morel & Aerts (2007) found the overall rotational, pul-sational, and microturbulent spectral line broadening to be be-low 10 km s−1. Hence, the prospects of finding another case with gravity-mode period spacings were good. Its spectroscopic stel-lar parameters were found to be typical for its spectral type: Teff= 20 000 ± 1 000 K, log g = 4.10 ± 0.15, where we note that systematic uncertainties of log g occur and make this observable far less reliable than Teff. Further, Morel & Aerts (2007) found Z = 0.0095 ± 0.0030 and the NLTE abundance determinations by both Morel & Aerts (2007) and Lefever et al. (2010) revealed a He-weak star with He/H=0.048±0.021 (by number). This low helium fraction, along with the low metallicity and very slow rotation, implies that atomic diffusion is active in the star (e.g., Michaud et al. 2015, for a monograph). As discussed by, e.g., Deal et al. (2016) and Aerts et al. (2018), radiative levitation has not been included in asteroseismic modelling of coherent non-radial oscillation modes in OBA-type stars, because it is compu-tationally too demanding. Aerts et al. (2018, Fig. 10) showed that ignoring atomic diffusion typically leads to high-order gravity-mode frequency uncertainties near 0.001 d−1for the mass range relevant for HD 170580. However, the frequencies of low-order pressure modes are affected appreciably by atomic diffusion (up to 1 d−1). We keep this in mind in the modelling discussed below.
With its temperature and gravity, HD 170580 is situated at the hot blue end of the instability strip of the Slowly Pulsating B Stars (SPBs), in the overlapping region with the β Cep strip (Szewczuk & Daszy´nska-Daszkiewicz 2017), so the star has the potential to be a hybrid pressure and gravity mode pulsator. CoRoT observations of HD 170580 were assembled during the third long run in the direction of the Galactic centre (LRc03), and lasted some 170 days. Initial analyses of the CoRoT and spectro-scopic data revealed a different level and kind of variability than for HD 50230. The multiperiodicity of HD 170580 occurs at a level of 100 ppm instead of 1 000 ppm for HD 50230 and no ob-vious period spacing pattern could be found, leaving the detected mode frequencies unidentified and hence forward modelling im-possible. With the knowledge gained from Kepler SPB astero-seismology and with a Gaia DR2 parallax available, we now re-examine the newly calibrated CoRoT light curve of HD 170580 (Sect. 2). Subsequently, we analyse the high-resolution time-resolved spectroscopy (Sect. 3), compare the observational data with stellar models (Sect. 4) and come to conclusions on the overall variability behaviour of the star (Sect. 5).
3. CoRoT Photometry
The CoRoT data of HD 170580 were obtained during a long run, from BJD 2455293.39 until 24455463.84 (with an inter-ruption of about 2 days between BJD 2455382.74 and BJD 2455384.57). The light curve spans a total of 170.5 days, leading to a Rayleigh limit of 1/170.5= 0.00587 d−1and hence a resolv-ing power for frequency analysis from a prewhitenresolv-ing procedure of ∼ 1.5/170.5 = 0.0088 d−1 (Loumos & Deeming 1978). The CoRoT asteroseismology CCDs operated with a time sampling of 32 s. After removal of bad points and outliers, the light curve contained ∼ 400 000 data points, corresponding to an effective duty cycle of 88%.
We first computed the Lomb-Scargle periodogram (Scargle 1982) of this original light curve and found all variability to occur on time scales of hours to weeks. Hence, the data were largely oversampled. In order to reduce the computation time of the frequency analysis, we initially worked with two data sets: one with the original time steps and one for which the fluxes were averaged over each set of 10 consecutive data points. Since these two data sets led to the same results, we used the latter one for the detailed frequency analysis.
3.1. Detrending
Long-term trends in the data were removed by dividing the mea-sured fluxes by a polynomial fit to the light curve. We used poly-nomials of various degrees and detrended in two ways for each of them: once for the light curve as a whole and once for each of the two separated sub-runs. In the end, we detrended by one global 3rd-order polynomial, as this delivered the best compro-mise in view of two properties:
1. an instrumental effect occurring the first days after the start and interruption of the run, showing a marked increase in the flux level;
2. the intrinsic stellar variability, which occurs on time scales of both hours and weeks.
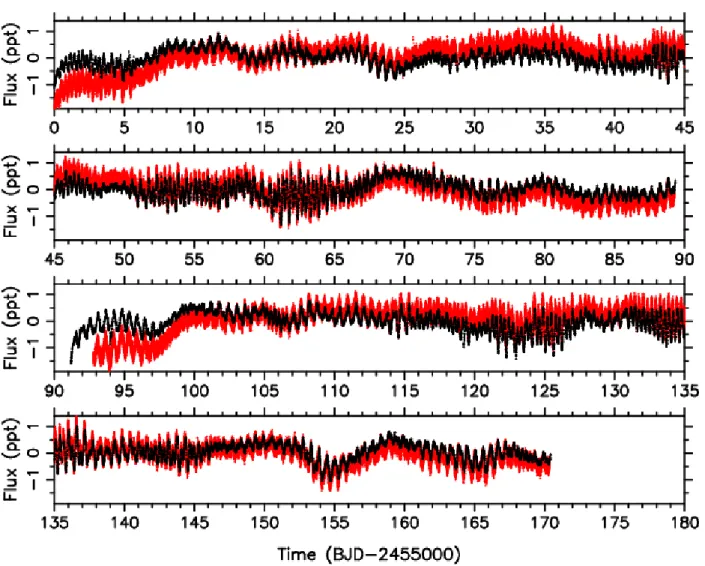
After detrending, all fluxes were converted to ppm. Two versions of the light curve are shown in Fig. 1. The red dots represent the original light curve with 32 s sampling, where part of the curve after the interruption was omitted, while the black dots are
the result after averaging to a ten times less dense sampling and dividing by one global 3rd-order polynomial for the entire light curve.
All the different approaches for the detrending we tried in the end resulted in the same values for the extracted frequen-cies of the star (within the errors). The choice of the detrending only changed frequencies in the low-frequency regime, where instrumental effects and stellar oscillations cannot be reliably distinguished from each other. We chose to proceed with global detrending of the overall light curve by the best fit third-order polynomial derived from the red curve in Fig. 1 and work with the black curve for the frequency analysis. This method led to the highest precision for the derived frequencies and there was no good reason that justified separate detrending for different parts of the light curve.
The Lomb-Scargle periodograms of both versions of the light curve shown in Fig. 1 are plotted in the upper panel of Fig. 2 with the same colour convention. It can be seen that the detrend-ing affects the lowest frequency regime. These frequencies must therefore be treated with caution. In the rest of the paper, we rely on the version of the light curve shown in black in Fig. 1.
3.2. Frequency analysis
In order to extract frequencies from the data, an iterative prewhitening procedure was applied. We used the method devel-oped by Degroote et al. (2009) and further improved by Pápics et al. (2012). The Lomb-Scargle periodograms for the two ver-sions of the light curve are shown in the top panel of Fig. 2. At each step of the prewhitening procedure, the frequency with maximum amplitude was identified in the periodogram. This fre-quency value, along with all frequencies, amplitudes, and phases found from previous prewhitening stages, were fed into a non-linear least squares (NLLS) fit to the detrended light curve and the residual light curve was computed. Because we are dealing with periodic signals of amplitudes below 150 ppm, it is justified to subtract the NLLS fit from the detrended light curve in ppm to start the search for the next frequency.
Following this method, the prewhitening procedure was stopped when the signal-to-noise ratio (S/N) of a frequency in the amplitude spectrum, calculated in an interval of width 2 d−1 centered on the detected frequency, dropped below the canoni-cal value of four (Breger et al. 1993). This resulted in 177 ex-tracted frequencies. However, Baran et al. (2015) showed that demanding an amplitude above 5 S/N is a more appropriate cri-terion to prevent over-interpretation for densely sampled space photometry with a time base of only a few months, as is the case for CoRoT or short-cadence K2 data. We confirm this result, as many of the 84 frequencies with amplitude between four and five times the local noise level turn out to be unresolved with respect to higher-amplitude frequencies. We therefore only considered the 93 frequencies that meet the more conservative criterion of having an amplitude above 5 S/N.
Not all of the 93 frequencies that meet the adopted S/N cri-terion are intrinsic to the star. Among them we found fW = 13.9693 d−1, which is a well-known frequency connected with the CoRoT satellite orbit (Auvergne et al. 2009). This frequency and its harmonics were excluded for asteroseismic interpreta-tion. Further, the frequency f41 = 2.0069 d−1 was found. This frequency is due to the crossing of the South Atlantic Anomaly, which happens twice per day (Poretti et al. 2010, 2011). We listed it in Table 1 but we did not use it for further interpreta-tion. In addition, all frequencies below 0.5 d−1were discarded. There may be oscillation frequencies and/or harmonics of the
Fig. 1. Two versions of the CoRoT light curve of HD 170580 (red: original light curve with 32 s sampling, black: reprocessed light curve with 320 s sampling and detrended by a 3rd-order polynomial).
rotation frequency in this region but they cannot be distinguished from frequencies induced by instrumental effects (cf. Fig. 1 and the inset in the top panel of Fig. 2). All frequencies equal to a combination of frequencies with at least one component below 0.5 d−1were also excluded, as well as those that differ less than the Rayleigh limit from a previous one with larger amplitude. Thanks to our conservative approach in terms of S/N, we found only two frequencies that survive this selection while not being fully resolved according to the Loumos & Deeming (1978) cri-terion ( f16− f17' 0.0087, cf. Table 1).
After these strict selection criteria, the 42 frequencies in ad-dition to f41listed in Table 1 are attributed to the star and further explored. Degroote et al. (2009) presented an extended analysis of the noise properties of the oversampled CoRoT asteroseismol-ogy data and concluded that the formal errors for the parameters resulting from a NLLS fit need to be corrected for the correlated nature of the data. As in that paper, we applied the procedure described in Schwarzenberg-Czerny (2003) to compute an aver-age correction factor for the NLLS errors of the frequencies and amplitudes based on the residual light curve and obtained 1.84. This factor has been taken into account in the errors reported in Table 1.
The 42 frequencies of the star listed in Table 1 occur in two groups: one between 1.45 d−1and 2.25 d−1and another one be-tween 3.1 d−1 and 3.9 d−1. Zoomed versions of the original
Lomb-Scargle periodogram are shown in the middle and bot-tom panels of Fig. 2 for these two regions. There is only one extracted frequency that does not belong to one of those two groups, namely f38 = 8.4402 d−1.
Before interpreting the frequencies asteroseismically, it is necessary to check for combination frequencies. Indeed, devi-ations of the star from spherical symmetry, non-linear effects and interactions between different oscillation modes can result in frequencies that are linear combinations of their parent fre-quencies (Degroote et al. 2009; Pápics 2012; Kurtz et al. 2015). Combination frequencies do not necessarily correspond to eigen-modes of the star, as they may also just be a consequence of the non-linearity of the light curve. For asteroseismic modelling pur-poses, it is important to identify combination frequencies and unravel if they can be due to an eigenfrequency of the star or not. The CoRoT light curve of HD 170580 does not reveal har-monics of single frequencies (i.e. combinations of the form c1fi with c1 ∈ N). The search for combinations of two frequencies (i.e. of the form c1fi+ c2fj with c1, c2 ∈ Z) was split into two steps. For positive combinations (c1, c2 > 0), we allowed for a large number of values of c1 and c2. The result was 12 pos-sible combinations of second order and one of third order. In the second search, c1 and c2were allowed to become negative. The frequency difference between the two groups is such that a coincidental match becomes increasingly likely for higher-order
Fig. 2. Upper panel: Lomb-Scargle periodograms of the CoRoT data shown in Fig. 1 with the same colour convention. Middle and lower panel: zoomed regions of interest, where the zonal mode frequencies used for the forward modelling are indicated by (red) dashed lines, the other multiplet components by (blue) dotted lines and combination fre-quencies by (purple) dashed-dot-dot-dot lines.
combinations, so we only searched for differences between two frequencies. That way, 9 more second-order combinations were found. All identified combination frequencies are listed as such in the column “Notes” of Table 1, where the less probable iden-tifications are flagged with a question mark.
The interpretation of the combination frequencies is not ob-vious, as the frequency spectrum is dense in the two groups of frequencies. Hence, the probability of a coincidental mathemati-cal match is correspondingly high, keeping in mind the Rayleigh limit. Given that harmonics do not occur and there is no clear
pattern for most combination frequencies, it is likely that most are just coincidental mathematical matches. There are only two exceptions to that. First, all frequencies of the first group below 1.6 d−1 are flagged as a difference between a frequency of the second and a frequency of the first group (cf. middle panel of Fig. 2). As at least one high-amplitude peak is involved in each of those combinations, this is probably due to a physical effect connected with non-linear mode behaviour. Second, the only fre-quency not belonging to one of the two groups is a third-order combination frequency ( f38 ' f3+ 2 f6). We conclude from our frequency analysis that there are two groups of independent os-cillation mode frequencies of the star, because none of the two groups can be fully explained as combination frequencies of the other.
The frequency values of the independent modes of HD 170580 (Table 1) are lower than the typical frequency range for low-order non-radial pressure modes in β Cep stars, while they are higher than the frequencies of high-order gravity modes of SPBs, notably those detected in the CoRoT data of HD 50230 (Degroote et al. 2012). Shifts towards higher frequencies for high-order gravity modes in SPBs can be caused by fast rota-tion (Pápics et al. 2017; Buysschaert et al. 2018), but given the low v sini this can only be invoked for HD 170580 if we see it almost exactly pole on. However, in that case one would not
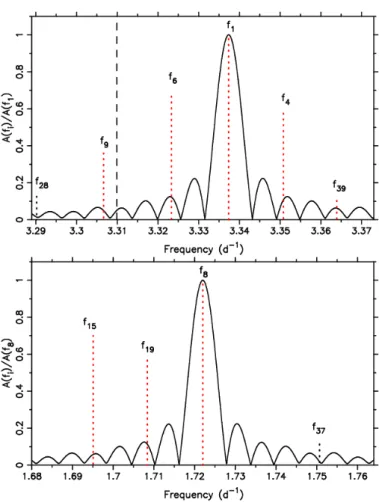
Fig. 3. Two zoomed parts of the amplitude spectrum, where the length of the x-axis equals ten times the Rayleigh limit. The spectral window (full line) is placed at the local dominant frequency (cf. Table 1). Dot-ted lines indicate the extracDot-ted frequencies whose amplitude was nor-malised to the dominant one in that frequency regime (top: f1, bottom:
f8). Black dotted lines indicate combination frequencies. The dashed
line in the upper panel is placed at the position where the fifth quintu-plet component would occur in the case of equal splitting.
expect to detect the three components of triplets while we do so (cf. Fig. 2). Moreover, a fast rotating star is not expected to be subjected to the effects of atomic diffusion, while this phe-nomenon is active in HD 170580 given its low measured surface helium and metal abundances. These facts make it more proba-ble that the frequencies of the star are due to low-order modes seen from a viewing angle that does not coincide with its pole. In that case the zonal mode frequency values imply a more mas-sive and more evolved star compared with HD 50230. Hendriks & Aerts (2019) found M ∼ 7.9 M and a central hydrogen mass fraction of Xc∼ 0.17 for HD 50230. We keep this information in mind in the mode identification and modelling described below. Examination of the frequencies not due to combinations in Table 1 did not reveal any obvious gravity-mode period spacing pattern as it has been found for various other SPB pulsators from space photometry (cf. Table B1 in Szewczuk & Daszy´nska-Daszkiewicz 2018, for an update and typical values). This is not so surprising because the detected frequencies of HD 170580 likely correspond with low-order pressure or gravity modes and these are not expected to reveal period spacing patterns. However, we do find six multiplets. Five of these are triplets with splitting values ranging from 0.0108 to 0.0147 d−1: ( f15, f19, f8) with spacings of 0.0133±0.0015 d−1 and 0.0138±0.0016 d−1, ( f
12, f2, f18) with spacings of 0.0134±0.0015 d−1 and 0.0134±0.0017 d−1, ( f7, f24, f5) with spacings of 0.0131±0.0017 d−1 and 0.0127±0.0016 d−1, ( f40, f26, f3) with spacings of 0.0122±0.0016 d−1 and 0.0108±0.0024 d−1, and ( f43, f23, f31) with spacings of 0.0135±0.0021 d−1 and 0.0147±0.0022 d−1. The other one is a set of four components of a quintuplet ( f6, f1, f4, f39), with spacings of 0.0140±0.0011 d−1, 0.0135±0.0010 d−1, and 0.0131±0.0017 d−1. These frequency splittings have values between 1.9 and 2.5 times the Rayleigh limit and are indicated as blue dotted lines in Fig. 2. The detected frequencies for two of the multiplets have been plotted with respect to the spectral window in Fig. 3, from which we see that the frequency f9 is shifted by 0.0167±0.0016 d−1from f6. The difference with the splitting value of the other components (cf. red dotted and black dashed line in Fig. 3) is only about half the Rayleigh limit so f9 cannot formally be distinguished from the leftmost quintuplet component. From Fig. 3 we deduce that the dominant spectral window frequency peak of the first sidelobe occurs with an amplitude of 22% at 1.4 times the Rayleigh limit. In particular, f4 and f6 occur in the second sidelobe of the spectral window centered at f1, which has an amplitude less than 5%, leaving no doubt about the reality of the frequencies indicated as multiplets in Table 1. However, as indicated in Table 1 several of the triplet components with low amplitude differ less than the Rayleigh limit from combination frequencies. We keep this in mind in the modelling discussed in Sect. 6.
We conclude to have found evidence of six multiplets in the CoRoT data of HD 170580. These six multiplets are compat-ible with rotational splitting of dipole or quadrupole low-order modes. Interpreting them as such and adopting the Ledoux ap-proximation, for which the splitting values between adjacent multiplet frequencies is given by (1 − Cnl)Ω with Ω the an-gular rotation frequency under the assumption of rigid rotation (Ledoux 1951) , leads to Ω ∈ [0.0108, 0.0294] d−1because low-order pressure and gravity modes have Cnl ∈ [0.0, 0.5] (e.g., Aerts et al. 2010, Chapter 3). This implies that HD 170580 has a rotation period averaged throughout the star between roughly 34 and 93 d. We refine this interval below, after modelling of the zonal modes, keeping in mind that low-order pressure-mode splittings are model dependent (through their model dependency
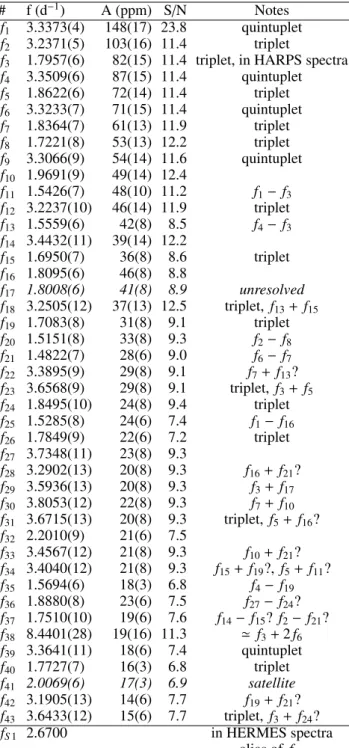
Table 1. Extracted frequencies of HD 170580 with amplitude above 5 times the local noise level. The formal errors from a NLLS fit were corrected for the correlated nature of the data following Schwarzenberg-Czerny (2003) and are indicated in brackets at the level of the last dig-its. The significance (in terms of S/N) was computed over an interval of 2 d−1centered on the prewhitened frequency. The frequencies in italic
are omitted in the interpretation – see text for discussion of the notes. The last row lists the dominant frequency found in the HERMES spec-troscopy, while f3was recovered in the HARPS spectra.
# f (d−1) A (ppm) S/N Notes
f1 3.3373(4) 148(17) 23.8 quintuplet f2 3.2371(5) 103(16) 11.4 triplet
f3 1.7957(6) 82(15) 11.4 triplet, in HARPS spectra f4 3.3509(6) 87(15) 11.4 quintuplet f5 1.8622(6) 72(14) 11.4 triplet f6 3.3233(7) 71(15) 11.4 quintuplet f7 1.8364(7) 61(13) 11.9 triplet f8 1.7221(8) 53(13) 12.2 triplet f9 3.3066(9) 54(14) 11.6 quintuplet f10 1.9691(9) 49(14) 12.4 f11 1.5426(7) 48(10) 11.2 f1− f3 f12 3.2237(10) 46(14) 11.9 triplet f13 1.5559(6) 42(8) 8.5 f4− f3 f14 3.4432(11) 39(14) 12.2 f15 1.6950(7) 36(8) 8.6 triplet f16 1.8095(6) 46(8) 8.8 f17 1.8008(6) 41(8) 8.9 unresolved f18 3.2505(12) 37(13) 12.5 triplet, f13+ f15 f19 1.7083(8) 31(8) 9.1 triplet f20 1.5151(8) 33(8) 9.3 f2− f8 f21 1.4822(7) 28(6) 9.0 f6− f7 f22 3.3895(9) 29(8) 9.1 f7+ f13? f23 3.6568(9) 29(8) 9.1 triplet, f3+ f5 f24 1.8495(10) 24(8) 9.4 triplet f25 1.5285(8) 24(6) 7.4 f1− f16 f26 1.7849(9) 22(6) 7.2 triplet f27 3.7348(11) 23(8) 9.3 f28 3.2902(13) 20(8) 9.3 f16+ f21? f29 3.5936(13) 20(8) 9.3 f3+ f17 f30 3.8053(12) 22(8) 9.3 f7+ f10 f31 3.6715(13) 20(8) 9.3 triplet, f5+ f16? f32 2.2010(9) 21(6) 7.5 f33 3.4567(12) 21(8) 9.3 f10+ f21? f34 3.4040(12) 21(8) 9.3 f15+ f19?, f5+ f11? f35 1.5694(6) 18(3) 6.8 f4− f19 f36 1.8880(8) 23(6) 7.5 f27− f24? f37 1.7510(10) 19(6) 7.6 f14− f15? f2− f21? f38 8.4401(28) 19(16) 11.3 ' f3+ 2 f6 f39 3.3641(11) 18(6) 7.4 quintuplet f40 1.7727(7) 16(3) 6.8 triplet f41 2.0069(6) 17(3) 6.9 satellite f42 3.1905(13) 14(6) 7.7 f19+ f21? f43 3.6433(12) 15(6) 7.7 triplet, f3+ f24? fS1 2.6700 in HERMES spectra alias of f31
of Cnl), while high-order gravity-mode splittings are not depend-ing on stellar models because their Cnl ' 1/[l(l+ 1)] (see Aerts et al. 2010, 2019, for a more extended explanation). Irrespective of possible model dependence for the derivation ofΩ, it concerns slow rotation compared to the periods of its oscillation modes, with fi/Ω < 0.02 for all i = 1, . . . , 42 in Table 1 and implies that
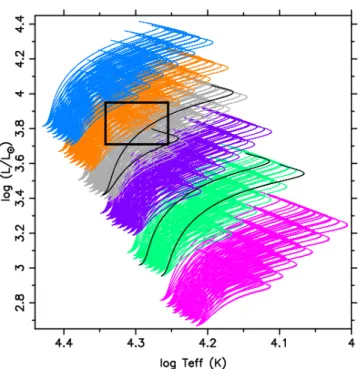
Fig. 4. Herzsprung-Russell Diagram with the 240 evolutionary tracks per mass in the SpaceInn grid for the masses 5 (pink), 6 (green), 7 (pur-ple), 8 (grey), 9 (orange), 10 (blue) M , along with the 2σ error box of
HD 170580 based on Gaia DR2 data and spectroscopy. The pulsation modes of the four tracks in black are shown in Fig. 8.
the Coriolis and centrifugal forces can be ignored when fitting the detected oscillation frequencies.
4. Luminosity from Gaia DR2
We developed a procedure to derive the luminosity of pulsating B stars observed with space photometry from the Gaia DR2 data release (Luri et al. 2018).1 The luminosity of HD 170580 was determined using the distance of the star provided by Bailer-Jones et al. (2018) as d = 408.83 pc, with a 1σ confidence in-terval of [399.30, 418.83] pc, on the basis of Gaia DR2 parallax measurements (Gaia Collaboration et al. 2018; Luri et al. 2018). Based on the apparent magnitudes measured in the Johnson UBV, Cousins RI, TYCHO BV and 2MASS JH filters, we calcu-lated the apparent bolometric magnitude mbol= 3.48 ± 0.15 after correcting for extinction. The estimated extinction in each fil-ter was obtained using the corresponding effective wavelengths as input for the York Extinction Solver (McCall 2004), assum-ing the reddenassum-ing law by Fitzpatrick (1999), with RV = 3.07 for Vega and a reddening of E(B − V)= 0.41 ± 0.04 obtained from the reddening map published in Green et al. (2018). In order to convert the apparent magnitudes into the bolometric scale, syn-thetic bolometric corrections were calculated for each filter from Castelli & Kurucz (2004) model atmospheres. These bolometric corrections were calibrated such as to achieve the absolute filter magnitudes of the Sun, assuming Mbol, = 4.74 as in Torres et al. (2010).
In this way, we obtained log(L/L ) = 3.83 ± 0.06, where we must keep in mind that the multiplicity was not yet treated in Gaia DR2 data and this may imply an unknown systematic uncertainty for L. Using this result along with Teff = 20 000 ± 1 000 K from Morel & Aerts (2007), we indicate the position of 1 This procedure will be described in detail in a separate paper
Peder-sen et al., in preparaton, and is omitted here.
HD 170580 in the Hertzsprung-Russell (HRD) diagram using a 2σ error box in Fig. 4, along with evolutionary tracks for stellar models with masses 5, 6, 7, 8, 9, 10 M (these will be discussed below). Irrespective of the precise mass, we find that the star no longer resides near the ZAMS but refinement of its evolution-ary stage requires seismic modelling. The Gaia luminosity and spectroscopic effective temperature leads to a radius in the range R ∈ [5, 10] R (2σ-level). The spectroscopic logg is of modest precision and therefore hardly implies a useful restriction on the mass. We obtain M ∈ [6, 93] M at 2σ-level.
5. Time-series spectroscopy
In general, white-light space photometry alone may be insu ffi-cient for asteroseismic modelling based on low-order heat-driven oscillation modes, because these do not necessarily reveal pat-terns that lead to the identification of the mode wavenumbers (l, m). For this reason, the CoRoT mission was accompanied by carefully planned time-series spectroscopy campaigns. We have collected a total of 208 spectra of HD 170580, of which 60 were obtained during 27.3 d in June and July 2009 using the High Ac-curacy Radial velocity Planet Searcher (HARPS) spectrograph at the ESO La Silla 3.6-m telescope in Chile. This fibre-fed échelle spectrograph covers a wavelength range of 378 − 691 nm and has a resolving power of R = 115000 (Mayor et al. 2003). The achieved S/N ratio ranges from 70 to 200. The remaining 148 spectra were assembled with the 1.2-m Mercator Telescope on La Palma, Spain, using the High Efficiency and Resolution Mer-cator Échelle Spectrograph (HERMES) in high-resolution mode (R = 85000) (Raskin et al. 2011). HERMES covers the wave-length range 377 − 900 nm. One spectrum was obtained in June 2009 and all others during 63.9 d in May-July 2010, i.e., approx-imately one year after the HARPS spectra. The total time base of the merged HARPS and HERMES spectroscopy is 394 d, giving a Rayleigh limit of 0.0025 d−1. All spectra were wavelength cal-ibrated using Th-Ar spectra obtained at the beginning and/or end of the night of observation, using the HERMES and HARPS re-duction pipelines. The spectra were normalised using the method by Pápics et al. (2012).
5.1. Frequency analysis
Scargle periodograms with the aim of extracting pulsation sig-nals and performing mode identification were computed using both the moment method (e.g. Balona 1986; Aerts et al. 1992; Briquet & Aerts 2003) and Pixel-by-Pixel method (e.g. Telting & Schrijvers 1997; Zima 2008) applied to individual spectral lines: the Si iii 4560Å triplet, the Si ii 4130Å doublet and the He i 6678Å line. These lines have previously been shown to be op-timal for frequency extraction and mode identification of β Cep stars (Aerts & De Cat 2003), SPBs (Aerts et al. 1999) and B-type fast rotating stars (e.g. Balona et al. 1999), respectively. In prac-tice, we carried out the analyses of the spectral line variations using the software package famias developed by Zima (2008).
Considering each of the above mentioned three spectral lines separately, the first step of the analysis included extracting the spectral line from the normalised spectra including a small part of the continuum on either side of the lines for S/N estimate. The wavelengths were converted to velocities using the rest wave-length of the spectral line as the zero-point. After this conver-sion, we calculated the moments of the lines and their Fourier spectra. In this way, we did not find any significant variability. This is not so surprising, given that line-profile variability was
0.0 0.2 0.4 0.6 0.8 1.0 Amplitude Spectral Window LSD HARPS + HERMES 0.0005 0.0015 0.0025 0.0035 Amplitude Pixel-by-Pixel 0 2 4 6 8 10 Frequency [c/d] 0.02 0.06 0.10 Amp. [km s − 1] 1st Moment
Fig. 5. Fourier spectra based on the Pixel-by-Pixel method (second panel) and the 1st moment (third panel) for the combined HARPS and HERMES LSD profiles. The top panel shows the spectral window. Ver-tical dashed lines indicate the positions of frequencies with S /N ≥ 4 during prewhitening.
also not detected for HD 50230 (Degroote et al. 2012), although the dominant modes of this star have amplitudes ten times higher than those of HD 170580.
A second attempt at extracting pulsation signals from the spectra was made by computing least-squares deconvolution (LSD) profiles following the method originally developed by Donati et al. (1997). Such LSD profiles are a great asset to detect low-amplitude variability, even if it cannot be found in individ-ual spectral lines. This was shown to be paticularly effective for g-modes in γ Dor stars (e.g., De Cat et al. 2006). We applied the more recent LSD formalism of Tkachenko et al. (2013) to the HARPS and HERMES spectra separately, including all spectral lines except the hydrogen and helium lines. The LSD profiles are obtained by cross-correlating the lines in the observed spec-tra with a set of delta functions constructed from an atomic line list, containing information on rest wavelengths and theoretical line strengths. The line list was computed using Teff= 20 000 K, log g= 4.1 and solar metallicity following the results by Morel & Aerts (2007). For the further analysis, we excluded one bad HARPS LSD profile and four bad HERMES LSD profiles. Vi-sual inspection of the residual HARPS and HERMES LSD pro-files reveales low-amplitude line-profile variability.
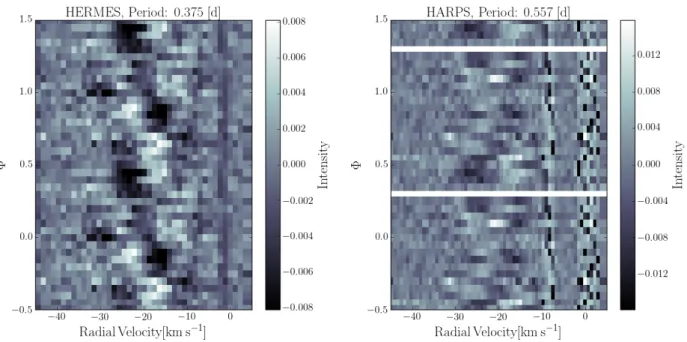
Using the LSD profiles of both the HARPS and HERMES spectra we recomputed Fourier spectra based on the velocity moments and Pixel-by-Pixel method as described above. The re-sults are displayed in Fig. 5 for the Pixel-by-Pixel method and the 1st moments along with the spectral window of the data. By prewhitening the data according to the highest amplitude peaks in the Fourier spectra, we detected five candidate frequencies from the Pixel-by-Pixel computed Fourier spectra and three can-didates for the 1st moments. However, most of these are con-nected with the time sampling and cannot be accepted as in-trinsic to the star, except for fS1 = 2.6700 d−1. A phase-folded grey-scale plot of the LSD profiles reveals variability with this frequency for the HERMES data (left panel of Fig. 6, binned in 0.05 phase intervals) but not for the HARPS data. This is
inter-preted in terms of complex multiperiodicity and mode beating that changes drastically over time scales of weeks, as revealed by the CoRoT light curve. Keeping in mind that the spectroscopy suffers heavily from daily aliasing, fS1 is equal to an alias of the CoRoT frequency f31.
As an additional test, we phase folded the residual LSD pro-files with each of the frequencies detected in the CoRoT pho-tometry, as well as with random frequencies. In that way, we found only one weak coherent periodic signal in the HARPS LSDs for f3from visual inspection (right panel of Fig. 6). Com-paring both panels of Fig. 6, we conclude that HD 170580 has low-degree prograde ( fS1) and retrograde ( f3) modes.
5.2. Mode identification
We attempted to identify the degree and azimuthal order of the two dominant frequencies. Irrespective of the identification, this led to v sini= 4 ± 2 km s−1, where the uncertainty is dominated by the various pulsational line-profile broadening levels depend-ing on the kind of mode that was assumed for fS1 or f3. Pulsa-tional line-profile broadening was so far ignored in the literature in deriving the rotational line broadening.
The HARPS data did not lead to any conclusive result on the identification for f3 due to the too low signal at the epoch of these spectra. The HERMES data, when fitted as if the star was a monoperiodic pulsator with a single mode fS1, led to a formal best line-profile fit for a prograde sectoral mode, either with l = +m = 3, v sini ' 6 km s−1, along with i ' 6◦, where the uncertainty for the inclination is ∼ 3◦. Given that we treated the star as monoperiodic, that the dominant modes in space pho-tometry usually have l < 3, and that this solution is close to an Inclination Angle of Complete Cancellation (IACC, Table B1 in Aerts et al. 2010), we consider this result unlikely. Indeed, it is a known artifact of spectroscopic mode identification to find l= 3 close to an IACC in the case of low signal in the line-profile variability (Chadid et al. 2001, for a thorough discussion). Also, taking v sini= 4 ± 2 km s−1and i= 6◦± 3◦leads to an equatorial rotation velocity that is incompatible with the estimation of the rotation period from the detected multiplets in the CoRoT data. Moreover, as already mentioned, the detection of zonal (m= 0), tesseral (0 , m , l), and sectoral ((l = |m|)) modes in the space photometry as found from the multiplets indicated in Table 1 and shown in Fig. 3 rather suggests a view upon an intermediate in-clination angle. Finally, the occurrence of helium surface deple-tion can only be explained by atomic diffusion in action and this suggests slow rotation.
We conclude to have found marginal evidence of a low-degree prograde ( fS1) and retrograde ( f3) mode in the spectro-scopic line-profile variability of HD 170580 taken at two di ffer-ent epochs. As a consequence of the low pulsational velocity amplitude, unambiguous identification of the two mode degrees or azimuthal orders was not possible, despite the high quality of the data. This also implies that the inclination angle could not be estimated properly.
6. Comparison with stellar models
Just as for the case of the CoRoT SPB target HD 43317 (Buyss-chaert et al. 2018), we do not have a secured period spacing pat-tern of gravity modes at our disposal to guide the asteroseismic modelling of HD 170580. This prevented us from mode identi-fication via the method by Van Reeth et al. (2016), which was successfully applied to SPBs observed by Kepler with a ten
Fig. 6. Phase folded residual LSD profiles for the HERMES (left, for fS1= 2.6700 d−1) and HARPS (right, f3= 1.79567 d−1) spectra. The phase
folded residual profiles are averaged over an 0.05 phase interval and plotted over twice the phase interval for better visibility. The straight lines near -10 and 0 km,s−1are caused by telluric lines.
times better frequency resolution than the one of CoRoT long runs (Pápics et al. 2017). We do have a secure identification of the mode degree l from six rotationally-split multiplets.
In order to have an unrestricted range in mass for the search for stellar models that can explain HD 170580’s asteroseismic properties listed in Table 1, we use the combined Particle Filter and Deep Neural Network method (PF-DNN hereafter) devel-oped by Hendriks & Aerts (2019). This PF-DNN is trained on an extensive grid of 352 800 stellar models and their pulsation frequencies of radial (l = 0), and zonal (m = 0) dipole (l = 1) and quadrupole (l = 2) modes. The input physics of the models is fully described in Schmid & Aerts (2016), to which we refer for details.2 The PF-DNN allows fast screening of millions of zonal (m = 0) pulsation modes for non-rotating stellar models representing stars in the core hydrogen burning phase and cover-ing birth masses between 2 and 20 M . This PF-DNN screening has the aim to obtain rough estimates of the six input param-eters of the models: mass (M), initial hydrogen mass fraction (X), metallicity (Z), central hydrogen mass fraction (Xc, a proxy of the stellar age), and two parameters connected with mixing of the chemical elements beyond the Schwarzschild convective core boundary. These two mixing parameters represent 1) con-vective core overshooting assuming an exponentially decaying shape and overshoot distance fovusing the formulation by Frey-tag et al. (1996) and adopting the radiative temperature gradi-ent in the overshoot zone; 2) a constant level of diffusive mix-ing, Dmix, throughout the stellar envelope. The latter was found to be a necessary ingredient in order to explain the mode trap-ping detected in Kepler photometry of gravity-mode pulsators of spectral type B (Moravveji et al. 2015, 2016). The models do not include atomic diffusion, because it is impossible to compute the appropriate radiative levitation for such an extensive grid. As shown by Deal et al. (2016) and by Aerts et al. (2018), ignoring atomic diffusion for A-type and B-type stars can have major ef-2 The SpaceInn grid of stellar models and their asteroseismic
proper-ties, as well as a script to run the PF-DNN are publicly available from fys.kuleuven.be/ster/Software/grid-massive-stars
fects for the envelope mixing and hence for the pressure-mode frequencies, with deviations for the latter as large as 1 d−1. The PF-DNN is therefore not expected to lead to an optimal solution for HD 170580 if the measured frequencies listed in Table 1 in-volve pressure modes, but it might be suitable when involving only high-order gravity modes. In any case, application of the PF-DNN will point to the most appropriate stellar parameters within the limitations of the adopted input physics that went into the SpaceInn grid, which is state-of-the-art for seismic modelling of B-type pulsators following Moravveji et al. (2016).
The PF-DNN searches for the optimal combination of the six free parameters on the basis of the theoretically computed zonal pulsation frequencies of all the stellar models in the grid, by comparing them with the measured pulsation frequencies of the star by means of a χ2distance measure, in the situation where limited (or no) information on the mode identification of the frequencies is available. The performance of the PF-DNN was tested on several well-known pulsators of spectral type B that had been modelled previously and for which identification of the degree l, azimuthal order m, and radial order n of the measured frequencies was already known from previous studies. This al-lowed Hendriks & Aerts (2019) to assess the inference capacity of the PF-DNN in the case where information on the mode de-grees l was (partially) missing. It was found that the PF-DNN performs optimally when the mode degrees are known, while it becomes less performant as more of the degrees are missing, with no inference capacity when none or only one of them is known for a set of measured frequencies. The PF-DNN is only suitable for slow rotators, as is the case for HD 170580.
We first applied the PF-DNN in the version of Hendriks & Aerts (2019) to HD 170580, relying only on the information de-rived from the CoRoT data, i.e., with six zonal mode frequencies having an identification for the degree: f2, f19, f23, f24 and f26 with l= 1 and f1with l= 2. For these we thus search for an exact frequency match. The other five independent oscillation mode frequencies we used, without information on the mode degree, were f10, f14, f16, f27, and f32. These are assumed to correspond
Fig. 7. Upper 6 panels: PF-DNN application to HD 170580, based on 6 frequencies ( f1, f2, f19, f23, f24and f26) of identified modes and 5 ( f10,
f14, f16, f27, and f32) of unidentified modes. Lower 6 panels: similar, but where the PF-DNN was retrained such as to comply with the Gaia
DR2 parallax and the spectroscopic Teff, both at 2σ-level. The blue and grey points represent the results for two different settings for the genetic
algorithm and sampling of the PF-DNN, according to Hendriks & Aerts (2019).
with modes of l ≤ 2. From the measured rotational splittings of the six multiplets, we anticipate deviations from the zonal mode frequencies computed from the SpaceInn models to be zero for radial modes, in the range [0.0; 0.015 · (1 − Cnl)] d−1for sectoral (l = m) dipole modes and up to twice this interval for sectoral quadrupole modes.
The results of the PF-DNN application for the frequency matching based on the 11 frequencies (indicated as red dashed lines in Fig. 2) are shown in the upper six panels of Fig. 7. The blue points are the results for the basic setting of the genetic algorithm and sampling of the PF-DNN, while the grey points represent a more dense setting that samples more points per it-eration (see Hendriks & Aerts (2019) for details). It can be seen from the global trends in Fig. 7 that the metallicity, initial hydro-gen fraction, and level of particle mixing in the stellar envelope are hardly constrained, but the mass, core overshooting, and evo-lutionary stage can be estimated. This is a similar result than for two previous asteroseismic modelling applications to CoRoT B pulsators (Degroote et al. 2010; Buysschaert et al. 2018). The
best solution found by the PF-DNN with densest (grey dots) sampling is listed in the left column of Table 2 and involves low-order modes with n ∈ [−9,+2], leading to an r.m.s. of 0.010 d−1. By construction, the best PF-DNN results come from an in-terpolation of the modes belonging to the “true” stellar models in the SpaceInn grid. The evolution of the zonal-mode frequencies of the models closest in mass to this solution in the SpaceInn grid is shown in the upper left panel of Fig. 8 for the second half of the main sequence. The mode identification in Table 2 and estimated Xccorrespond with (1 − Cnl) ∈ [0.51; 0.60] for the l = 1 modes and (1 − Cnl) ∈ [0.86; 0.97] for the l= 2 modes. This implies a frequency shift for the l= 2, n = 0 and l = 2, n = −1 modes of ' 0.024 d−1based on the measured splitting of the l= 2, n = −2 mode in the case of rigid rotation. The symbols sizes of all the modes in Fig. 8 have been chosen to cover such a typical fre-quency shift. The found r.m.s. of 0.010 d−1for the difference be-tween the 11 measured and model frequencies points to an over-all good frequency match given the unknown azimuthal order for
Table 2. Best PF-DNN fit point for the densest sampling represented by the grey dots in Fig. 7 for HD 170580, in the case of modelling based on just the CoRoT data (left column) and from the CoRoT data in addition to luminosity constraints from Gaia DR2 and the spectroscopic Teff,
taking 2σ intervals for those two quantities (right column).
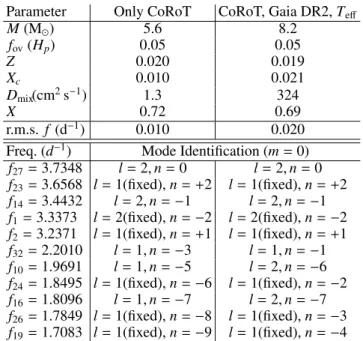
Parameter Only CoRoT CoRoT, Gaia DR2, Teff
M(M ) 5.6 8.2 fov(Hp) 0.05 0.05 Z 0.020 0.019 Xc 0.010 0.021 Dmix(cm2s−1) 1.3 324 X 0.72 0.69 r.m.s. f (d−1) 0.010 0.020
Freq. (d−1) Mode Identification (m= 0) f27= 3.7348 l= 2, n = 0 l= 2, n = 0 f23= 3.6568 l = 1(fixed), n = +2 l = 1(fixed), n = +2 f14= 3.4432 l= 2, n = −1 l= 2, n = −1 f1= 3.3373 l = 2(fixed), n = −2 l = 2(fixed), n = −2 f2= 3.2371 l = 1(fixed), n = +1 l = 1(fixed), n = +1 f32= 2.2010 l= 1, n = −3 l= 1, n = −1 f10= 1.9691 l= 1, n = −5 l= 2, n = −6 f24= 1.8495 l = 1(fixed), n = −6 l = 1(fixed), n = −2 f16= 1.8096 l= 1, n = −7 l= 2, n = −7 f26= 1.7849 l = 1(fixed), n = −8 l = 1(fixed), n = −3 f19= 1.7083 l = 1(fixed), n = −9 l = 1(fixed), n = −4 five of the 11 modes and their anticipated frequency shifts due to Ledoux splitting.
Close inspection of the upper left panel of Fig. 8 shows that the fit is only good for the l = 1, n < −2 modes and only for models at a very advanced stage of evolution where the mode density is large and mode bumping occurs (e.g., Shiba-hashi & Osaki 1976; Aizenman et al. 1977). Moreover, modes of evolved models with high density contrast close to the TAMS may also be subject to the phenomenon of avoided crossings (e.g., Gabriel 1980; Christensen-Dalsgaard 1981, for adiabatic and non-adiabatic computations, respectively). Both these phe-nomena are visible in the top right corners of the panels in Fig. 8, where the smooth evolution of the modes deteriorates for Xc < 0.1. We refer to Smeyers & Van Hoolst (2010, Chap-ter 11) for a thorough mathematical description and concrete numerical examples of mode bumping and avoided crossings, but point out here that these may induce appreciable frequency shifts, much larger than the measured frequency uncertainties from the CoRoT data. Moreover, as already discussed above, de-viations for the pressure modes are anticipated from the lack of atomic diffusion in the models. Hence, both at the level of the equilibrium models (atomic diffusion) and and the level of the pulsation computations (mode bumping and avoided crossings), we face theoretical uncertainties with possible considerable fre-quency shifts in near-TAMS stars. This typically occurs for the pressure, gravity, and fundamental non-radial modes of low ra-dial orders, as we are dealing with here.
Confrontation of the result of this “CoRoT-only” modelling in the left column of Table 2 and the upper left panel of Fig. 8 leads to a stellar model that has log(L/L ) ' 3.55 and Teff ' 11 700 K, which are not compliant with the Gaia DR2 lumi-nosity we derived nor with the spectroscopic Teff. Moreover, HD 170580 has a low surface metallicity of Z= 0.0095±0.0030. In order to assess the effect of the metallicity, we show in the bottom left panel of Fig. 8 the modes for a model with the same parameters than the upper panel except that Z = 0.012, which is
the lowest metallicity in the SpaceInn grid. This gives a worse fit, because the mode frequencies get shifted to higher values and there are no l = 2, n ≥ 0 modes available in the measured frequency range.
A decrease in Z is degenerate with an increase in mass when fitting gravity modes (Moravveji et al. 2015, Fig. 5). Since a higher luminosity is also needed to meet the Gaia DR2 luminos-ity, we performed “constrained” modelling, demanding compli-ance with both the Gaia DR2 luminosity and the spectroscopic Teff, taking 2σ level for both. We thus retrained the PF-DNN on the basis of stellar models in the SpaceInn grid that are situated within the box in Fig. 4. This does not imply that the PF-DNN will deliver a best solution within that error box, but rather that it is trained only on the basis of models within that box. It might extrapolate outside the box in Fig. 4 to find the best solutions. Application of this version of the PF-DNN results in the patterns shown in the lower 6 panels in Fig. 7 and the best solution listed in the right column of Table 2. It is seen from Fig. 7 that the re-striction imposed by the Gaia astrometry and the spectroscopy in the training of the PF-DNN does not change the overall mor-phology in the χ2 space in terms of evolutionary stage or level of core overshooting. The best estimate for the stellar mass now occurs at M = 8.2 M for a model with log(L/L ) ' 4.0. This model identifies the radial orders from n= −7 to +2 and has an r.m.s. for the frequencies of 0.020 d−1, i.e., twice as large as for the unconstrained “CoRoT-only” modelling but still fine given the expected Ledoux shifts for the five frequencies with uniden-tified degree. Also here the pressure modes are the ones that are not well reproduced (upper right panel of Fig. 8). Moreover, this model has a too high luminosity and a too low Teff. In compar-ison, we show in the bottom right panel of Fig. 8 a model for the same parameters, except that the core overshooting is only fov = 0.01 instead of 0.05. This model does occur at the edge of the 2σ Gaia DR2 error box in Fig. 4 but it lacks pressure modes in the measured frequency regime.
Because some of the lower-amplitude multiplets have com-ponents that cannot be distinguished from combination frequen-cies, we finally applied the PF-DNN for the case of only hav-ing a fixed mode degree for the quintuplet and the two dom-inant triplets (with zonal frequencies f1, f2, and f19). This led to a near-TAMS model with M = 9.8 M , fov = 0.045 for “CoRoT-only” modelling. That model has an r.m.s. of 0.009 d−1 but log(L/L ) ' 4.31, which is not compliant with the Gaia lu-minosity. It also has a far too low Teff. The constrained modelling version in this case led to a model with M= 8.6 M and similar parameters than those in the right column of Table 2, for an r.m.s. of 0.017 d−1and a similar deficit of appropriate pressure-mode frequencies. From this we conclude there to be similar results if we feed the PF-DNN with only three instead of six identified zonal modes.
We conclude from combined CoRoT, Gaia DR2 and spec-troscopic data that HD 170580 is a star of M ' 8 M close to the TAMS, but that stellar models without atomic di ffu-sion cannot explain its detected pressure-mode frequencies to within the measurement errors. The Ledoux coefficients for the three dipole gravity modes with the lowest frequency and highest radial order in the model closest to the param-eters listed in the right column of Table 2 ( f24, f26, f19) give (1 − Cn1) = 0.6212, 0.8202, 0.5424 for n = −2, −3, −4, respec-tively. The measured splittings for these three modes then lead to a rotation frequency of 0.0208±0.0017, 0.0140±0.0020, and 0.0250±0.0016 d−1. This is a tentative indication that the star might have mild differential rotation in its interior. However, given that we are in an asteroseismic regime of low-order modes
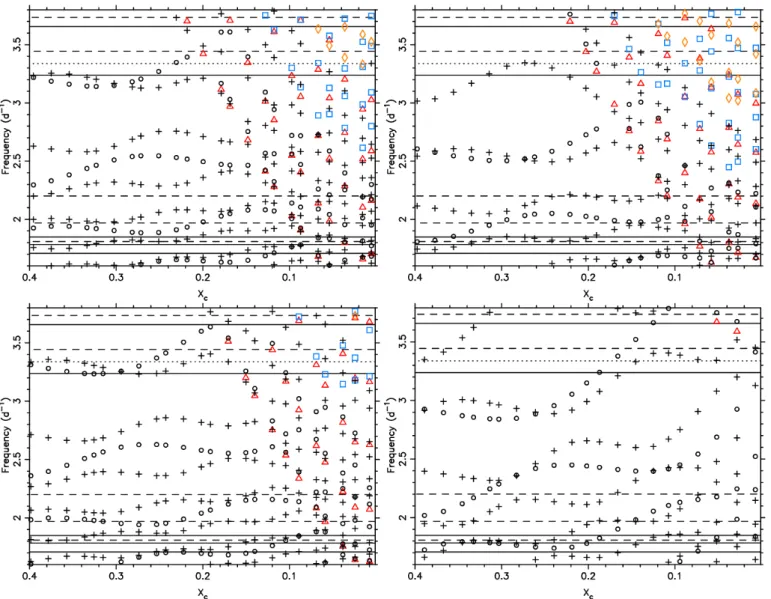
Fig. 8. Evolution of the zonal mode frequencies of stellar models with input parameters M = 6 M , X = 0.72, Z = 0.020, fov = 0.05, and
Dmix= 1 cm2s−1(upper left), M= 8 M , X= 0.70, Z = 0.020, fov= 0.05, and Dmix= 100 cm2s−1(upper right), M= 6 M , X= 0.72, Z = 0.012,
fov= 0.05, and Dmix = 1 cm2s−1(bottom left), M= 8 M , X= 0.70, Z = 0.020, fov= 0.01, and Dmix = 100 cm2s−1(bottom right). The panels
show the zonal mode frequencies in the region of the measured frequencies of HD 170580, which are indicated as horizontal lines (dotted: l= 2, full: l= 1, dashed: unknown l). The model frequencies are code as black circles: l = 1, n < 0, black plus signs: l = 2, n < 0, red triangles: l = 0, blue squares: l= 1, n ≥ 0, orange diamonds: l = 2, n ≥ 0.
where the Ledoux splitting is model-dependent and we rely on models incompatible with the Gaia luminosity in terms of their pressure modes, we consider this a preliminary result at best. Stellar models with atomic diffusion that are compatible with all the data (CoRoT, Gaia, spectroscopy) need to be constructed to evaluate this suggestive result further.
7. Discussion and future improvements
We detected 42 oscillation mode frequencies in the CoRoT light curve of HD 170580 and selected 11 independent mode frequen-cies for forward asteroseismic modelling. Among those 11, five zonal dipole modes and one quadrupole mode occur. The other 5 frequencies were fitted while allowing l= 0, 1, 2 for their degree. Despite huge efforts to gather extensive time-series spectroscopy with some the best spectrographs in the world, that data did not add observational constraints to the modelling compared to ear-lier snapshot spectroscopy as only a better estimate of v sin i and its error was achieved. Intensive time-series spectroscopy for as-teroseismology should better be focused on pulsating
spectro-scopic binaries for tidal asteroseismology, where there is a lack of high-precision data at a level suitable to improve their stellar interior models. For single stars, spectroscopic monitoring is bet-ter done afbet-ter the analysis of the space photometry and only for stars with mmag-type dominant modes that lack an identification of their (l, m).
The asteroseismic modelling of HD 170580 was done from a Particle Filter combined with a Deep Neural Network trained on the basis of a large grid of stellar models covering the mass range [2, 20] M , as well as a retrained version limited to the luminos-ity and effective temperature range from Gaia and spectroscopy, respectively. We found good agreement with the CoRoT data to within the frequency precision of the detected low-order grav-ity modes for a near-TAMS star of M ' 8 M with a large core overshooting. However, the models with these parameters are not compliant with the low-order pressure modes and only marginally so with the Gaia data. The latter did not treat the poorly known multiplicity of HD 170580 yet. The asteroseismic models lack atomic diffusion for computational reasons, but the spectroscopy of HD 170580 reveals that it is active in the star.
Moreover, we limited to adiabatic pulsation computations. This lack of atomic diffusion and/or imperfect treatment of the phe-nomena of mode bumping and avoided crossings could be rea-sons why the combined asteroseismic, astrometric, and spectro-scopic modelling of HD 170580 cannot explain the CoRoT fre-quencies of the low-order pressure modes to within their mea-sured precision.
HD 170580 revealed itself as an interesting asteroseismic tar-get, given that it is close to the TAMS. This holds the potential to achieve a high-precision asteroseismic measurement of the amount of helium in its core, just prior to the start of its blue supergiant phase. Moreover, we found a hint of a low level of differential rotation from its low-order gravity modes. However, before we can deduce firm asteroseismic conclusions on these two aspects, improvement in the modelling is required. This may come from three fronts: better oscillation mode frequency precision if TESS would observe the star, good predictions of low-order non-radial oscillation modes from stellar models with atomic diffusion including radiative levitation, and a Gaia DR3 parallax taking proper account of the multiplicity of the star. Acknowledgements. This project has received funding from the European Re-search Council (ERC) under the European Union’s Horizon 2020 reRe-search and innovation programme (grant agreement N◦670519: MAMSIE) and was sup-ported by the National Science Foundation of the United States under Grant N◦NSF PHY–1748958. The computation of the stellar model grid used was funded by the European Community’s Seventh Framework Programme FP7-SPACE-2011-1, project number 312844 (SPACEINN). A.T. is supported as a Research Associate at the Belgian Scientific Research Fund (F.R.S-FNRS). C.A. thanks Dr. Eric Michel for the memorable efforts in trying to get the best stars selected as primary targets in CoRoT’s asteroseismology CCDs. We are grateful to all observers from the Institute of Astronomy of KU Leuven who contributed to the gathering of the HERMES spectroscopy at the Mercator telescope and to the MESA/GYRE developers for their continuous efforts and open access policy for their codes.
References
Aerts, C., Christensen-Dalsgaard, J., & Kurtz, D. W. 2010, Asteroseismology, Astronomy and Astrophysics Library, Springer-Verlag, Heidelberg Aerts, C. & De Cat, P. 2003, Space Sci. Rev., 105, 453
Aerts, C., De Cat, P., Peeters, E., et al. 1999, A&A, 343, 872 Aerts, C., de Pauw, M., & Waelkens, C. 1992, A&A, 266, 294
Aerts, C., Mathis, S., & Rogers, T. 2019, ARA&A, in press [arXiv:1809.07779]
Aerts, C., Molenberghs, G., Kenward, M. G., & Neiner, C. 2014, ApJ, 781, 88 Aerts, C., Molenberghs, G., Michielsen, M., et al. 2018, ApJS, 237, 15 Aizenman, M., Smeyers, P., & Weigert, A. 1977, A&A, 58, 41 Auvergne, M., Bodin, P., Boisnard, L., et al. 2009, A&A, 506, 411
Bailer-Jones, C. A. L., Rybizki, J., Fouesneau, M., Mantelet, G., & Andrae, R. 2018, AJ, 156, 58
Balona, L. A. 1986, MNRAS, 219, 111
Balona, L. A., Aerts, C., & Štefl, S. 1999, MNRAS, 305, 519 Baran, A. S., Koen, C., & Pokrzywka, B. 2015, MNRAS, 448, L16 Bragança, G. A., Daflon, S., Cunha, K., et al. 2012, AJ, 144, 130 Breger, M., Stich, J., Garrido, R., et al. 1993, A&A, 271, 482 Briquet, M. & Aerts, C. 2003, A&A, 398, 687
Briquet, M., Neiner, C., Leroy, B., Pápics, P. I., & MiMeS Collaboration. 2013, A&A, 557, L16
Brott, I., Evans, C. J., Hunter, I., et al. 2011, A&A, 530, A116
Buysschaert, B., Aerts, C., Bowman, D. M., et al. 2018, A&A, 616, A148 Buysschaert, B., Neiner, C., Briquet, M., & Aerts, C. 2017, A&A, 605, A104 Castelli, F. & Kurucz, R. L. 2004, arXiv:astro-ph/0405087
Chadid, M., De Ridder, J., Aerts, C., & Mathias, P. 2001, A&A, 375, 113 Christensen-Dalsgaard, J. 1981, MNRAS, 194, 229
De Cat, P., Eyer, L., Cuypers, J., et al. 2006, A&A, 449, 281 Deal, M., Richard, O., & Vauclair, S. 2016, A&A, 589, A140 Degroote, P., Aerts, C., Baglin, A., et al. 2010, Nature, 464, 259 Degroote, P., Aerts, C., Michel, E., et al. 2012, A&A, 542, A88 Degroote, P., Briquet, M., Catala, C., et al. 2009, A&A, 506, 111
Donati, J.-F., Semel, M., Carter, B. D., Rees, D. E., & Collier Cameron, A. 1997, MNRAS, 291, 658
Dufton, P. L., Thompson, A., Crowther, P. A., et al. 2018, A&A, 615, A101
Fitzpatrick, E. L. 1999, PASP, 111, 63
Freytag, B., Ludwig, H.-G., & Steffen, M. 1996, A&A, 313, 497 Gabriel, M. 1980, A&A, 82, 8
Gaia Collaboration, Brown, A. G. A., Vallenari, A., et al. 2018, A&A, 616, A1 Gilliland, R. L., Brown, T. M., Christensen-Dalsgaard, J., et al. 2010, PASP, 122,
131
Green, G. M., Schlafly, E. F., Finkbeiner, D., et al. 2018, MNRAS, 478, 651 Hendriks, L. & Aerts, C. 2019, PASP, in press [arXiv:1811.03639] Johnston, C., Tkachenko, A., Aerts, C., et al. 2019, MNRAS, 482, 1231 Kallinger, T., Weiss, W. W., Beck, P. G., et al. 2017, A&A, 603, A13
Kurtz, D. W., Shibahashi, H., Murphy, S. J., Bedding, T. R., & Bowman, D. M. 2015, MNRAS, 450, 3015
Ledoux, P. 1951, ApJ, 114, 373
Lefever, K., Puls, J., Morel, T., et al. 2010, A&A, 515, A74 Loumos, G. L. & Deeming, T. J. 1978, Ap&SS, 56, 285
Luri, X., Brown, A. G. A., Sarro, L. M., et al. 2018, A&A, 616, A9 Mayor, M., Pepe, F., Queloz, D., et al. 2003, The Messenger, 114, 20 McCall, M. L. 2004, AJ, 128, 2144
Michaud, G., Alecian, G., & Richer, J. 2015, Atomic Diffusion in Stars, Astron-omy and Astrophysics Library, Springer International Publishing Switzerland Moravveji, E., Aerts, C., Pápics, P. I., Triana, S. A., & Vandoren, B. 2015, A&A,
580, A27
Moravveji, E., Townsend, R. H. D., Aerts, C., & Mathis, S. 2016, ApJ, 823, 130 Morel, T. & Aerts, C. 2007, Communications in Asteroseismology, 150, 201 Pápics, P. I. 2012, Astronomische Nachrichten, 333, 1053
Pápics, P. I., Briquet, M., Baglin, A., et al. 2012, A&A, 542, A55 Pápics, P. I., Moravveji, E., Aerts, C., et al. 2014, A&A, 570, A8 Pápics, P. I., Tkachenko, A., Aerts, C., et al. 2015, ApJ, 803, L25 Pápics, P. I., Tkachenko, A., Van Reeth, T., et al. 2017, A&A, 598, A74 Poretti, E., Paparó, M., Deleuil, M., et al. 2010, A&A, 520, A108
Poretti, E., Rainer, M., Mantegazza, L., et al. 2013, in Astrophysics and Space Science Proceedings, Vol. 31, Stellar Pulsations: Impact of New Instrumen-tation and New Insights, ed. J. C. Suárez, R. Garrido, L. A. Balona, & J. Christensen-Dalsgaard, 39
Poretti, E., Rainer, M., Weiss, W. W., et al. 2011, A&A, 528, A147 Rainer, M., Poretti, E., Mistò, A., et al. 2016, AJ, 152, 207
Raskin, G., van Winckel, H., Hensberge, H., et al. 2011, A&A, 526, A69 Rogers, T. M. 2015, ApJ, 815, L30
Rogers, T. M. & McElwaine, J. N. 2017, ApJ, 848, L1 Scargle, J. D. 1982, ApJ, 263, 835
Schmid, V. S. & Aerts, C. 2016, A&A, 592, A116
Schwarzenberg-Czerny, A. 2003, in Astronomical Society of the Pacific Confer-ence Series, Vol. 292, Interplay of Periodic, Cyclic and Stochastic Variability in Selected Areas of the H-R Diagram, ed. C. Sterken, 383
Shibahashi, H. & Osaki, Y. 1976, PASJ, 28, 199
Smeyers, P. & Van Hoolst, T. 2010, Astrophysics and Space Science Library, Vol. 371, Linear Isentropic Oscillations of Stars: Theoretical Foundations Szewczuk, W. & Daszy´nska-Daszkiewicz, J. 2017, MNRAS, 469, 13 Szewczuk, W. & Daszy´nska-Daszkiewicz, J. 2018, MNRAS, 478, 2243 Telting, J. H. & Schrijvers, C. 1997, A&A, 317, 723
Tkachenko, A., Van Reeth, T., Tsymbal, V., et al. 2013, A&A, 560, A37 Torres, G., Andersen, J., & Giménez, A. 2010, A&A Rev., 18, 67 Triana, S. A., Moravveji, E., Pápics, P. I., et al. 2015, ApJ, 810, 16 Van Reeth, T., Tkachenko, A., & Aerts, C. 2016, A&A, 593, A120 Zahn, J.-P. 1991, A&A, 252, 179