- 1 -
Possibility of collapse for concrete columns
during and after the cooling phase of a fire
Mohamed Salah Dimia
1, Mohamed Guenfoud
2, Thomas Gernay3*& Jean-Marc
Franssen
41
Department of civil Engineering, University of Batna (05000), Algeria
2
Department of civil Engineering, University of Guelma, Algeria
3
Research Fellow F.R.S.-FNRS, Department of Structural Engineering, University of Liege, Chemin des Chevreuils 1, 4000 Liege, Belgium
*
Author to whom correspondence should be addressed. E-mail [email protected], tel. +32 4 3669245, fax +32 4 3669534
4
Department of Structural Engineering, University of Liege, Belgium
ABSTRACT: This paper presents a study performed on the collapse of reinforced concrete
columns subjected to natural fire conditions during and after the cooling phase of the fire. The aim is, first, to highlight the phenomenon of collapse of concrete columns during and after the cooling phase of a fire and then, to analyze the influence of some determinant parameters. The main mechanisms that lead to this type of failure are found to be the delayed increase of the temperature in the central zones of the element and the additional loss of concrete strength during the cooling phase of the fire. A parametric study is performed considering different fires and geometric properties of the column. This shows that the most critical situations with respect to delayed failure arise for short fires and for columns with low slenderness or massive sections.
KEY WORDS: fire, reinforced concrete, column, cooling, residual strength.
INTRODUCTION
In the prescriptive approach based on the standard ISO fire, the fire resistance of a structural element has to be ensured during the period of time that is required by law and no verification has to be made about the performance of the element thereafter. Because the temperature of the ISO fire is continuously increasing, the temperatures in the element are also continuously increasing and the load bearing capacity of the structure is continuously decreasing. As a consequence, verification at the required fire duration guarantees stability at any previous instant in the fire.
- 2 -
If the behaviour of a structure or structural element is assessed in a performance based environment, a more realistic representation of the fire will be used that comprises not only a heating phase but also a cooling phase during which the temperature of the fire is decreasing back to ambient temperature. The influence of such realistic fire scenarios in the evaluation of the fire resistance is a key issue in the performance-based approach, as presented for example by Fike et al. for concrete-filled hollow structural section columns [1]. The required duration of stability may be longer than the duration of the heating phase; it may even be required that the structure survives the total duration of the fire until complete burnout. In that case, the load bearing capacity of the structure continues decreasing after the moment of maximum gas temperature, will reach a minimum value and eventually may recover partially or completely when the temperatures in the structure are back to ambient.
The continuation of degradation of the load bearing capacity after the moment of maximum gas temperature is due to two main reasons.
Firstly, the temperatures in the structure may continue increasing while the gas temperature is decreasing. For an unprotected steel structure, this will be the case until the gas temperature has become lower than the steel temperature. For a thermally protected steel structure, the increase of steel temperature will continue for a longer time due to the inertia of the insulation. For a concrete structure, the zones of the members that are near the surface will exhibit a decrease soon after the gas temperature has become lower than the surface temperature but, as will be shown in the next section, the central zones may have their temperature still increasing for a significant duration, all the more if the section is massive.
The second reason is to be found in the material behaviour. While steel recovers strength and stiffness as soon as its temperature decreases, completely or partially depending on the type of steel and the maximum reached temperature [2], concrete remains severely damaged after cooling. Not only doesn't concrete recover its strength, but some indications exist that tend to prove that there is an additional loss of strength during cooling from maximum temperature to ambient [3].
For the designer, this implies that verification in the load domain at the time of maximum gas temperature does not guarantee against collapse at a later stage. Verification must necessarily be performed in the time domain by a step-by-step iterative method. Some authors have been interested in the residual load bearing capacity of structural elements after exposure to fire, for example Hsu et al. [4, 5] for reinforced concrete beams. However, no study has been performed, to the authors’ knowledge, on the risk of collapse during the cooling phase of a fire. The evolution of material properties in the cooling phase must be available to perform such analysis.
For the fire fighters, the possibility of collapse occurring after the time of maximum gas temperature, if confirmed, might be a real threat. In fact, the fire temperatures can increase only if there is no fire fighting operation and collapse during this phase is only an issue if it leads to progressive collapse outside the fire compartment. On the contrary, the intervention of fire fighting forces will usually lead to a decrease of the fire temperatures and, if collapse occurs
- 3 -
during this phase, it may be at a time when fire brigades are in or at near vicinity of the fire compartment and they may be endangered by the collapse. Collapse during the cooling phase of a fire occurred, for example, in a full scale fire test conducted in 2008 by Wald [6] in the Czech Republic. The composite steel concrete floor working in tensile membrane action collapsed briefly after the wood based natural fire entered in the cooling phase and one of the possible failure modes that are suspected is by failure of the concrete compression ring that was established in the slab.
A structural failure that would occur at a later stage, when the temperatures in the compartment are back to ambient, may be an even higher threat because it would occur at the time of first inspection, not only by the fire brigades but also possibly by other people. Such a tragic incident occurred in Switzerland in 2004 when seven members of a fire brigade were killed by the sudden collapse of the concrete structure in an underground car park in which they were present after having successfully fought the fire [7].
The two reasons that explain why the load bearing capacity may continue decreasing after peak gas temperature indicate that concrete structures are more prone to this phenomenon than steel structures. The work presented in this paper aimed at analysing reinforced concrete columns subjected to natural fires in order to verifying whether the possibility of structural collapse in or after the cooling phase is real and, if so, what are the parameters and conditions that are more likely to lead to this undesirable behaviour.
- 4 -
DESCRIPTION OF THE RESEARCH WORK
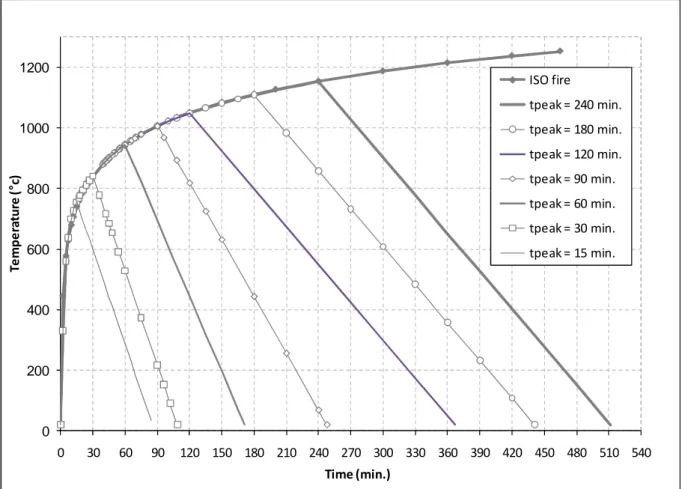
The time-temperature fire curves were taken from the parametric fire model of Annex A in Eurocode 1 [8]. The factor Γ that appears in Eq. (A.2a) of this document was given the value of 1.0, which makes the heating phase of the time-temperature curve of this natural fire model approximate the standard curve. Figure 1 shows the different fire curves that were used, differing from each other by the duration of the heating phase, from 15 to 240 minutes.
Figure 1: Different fire curves considered
In the discussion of the results, the following terms will be used:
Phase 1 is the heating phase of the fire, when the gas temperature is increasing from 20°C to the maximum temperature. The duration of phase 1 is tpeak;
Phase 2 is the cooling phase of the fire, when the gas temperature is decreasing from the maximum temperature to 20°C. The end of the phase 2 takes place at a time that is noted t20;
Phase 3 is the phase after the fire, when the gas temperature is back to 20°C.
The analyses were performed on reinforced columns exposed to the fire on three sides, with the fourth side having adiabatic conditions. This may be representative of a column along the side wall of a building, with the fourth side protected from the effects of the fire by the façade. The non linear finite element software SAFIR developed at the University of Liege [9]
0 200 400 600 800 1000 1200 0 30 60 90 120 150 180 210 240 270 300 330 360 390 420 450 480 510 540 T e m p e ra tu re ( ° c) Time (min.) ISO fire tpeak = 240 min. tpeak = 180 min. tpeak = 120 min. tpeak = 90 min. tpeak = 60 min. tpeak = 30 min. tpeak = 15 min.
- 5 -
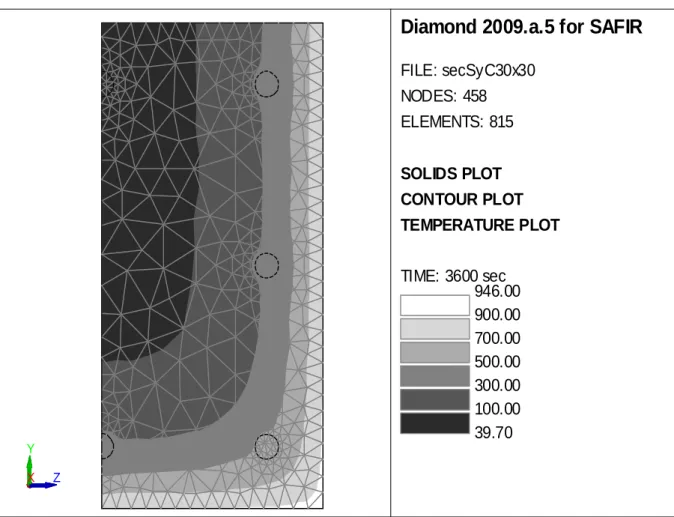
for the simulation of structures subjected to fire was used. The temperature distribution in the sections was determined by 2D non linear transient analyses, see Figure 2. For the structural analysis, the columns were discretized longitudinally by means of Bernoulli beam type elements and the cross sections of the beam elements are divided in fibres that match the 2-D elements of the thermal analysis.
Columns were chosen because the loss of concrete strength and stiffness is more detrimental in column like elements than in beam like elements for which the behaviour is more driven by the properties of the steel reinforcement.
The parameters that were considered in this study are: 1. The duration of the heating phase of the fire.
2. The effective length of the column. 3. The section of the column.
4. The duration of the cooling phase.
Many other parameters might influence the possibility of a delayed collapse such as, for instance, the mechanical properties of the materials that make the column. In this study, only the parameters that can be evaluated, even if in a qualitative manner, by the fire fighters when they arrive on site have been considered.
- 6 -
Figure 2. isotherms after 60 minutes in a section heated on 3 sides (1/2 modeled)
The section analysed as the basic case has a 300 x 300 mm side section with 8 bars of 16 mm diameter and a concrete cover of 30 mm. The column is simply supported at both ends with a length of 4 m. A sinusoidal imperfection with maximum amplitude of L/300 has been introduced in the direction of the thermal gradient (leading to bending along one single axis). The results reported in this paper are for the eccentricity toward the unexposed side of the section.
Simply supported concrete columns are commonly found in one floor industrial or commercial buildings. In moment resistant frames found in multiple floors residential or office buildings, the columns are subjected to bending moments, typically with a bi-triangular distribution, while at the same time supported by a certain degree of rotational restrain. Such a situation cannot be evaluated by analysing single columns because it is not possible to impose, for the degree of freedom linked to rotation at the ends of the element, at the same time the degree of rotational restrain and the amplitude of bending moment. Only one condition can be applied to any degree of freedom. The question of whether delayed failures are possible in moment resisting frames can only be addressed by the analysis of complete frames, which is beyond the scope of this study.
X
Y
Z
Diamond 2009.a.5 for SAFIR
FILE: secSyC30x30 NODES: 458 ELEMENTS: 815 SOLIDS PLOT CONTOUR PLOT TEMPERATURE PLOT TIME: 3600 sec 946.00 900.00 700.00 500.00 300.00 100.00 39.70- 7 -
DESCRIPTION OF THE MATERIAL MODELS
The reinforcing bars were represented in the model and the thermal properties of steel and concrete in the heating phase were taken from EN 1994-1-2 [10]. This means that thermal conductivity of concrete was taken with the upper limit in the sense of EN 1992-1-2 [11]. Siliceous concrete was chosen, with a density of 2400 kg/m³ and a water content of 46 kg/m³. The emissivity was taken as 0.7 and the coefficient of convection was 35 W/m²K.
Thermal properties of steel were considered as fully reversible during cooling.
When concrete is heated, large amount of water evaporate during heating. The moisture that is released in the fire environment dissipates in the open air, being entrained outside the compartment through the openings with the flow of combustion products. This water is thus not available and does not re-enter in the material during cooling and, furthermore, part of the water that is released during heated was chemically bounded and the physic-chemical reactions that liberate the molecules of water are not reversible. It has thus been considered in the model that the energy consumed for the evaporation is not recovered during cooling. The specific mass of concrete, which decreases during heating because of the release of water, has been considered as constant during cooling, with a value that corresponds to the one of the maximum temperature. When the temperature increases in the concrete, the thermal conductivity has a tendency to decrease [10]. According to [12], this loss in conductivity is also associated to the loss of moisture during heating. It has thus been considered that the decrease of thermal conductivity is not reversible and, during cooling, the thermal conductivity of concrete keeps the value corresponding to the maximum temperature.
The mechanical properties of the steel reinforcing bars have been considered as reversible, which means that stiffness and strength are recovered to full initial values during cooling. In the thermal elongation curve, the plateau corresponding to the phase change that occurs around 800°C at a level of 11 x 10-3 during heating occurs at slightly lower temperatures, around 700°C, at a level of 9 x 10⁻³ during cooling. When steel is back to ambient temperature, there is no residual thermal expansion. If yielding has occurred in the bars during the heating process, it is not recovered during heating; the plastic strain will not decrease during cooling.
For concrete, a residual thermal expansion or shrinkage has been considered when the concrete is back to ambient temperature. The value of the residual value is a function of the maximum temperature and is given in Table 1, taken from experimental tests made by Schneider in 1979 and mentioned in [12]. Negative values indicate residual shortening whereas positive values indicate residual expansion.
Table 1. Residual thermal expansion of concrete
Tmax [°C] εresidual (20°C) [10-3]
20 0
300 -0,58
400 -0,29
- 8 -
800 3,29
≥ 900 5,00
Compressive strength of concrete does not recover during cooling. According to EN 1994-1-2, an additional loss of 10% has been considered during cooling. This means that, for example, if the compressive strength has decreased from 1,00 to 0,50 at a given temperature, it will decrease to 0,45 when cooling back to ambient temperature. This assumption is of course the key for all the predictions presented in this paper and thus the reliability of the conclusions. In a recent paper, Yi-Hai & Franssen [13] have shown, from the analysis of hundreds of experimental results reported in the literature, that the additional reduction during cooling may be even higher than the 10% reduction considered in Eurocode 4. In the stress-strain relationship of concrete, the strain corresponding to the peak stress was considered during cooling as fixed to the value that prevailed at the maximum temperature [14]. This hypotheses is also present on Fig. C.2 of Eurocode 4 [10].
INFLUENCE OF THE DURATION OF THE HEATING PHASE
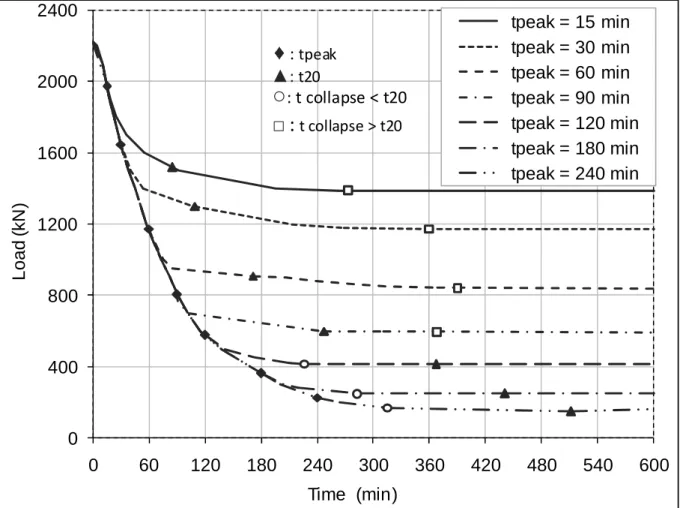
Figure 3 summarizes the analyses performed to examine the influence of the duration of the fire. Each curve on the Figure is related to one of the fires shown on Figure 1. Each curve is the result of numerous simulations performed with different load levels. From the load bearing capacity at time t = 0, here 2220 kN, the load has been progressively reduced and numerous simulations have been performed, each one for a different load, yielding a fire resistance time that increases as the load is decreased. In a real building, the columns are subjected to different loads the level of which is not known to the fire fighters. What each curve tells us is that, for the curve marked as “tpeak = 15 min.” for example, if a column is subjected to a load of 1600 kN, it will fail after 60 minutes. Each of these curves allows us detecting whether there is a potential dangerous range of the load that could lead to collapse during or after the heating phase. If this is the case, the fact that a delayed collapse will occur or not in a building will depend on the actual load level on the columns.
The load that gives a fire resistance time equal to the duration of the heating phase tpeak is
marked on the curve; for the fire with a heating phase of 15 minutes, this load is 1970 kN. If the load applied on the column is higher than 1970 kN, failure will occur during the heating phase of the fire. For loads lower than 1970 kN, failure of the column occurs in the cooling phase of the fire, at least when the load is higher than a value noted as t20 on the curve; for the 15 minutes
fire, this failure time of 86 minutes is obtained for a load of 1520 kN. For loads lower than 1520 kN, collapse occurs in the phase 3 of the fire, when gas temperature is back to ambient. For the same fire, collapse can occur as late as 270 minutes after the beginning of the fire, i.e. more than 3 hours after the end of the fire, for a load of 1390 kN. Any load lower than 1390 kN will not lead to the collapse of the column, which is marked by the fact that the curve has a horizontal asymptote.
- 9 -
For the fire that has a heating phase of 240 minutes, any load higher than 229 kN will lead to collapse during the heating phase, i.e. in less than 240 minutes. If the load happen to be comprised between 170 and 229 kN, collapse will occur during the cooling phase. If the load is lower than 170 kN, there will be no collapse of the column and infinite stability is ensured; there is no possibility of collapse after the cooling phase for this fire duration.
Figure 3. Influence of the duration of the heating phase (1)
It is thus possible, according to this model, to have in certain cases a structural collapse several hours after the end of the fire. According to Figure 3, this can occur only if the duration of the heating phase is not greater than 90 minutes. In fact, for longer fires, the horizontal asymptote starts for times shorter than t20 which means that, for these longer fires, if the load is
so low that failure did not occur during the cooling phase, failure will not occur after the cooling phase. It can also be observed that the critical load range, i.e. the range of loads leading to a failure in phase 3 of the fire, is wider for short fires and decreases as the duration of the fire increases.
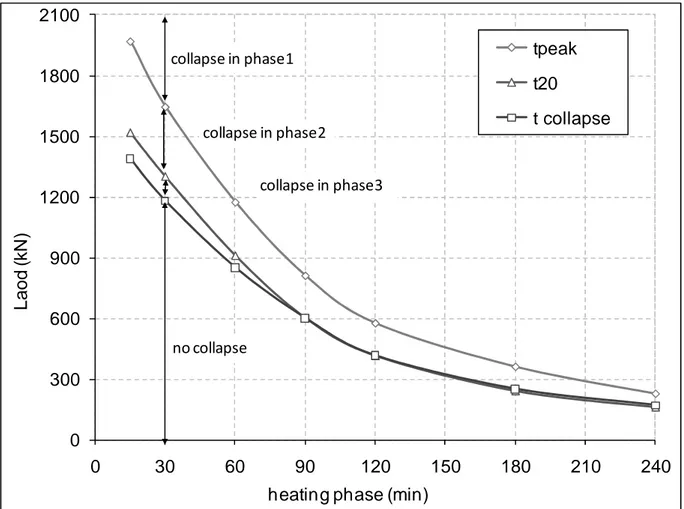
Figure 4 shows another presentation of the same results. On the horizontal axis is the duration of the heating phase of the fire whereas the applied load is on the vertical axis. Each
0 400 800 1200 1600 2000 2400 0 60 120 180 240 300 360 420 480 540 600 L o a d ( k N ) Time (min) tpeak = 15 min tpeak = 30 min tpeak = 60 min tpeak = 90 min tpeak = 120 min tpeak = 180 min tpeak = 240 min
○
: t collapse < t20 ▲:t20□
:
t collapse > t20♦
: tpeak- 10 -
curve of Figure 3 is on a vertical line in Figure 4 but, on Figure 4, only the characteristic points of the curves of Figure 3 have been marked. The plan is divided into 4 regions. Above the upper line is the region corresponding to failures in phase 1, the heating phase (for example, above 1970 kN for a fire duration of 15 minutes and above 229 kN for a fire duration of 240 minutes. Under this line is the region of failures during phase 2, the cooling phase. Below the lowest line is the region that does not lead to collapse at all and the intermediate region, existing only for fire durations shorter than 90 minutes, is the dangerous region of collapses that can occur in phase 3, when the compartment is back to ambient temperature conditions. The fact that the band corresponding to the dangerous situation is so narrow explains why the ratio of structural collapse of buildings after the fire to that of the total number of building collapses is low. This is the possible consequence of this event, rather than the probability of occurrence, that lead to a significant risk.
Figure 4. Influence of the duration of the heating phase (2)
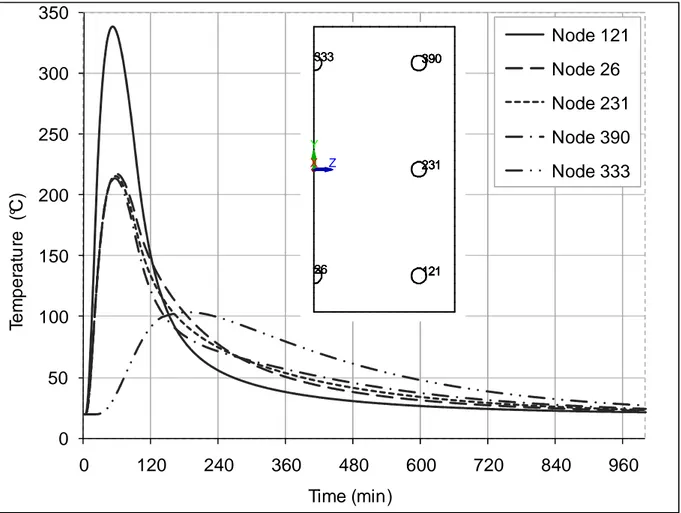
Figure 5 shows the evolution of the temperature in the steel bars for the fire with a heating phase of 15 minutes and return to 20°C after 86 minutes. Five curves only need to be plotted for the eight bars of the section because of the symmetry in the temperature distribution in the section, see Figure 2. Node 121 belongs to the bar in the heated corners; node 333 is for the bar in the center of the adiabatic boundary and the remaining three curves are for the other bars. It can be
0 300 600 900 1200 1500 1800 2100 0 30 60 90 120 150 180 210 240 L a o d ( k N )
heating phase (min)
tpeak t20 t collapse collapse in phase1 collapse in phase2 collapse in phase3 no collapse
- 11 -
observed that, in all bars, the temperature continues increasing for at least 30 minutes after the time of maximum gas temperature and, for the bar that is away from the heated surfaces, the temperature keeps on increasing significantly for more than 60 minutes after the end of the fire. Similar behavior could be plotted for different points in the concrete material. This delayed temperature increase in the internal parts of the section, plus the additional 10% decrease in compressive strength when concrete cools down to ambient explain the delayed failures.
Figure 5. Evolution of the temperature in the bars for a 15 minutes fire
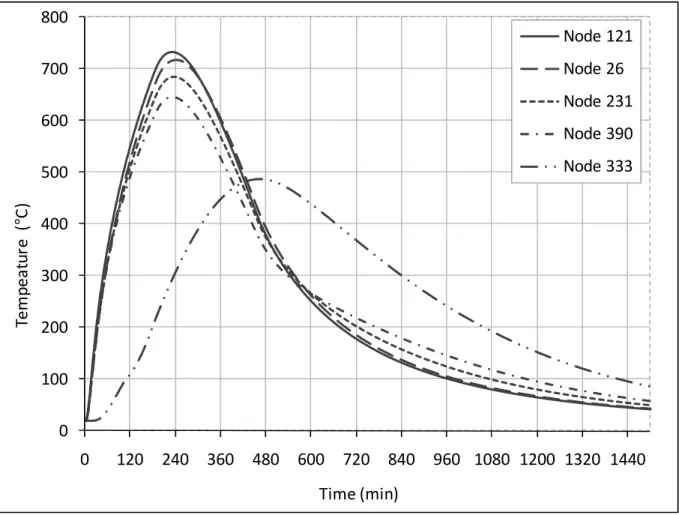
The evolution of the temperature in the same locations has been plotted on Figure 6 for the fire with a heating phase of 180 minutes and a return to ambient temperature after 441 minutes. For this longer fire, all temperature curves have almost reached their maximum value when the gas temperature is back to 20°C, at 441 minutes. This can explain why, in longer fires, there is no failure after the cooling phase of the fire because, if the temperature in the steel bars don’t increase anymore after the end of the fire, their properties have started to recover while, in the concrete, most of the decrease of strength and stiffness has already developed.
0 50 100 150 200 250 300 350 0 120 240 360 480 600 720 840 960 Te m p e ra tu re (° C ) Time (min) Node 121 Node 26 Node 231 Node 390 Node 333 390 390 390 390 231 231 231 231 231 121 121 121 121 121 390 333 333 333 26 26 26 X Y Z
- 12 -
Figure 6. Evolution of the temperature in the bars for a 180 minutes fire
INFLUENCE OF THE EFFECTIVE LENGTH OF THE COLUMN
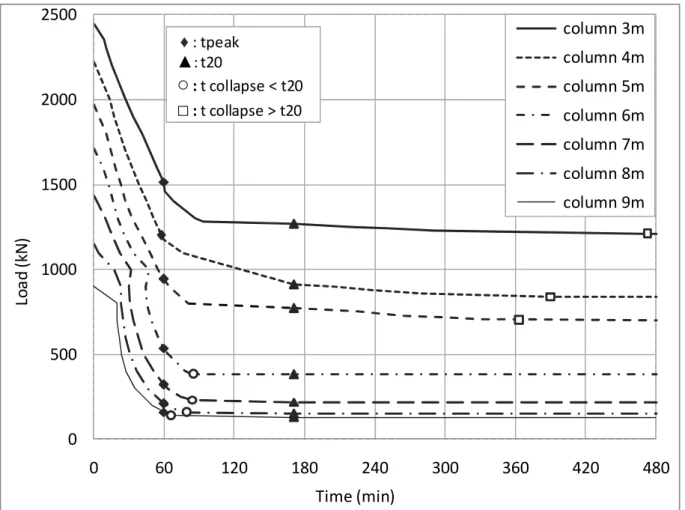
The analyses have been repeated for different length of the column and the results are summarized on Figure 7 for a heating phase that lasts for 60 minutes. Failures in the phase 3 of the fire are observed only in columns with a length of 5 meters or less. For longer columns, failure can be observed in the phase 2, the cooling phase, but the range of loads leading to collapse in the phase 2 reduces as the length of the column increases. For a 9 meters long column, nearly all failures are in the heating phase; if such a long column can survive to the heating phase of the fire, it is very likely to survive indefinitely.
For a longer fire with a heating phase of 120 minutes, no collapse during phase 3 was observed, even for short columns.
0 100 200 300 400 500 600 700 800 0 120 240 360 480 600 720 840 960 1080 1200 1320 1440 T e m p e a tu re ( ° C ) Time (min) Node 121 Node 26 Node 231 Node 390 Node 333
- 13 -
Figure 7. Influence of the length of the column
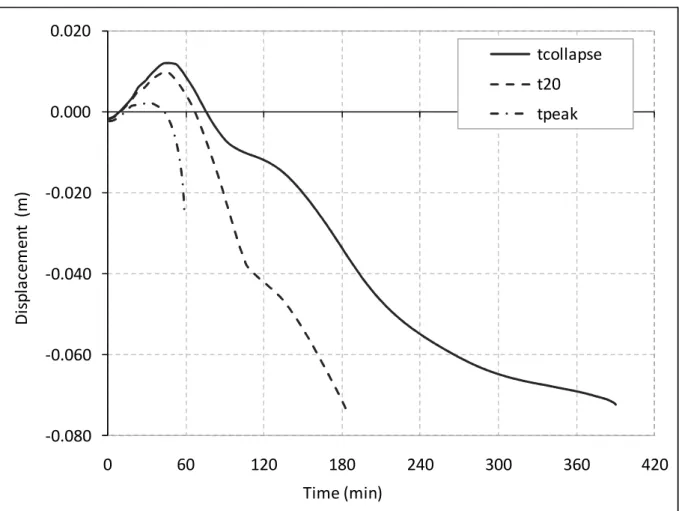
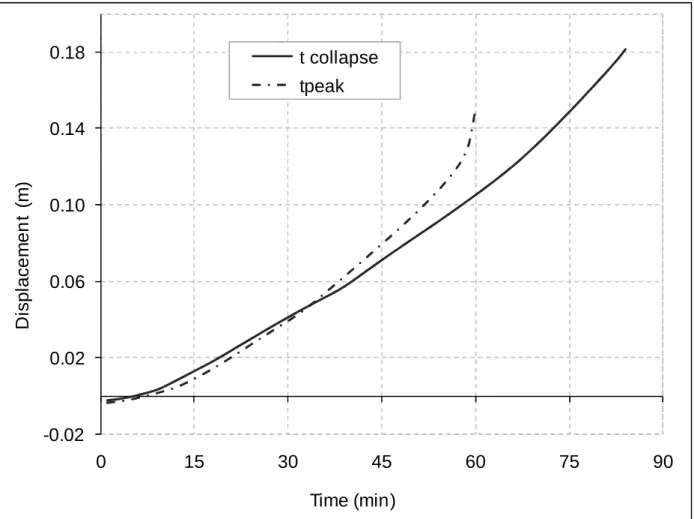
Figure 8 shows the evolution of the lateral displacement in a 4 m long column subjected to a fire with a heating phase of 60 minutes. Three different loads have been applied, one that leads to failure exactly after 60 minutes when the gas temperature is at the peak (curve noted “tpeak”), one that leads to failure at the end of the cooling phase when the gas temperature is back to 20°C (curve noted “t20”) and one that leads to failure after more than 6 hours (curve noted “tcollapse”). It can be observed that the displacements are toward the fire in the first minutes of the fire, driven by thermal gradients. After a while, heating of the material in the regions of the section near the fire leads to a decrease of stiffness in these regions and the effective neutral axis (with respect to stiffness) in the section moves away from the fire.
The displacement of neutral axis depends only on the temperature distribution in the section, which is the same for all column length. The lateral displacement of the column induced by the thermal gradient is proportional to the second order power of the length of the column and, in a short column, this displacement is rather limited. The second order bending moments are, in each section, proportional to the eccentricity of the load which is the difference between the displacement due to the thermal gradient (in one direction) and the displacement of the neutral axis (that develops in the other direction). In the cooling phase of the fire and as long as the temperature increases in the column, see Figure 5, the decrease of bending stiffness is overwhelming compared to the relatively modest influence of the decrease in thermal bowing
0 500 1000 1500 2000 2500 0 60 120 180 240 300 360 420 480 Lo a d ( k N ) Time (min) column 3m column 4m column 5m column 6m column 7m column 8m column 9m ♦: tpeak ▲: t20
○
: t collapse < t20□
: t collapse > t20- 14 -
that occurs simultaneously. In a short column, the eccentricity changes sign when the neutral axis moves and so do the displacements generated by the second order moments
Figure 8. Lateral displacement at mid height for a 4 m column
If the evolution of the lateral displacement is plotted for a longer column, see Figure 9, it is observed that the effects of the thermal gradient (proportional to L²) are so important that the variation of position of the neutral axis is not sufficient to counteract the thermal curvature; the displacements remain in the direction of the fire. In that case, as soon as the temperature decreases in the regions of the section near the fire, the severity of the thermal gradient decreases and so does the lateral displacement. The column is then more likely to survive, even if the strength and stiffness continue decreasing a little bit more in phase 2 and 3. This explains why longer column that survive to the heating phase are in a better position to survive also the cooling phase and, even more certainly, the phase 3 of the fire.
-0.080 -0.060 -0.040 -0.020 0.000 0.020 0 60 120 180 240 300 360 420 D is p la ce m e n t ( m ) Time (min) tcollapse t20 tpeak
- 15 -
Figure 9. Lateral displacement at mid height for a 6 m column
INFLUENCE OF THE SECTION OF THE COLUMN
The analyses have been repeated for a 4 meters column with a section of 600x600 mm side containing 12 bars of 20 mm diameter with a concrete cover of 40 mm. The results are presented on Figure 10 and Figure 11. Whereas failure in the phase 3 of the fire was observed only for relatively short fires when the 300x300 mm side section was considered, see Figure 3, delayed failures are observed here even for very long fires with a heating phase as long as 4 hours; in Figure 11, to be compared to Figure 4, the band of dangerous collapses in phase 3 extends towards fire durations of 240 minutes, for only 90 minutes with the smaller section. The range in loads leading to these failures after the fire is rather limited. For example, for the 120 minutes fire, failures after cooling can occur only if the load is between 5670 and 5270 kN. The dangerous range reduces as the duration of the fire increases. More critical is the fact that, if the load happens to be in the dangerous range, delayed failures can occur as late as 15 hours after the end of the fire.
Two reasons can explain the higher sensitivity of wider sections to delayed failure. The first is linked to the fact that, if the length of the column remains constant, higher sections lead to lower slenderness, which have been identified as more critical in the previous section of this paper. The second reason may be traced to the fact that, in larger sections, the temperatures in
-0.02 0.02 0.06 0.10 0.14 0.18 0 15 30 45 60 75 90 D isp la ce m e n t (m ) Time (min) t collapse tpeak
- 16 -
central zones of the section keep on increasing long after the gas temperature is back to ambient, which is not the case for smaller sections, see Figure 6.
Figure 10. Evolution of the fire resistance for a 600x600 mm side section
Delayed failures are thus strongly linked to the presence of a certain zone of the section in which the temperature continues to increase after the peak of the gas temperature. This may explain why, when a 4 m long column with a section 300x300 mm in side was analyzed as heated on four sides, no delayed failure could be observed.
0 2000 4000 6000 8000 10000 0 300 600 900 1200 1500 L o a d ( k N ) Time (min)
tpeak = 30 min tpeak = 60 min tpeak = 90 min tpeak =120 min tpeak = 180 min tpeak = 240 min
♦
: tpeak▲: t20
- 17 -
Figure 11. Failure in different phases for a 600x600 mm side section
INFLUENCE OF THE DURATION OF THE COOLING PHASE
It has been shown that the fires with the shortest heating phase are the most dangerous for the risk of collapse after the cooling phase. For a given duration of the heating phase, the influence of the duration of the cooling phase has been examined. This could have practical implications for the fire fighting strategy; is it more interesting for the firefighters to stop the fire as quickly as possible or to have it decreasing progressively, from the point of view of the risk of collapse after the cooling phase? Different fires with a heating phase of 45 minutes and cooling phases ranging from 0 to 195 minutes were considered, see Figure 12.
0 1500 3000 4500 6000 7500 9000 0 30 60 90 120 150 180 210 240 La o d ( k N ) Time (min) tpeak t20 tcollapse collapse in phase1 collapse in phase2 collapse in phase3 no collapse
- 18 -
Figure 12. Fires with different cooling phases
Figure 13 shows that, when the fire can be extinguished rapidly, the structure can survive with higher loads than when the fire is allowed to cool down slowly. If the load is 1400 kN, for example, stopping the fire in less than 15 minutes allows the column to survive indefinitely. Extinguishing the fire within 45 or 75 minutes leads to a failure after extinguishment, some 150 or 60 minutes after the end of the fire respectively. Any slower cooling will lead to a collapse during cooling, approximately 30 minutes after the beginning of the cooling phase.
It is thus probably a good idea to decrease the temperatures in the compartment as fast as possible in order to increase the probability of survival for the structure. It has nevertheless to be noted that, when the fire has been extinguished, there is dangerous period of about 6 to 7 hours during which a delayed collapse can occur, depending on the load level. This period is more or less the same for all cooling rates.
0 150 300 450 600 750 900 0 30 60 90 120 150 180 210 240 Te m p e ra tu re ( ° C ) Time (min.) t 20 = 240 min t20 = 210 min t20 = 180 min fire q2 t20 = 120 min t20 = 90 min t20 = 60 min t 20 = 45 min
- 19 -
Figure 13. Evolution of the resistance for different durations of the cooling phase
CONCLUSIONS
The numerical analyses undertaken here for concentrically loaded simply supported concrete columns heated on three sides show that a failure during the cooling phase of a fire is a possible event and, more dangerous, that a failure of the structure is still possible when the fire has been completely extinguished, in some cases several hours after conditions in the fire compartment have become tenable again and a first inspection of the building might be under way.
The main mechanisms for these delayed failures are to be found in the fact that temperatures in the central zones of the element can keep on increasing even after the gas temperature is back to ambient and also in the fact that concrete loses additional strength during cooling compared to the situation at maximum temperature. It has been shown that the most critical situations with respect to delayed failure arise for short fires and for columns with low slenderness (short length and/or massive section).
A fast cooling of the gas temperature increases the probability for the column to survive the fire infinitely. Yet, after the fire has been put out, there is a period of several hours during
1100 1200 1300 1400 1500 1600 0 60 120 180 240 300 360 420 480 540 600 660 L o a d ( k N ) Time (min) 0 min 15 min 45 min 75 min 135 min 175 min 195 min
♦
: tpeak ▲ : t20□
: t collapse > t20- 20 -
which the column is still under danger of collapse if the load is sufficiently high, whatever the velocity with which the fire has been extinguished.
As generic constitutive models have been used here for steel and for concrete, it does not really make sense to compare the results obtained from the simulation with the results of experimental tests (provided that such results are available). A generic model is typically used to make structural analyses; that means to examine the behaviour of structural elements, on the base of a material model that is widely accepted and considered in the scientific community as reproducing, in the average, the type of material behaviour observed for most concrete mixes. By using the same model as others use in their structural analyses, the author of the analysis cannot be blamed for having chosen the particular material model that suit his needs.
Still, a very strong assumption of the concrete constitutive model of the Eurocodes used in this analysis is that the effects of transient creep can be incorporated implicitly in the mechanical strain term. Although this assumption has proved to yield quite accurate results in structures heated by a standard time-temperature curve, its validity for representing the behaviour of concrete during a cooling phase may be questioned because transient creep is, in nature, not reversible. Recent numerical simulations have been made by the authors on the same columns as the one presented in this paper, now with an explicit transient creep constitutive model [15, 16]; it appeared that the occurrence of collapse during or after the cooling phase is predicted even more often with an explicit creep model than with the implicit model of Eurocode 2 that has been used for the results presented in this paper.
The question whether delayed collapse is also possible in other types of structure such as, for example, in moment resisting frames has not been addressed in this paper and could be the subject of other studies in the future.
NOMENCLATURE
Γ
= time factor used with the parametric time-temperature curves of Eurocode tpeak = time corresponding to the end of the heating phase - duration of the heatingphase of the fire
t20 = time corresponding to the end of the cooling phase – duration of the fire
(heating and cooling) L = length of the column Tmax = maximum temperature
ε
residual = residual thermal expansion of concrete at 20°C as a function of themaximum reached temperature t = time
- 21 -
tcollapse = fire resistance time for the lowest load that induces the collapse of the
- 22 - REFERENCES
1. Fike, R.S. & Kodur, V.K.R., “An approach for evaluating the fire resistance of CFHSS columns under design fire scenarios”, Journal of Fire Protection Engineering, Vol. 19, No. 4, 2009, pp. 229-259.
2. Kirby, B. R., Lapwood, D.G. & Thomson, G., “The reinstatement of fire damaged steel and Iron Framed Structures”, ISBN 0 900206 46 2 British Steel Corporation. Swinden Laboratories, 1986.
3. Li, Y-H & Franssen J-M, “Residual compressive strength of concrete after a fire”, Journal of Structural Fire Engineering, accepted for publication
4. Hsu, J-H & Lin, C-S, “Residual bearing capabilities of fire-exposed reinforced concrete beams”, International Journal of Applied Science and Engineering, Vol. 4, No. 2, 2006, pp. 151-164.
5. Hsu, J-H & Lin, C-S, “Effect of fire on the residual mechanical properties and structural performance of reinforced concrete beams”, Journal of Fire Protection Engineering, Vol. 18, n°4, 2008, pp. 245-274.
6. Wald, F & Kallerova, P, “Draft Summary of Results from Fire Test in Mokrsko 2008”, ISBN 978-8004267-0, Ceska technika, Prague, 2009.
7. http://cms.firehouse.com/web/online/In-The-Line-Of-Duty/Seven-Swiss-Firefighters-Die-in-Collapsed-Parking-Garage/39$36956.
8. EN 1991-1-2. Eurocode 1: Actions on structures – Part 1-2: General actions – Actions on structures exposed to fire, CEN, Brussels, 2002.
9. Franssen, J-M, “SAFIR: A thermal/structural program for modeling structures under fire”, Engineering Journal – American Institute of Steel Construction Inc, Vol. 42, n°3, 2005, pp. 143-158.
10. EN 1994-1-2. Eurocode 4 – Design of composite steel and concrete structures. Part 1-2 : General rules – Structural fire design, , CEN, Brussels, 2005.
11. EN 1992-1-2. Eurocode 2: Design of concrete structures – Part 1-2: General rules – Structural fire design, CEN, Brussels, 2004.
12. Schneider, U, Properties of materials at high temperatures: Concrete. RILEM, U. Schneider ed., Univ. of Kassel, 1985.
13. Yi-Hai, L & Franssen, J-M, „Test results and model for the residual compressive strength of concrete after a fire“, Journal of Structural Fire Engineering, Vol. 2, N° 1 (2011), 29-44
- 23 -
14. Felicetti, R, Gambarova, P G, Silva, M & Vimercati, M, “Thermal diffusivity and Residual Strength of High-Performance Light-Weight Concrete Exposed to High Temperature”, 6th Int. Symposium un Utilization of HSC/HPC, Leipzig, Proc. V2 (2002), 935-948
15 Gernay, T & Franssen, J-M, "A Comparison Between Explicit and Implicit Modelling of Transient Creep Strain in Concrete Uniaxial Constitutive Relationships", Proceedings of the Fire and Materials 2011 Conference, San Francisco (2011), 405-416
16 Gernay, T, "Effect of Transient Creep Strain Model on the Behavior of Concrete Columns Subjected to Heating and Cooling", Fire Technology, accepted for publication, DOI 10.1007/s10694-011-0222-0