Publisher’s version / Version de l'éditeur:
Vous avez des questions? Nous pouvons vous aider. Pour communiquer directement avec un auteur, consultez la première page de la revue dans laquelle son article a été publié afin de trouver ses coordonnées. Si vous n’arrivez pas à les repérer, communiquez avec nous à [email protected].
Questions? Contact the NRC Publications Archive team at
[email protected]. If you wish to email the authors directly, please see the first page of the publication for their contact information.
https://publications-cnrc.canada.ca/fra/droits
L’accès à ce site Web et l’utilisation de son contenu sont assujettis aux conditions présentées dans le site LISEZ CES CONDITIONS ATTENTIVEMENT AVANT D’UTILISER CE SITE WEB.
LEUKOS, 15, 2-3, pp. 97-114, 2019-03-11
READ THESE TERMS AND CONDITIONS CAREFULLY BEFORE USING THIS WEBSITE. https://nrc-publications.canada.ca/eng/copyright
NRC Publications Archive Record / Notice des Archives des publications du CNRC : https://nrc-publications.canada.ca/eng/view/object/?id=ea0d8aaf-f9f4-4db8-802c-86f3790e9748 https://publications-cnrc.canada.ca/fra/voir/objet/?id=ea0d8aaf-f9f4-4db8-802c-86f3790e9748
NRC Publications Archive
Archives des publications du CNRC
This publication could be one of several versions: author’s original, accepted manuscript or the publisher’s version. / La version de cette publication peut être l’une des suivantes : la version prépublication de l’auteur, la version acceptée du manuscrit ou la version de l’éditeur.
For the publisher’s version, please access the DOI link below./ Pour consulter la version de l’éditeur, utilisez le lien DOI ci-dessous.
https://doi.org/10.1080/15502724.2018.1550365
Access and use of this website and the material on it are subject to the Terms and Conditions set forth at
Judging the scientific quality of applied lighting research
Judging the Scientific Quality of Applied Lighting Research
Jennifer A. Veitch a, Steve A. Fotios b, and Kevin W. Houser c
aNational Research Council of Canada, Construction Research Centre, Ottawa, Ontario, Canada;bSchool of Architecture, University of Sheffield, Sheffield, UK;cDepartment of Architectural Engineering, Pennsylvania State University, University Park, Pennsylvania, USA
ABSTRACT
Applied lighting research is inherently interdisciplinary. Any one study in which investigators seek to understand the effects of light may involve expertise drawn from fields as varied as psychology, physiology, photobiology, vision science, engineering, physics, horticulture, and architecture. Despite differences in the specifics of research methods, data management, data analysis, and presentation, the logic of scientific thinking is a common thread. This is the basis on which the peer review system operates. This article leads readers through the criteria used by journal reviewers and editors to determine the acceptability of papers for publication in a peer-reviewed journal. This is done by review of the 1941 paper by Kruithof in which he described the now-famous “Kruithof curve” relating preferred light source color temperatures and illumi-nances: How would one review the original Kruithof paper today, and what would we expect to be told about this work in order to judge the validity of the conclusions?
ARTICLE HISTORY Received 27 February 2018 Revised 16 November 2018 Accepted 16 November 2018 KEYWORDS Applied photometry; dependent variables; external validity; independent variables; internal validity; peer review criteria; research design; research ethics; research methods; research quality
1. Introduction
One of the attractions of lighting research is that it is complex, requiring its practitioners to synthesize expertise from diverse fields, from physics to psy-chology and physiology to architecture. Applied lighting research, in which the focus is effects of light or lighting on humans, animals, or plants, is particularly challenging. As far as we are aware, there are no guidebooks to good research practice that bring together the unique combination of knowledge required to generate strong evidence in our field. This article provides a summary of what is required, within the scope limits of a journal article. We have chosen to use a very well-known paper as the basis for this presentation, Kruithof’s (1941) paper on tubular fluorescent lamps, in which he presented the “Kruithof curve” relating preferred light source color temperatures and illuminances. Many accept this curve as representing a fundamental truth; many others have attempted to replicate it (Boyce and Cuttle 1990; Davis and
Ginthner1990; Han and Boyce2003; Vienot et al.
2009: see Fotios (2017) for a more extensive list) with varying degrees of success. Its familiarity and the fact that it is so widely accepted—probably by many who have not read the original—are key reasons for our choice of case study here.
The intent is not to criticize Kruithof personally; indeed, his paper is typical of the standards and practices of his day. Other fundamental concepts in applied lighting were derived from work reported in a similar way, with far less detail than we expect today. For example, the original MacAdam ellipses describing sensitivity to color differences were devel-oped based on a large number of trials but only one observer (MacAdam1942).
Rather than criticizing Kruithof, our criticism is directed toward subsequent researchers who did not apply sufficient criticism when considering the findings of Kruithof and others and to practi-tioners who uncritically apply what they believe to be the findings. Here we refer to the 20 out of 29
CONTACTJennifer A. Veitch [email protected] National Research Council of Canada, Construction Research Centre; 1200 Montreal Rd., Bldg M-24, Ottawa, ON K1A 0R6, Canada.
This paper is based upon a seminar presented at the CIE 2017 Mid-term Meeting and Conference, Jeju Island, South Korea. Material in this paper also was presented in separate presentations by the authors at the CIE Expert Tutorial and Workshop on Research Methods for Human Factors in Lighting, Copenhagen, August 2018.
Robert Davis served as action editor for this article.
Color versions of one or more of the figures in the article can be found online atwww.tandfonline.com/ULKS.
Open Access for this manuscript was supported by the Illuminating Engineering Society and International Commission on Illumination. 2019, VOL. 15, NOS. 2–3, 97–114
https://doi.org/10.1080/15502724.2018.1550365
© 2019 Her Majesty the Queen in Right of Canada. Published with license by Taylor & Francis Group, LLC.
This is an Open Access article distributed under the terms of the Creative Commons Attribution-NonCommercial-NoDerivatives License (http://creativecommons.org/licenses/by-nc-nd/4.0/), which permits non-commercial re-use, distribution, and reproduction in any medium, provided the original work is properly cited, and is not altered, transformed, or built upon in any way.
studies collated within a review (Fotios 2017) of Kruithof-type research that did not meet recom-mended best practice (CIE 2014a); for example, that in a repeated measures design the different scenes were observed in a random order, that data were statistically analyzed, and that sufficient details of the work were reported to repeat the experiment. Particular criticism may be directed to those Kruithof studies conducted after the 1990 publications of Boyce and Cuttle (1990) and Davis and Ginthner (1990), both of which pre-sented results that disagree with Kruithof. Similarly, a review of spatial brightness studies suggested that only 19 out of 70 studies provided credible data (Fotios et al.2015).
The peer review process is intended to separate inferences and assertions that are tenable from those that are not. The peer review process is imperfect, however, and reflects best practices of the day. A reader may observe weaknesses or out-right problems not identified by peer reviewers or editors. New information may come to light that was unknown to the authors at the time of pub-lication, and such new information might alter the interpretation of their data. Though readers should expect due diligence by authors, reviewers, and editors, readers are also responsible for being thoughtful and critical consumers of research. Similarly, researchers are responsible for critically evaluating the research that they cite, rather than accepting the results and recommendations that appear in the peer-reviewed literature as truths.
In addition, standards for performing and reporting research change with time. Although some of our criticisms are about elements of the work that researchers were not considering, or could not consider, in 1941, we must nonetheless re-evaluate prior work if we are to improve on it. Our aim is to highlight best practices that present-day researchers ought to follow, so that the work we do will form a strong basis for lighting practice, recommendations, and standards and provide a solid foundation for future research.
Although the starting point for this article was a true experiment, the guidance that we provide here is applicable to the whole investigation con-tinuum, from observational studies that seek to explore the possibility of an interesting phenom-enon, to quasi-experimental and naturalistic
investigations in field settings (Cook and Campbell1979). Forethought, planning, and thor-ough reporting are common themes thrthor-oughout the scientific enterprise.
2. Kruithof’s original paper
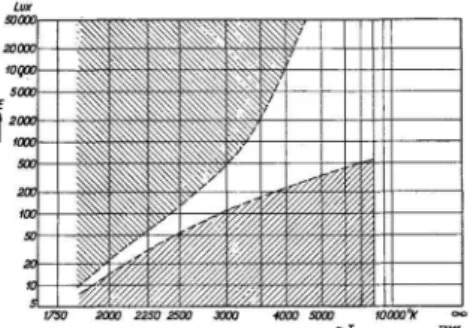
Kruithof (1941) wrote a general paper about a then-new light source, the tubular fluorescent lamp. Most of the paper concerned technical spe-cifications. What is now its most famous element was almost an aside. Figure 1 shows an extract from the paper with the text of the portion rele-vant to this case study.
3. Research quality considerations
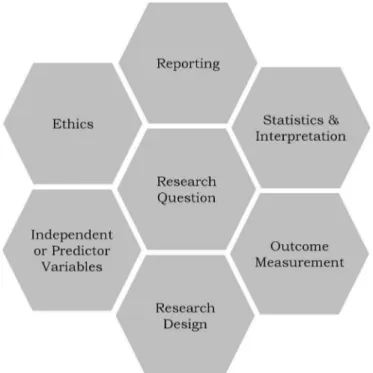
In this section we examine the elements that ought to be considered throughout the research plan-ning, execution, and reporting process and that journal editors and reviewers look for in manu-scripts.Figure 2shows these in a graphical format. The current text is an overview of the issues: Deeper discussion can be found in other sources (Cook and Campbell1979; Cooper2012; Kerlinger and Lee 2000; Shadish et al. 2002). We have focused on considerations that are especially per-tinent to research in applied lighting and have cited other lighting research that either employs aspects of the methods that we are advocating or expands upon the topics herein. Although the ele-ments are shown separately here, there are inter-actions between them, which necessitate choices throughout the research process. Furthermore, practical constraints do play a role in decisions about each element. We have identified some of the relevant issues in making these decisions, but space precludes an exhaustive treatment.
3.1 Research question
Researchers in applied lighting, like many (if not most) scientists, generally seek to identify causal relationships of the form “X causes Y.” We hope to be able to make strong inferences about causa-tion by eliminating plausible alternative explana-tions for what we observe (Platt1964). Ideally, the research project will start with a prediction—a hypothesis—about what relationship the
investigation will find. As discussed elsewhere in this special issue, hypotheses are strongest when there is a theoretical framework from which they are logical predictions (de Kort 2018). More exploratory investigations might start with a question: “Does X cause Y?” When there are no systematic data about what happens we might take a descriptive approach: “What happens to Y when X does this?” A hypothesis is a proposed answer to a research question; often the early stages of work on a given topic are more explora-tory or involve observations of phenomena. Regardless of the state of development of the field, one must be able to state clearly what one is studying.
What, then, of Kruithof (1941)? The paper con-cerns more than only the relationship between color temperature, illuminance, and preference; it is a general description of linear fluorescent lamps.
Perhaps that explains why there is no clear state-ment of the research question; indeed, the reader must infer the purpose of the investigation from a statement about its conclusions:
In the first place at a given level of illumination it is found that the colour temperature must lie within certain limits if the effect of the illumination is to be pleasing. (p. 69)
If we were to study this question today, we might say instead:
Hypothesis 1 (H1): We predict that there is an interaction of illuminance and correlated color tem-perature (CCT) on self-reported preference, with high-CCT light sources being preferred at high illu-minances and low-CCT light sources being pre-ferred at low illuminances.
The process of stating the research question, or of making a specific hypothesis, includes
Fig. 1The original 1941 Kruithof paper includes descriptions of linear fluorescent lamps and their operation in addition to the consideration of light source color temperature and illuminance. Extract reproduced here by kind permission of Royal Philips.
operationalization, or stating an operational defi-nition of the variables under investigation. Each variable requires a clear statement of the opera-tions involved in measuring it. On the “cause” side, for most lighting research this will require clear statements of the lighting conditions being manipulated or measured (see section 3.3), and on the “effect” side, operations related to the beha-viors or physiological states of interest (see section 3.4). One will also need to make clear statements concerning the steps taken to control for potential confounding variables, either through experimen-tal operations or through measurement and statis-tical control (see section 3.2.1).
A well-written hypothesis is an informative start to the experimental design. It reveals what the independent variables should be (e.g., illuminance and CCT) and what the dependent variable is (e.g., a subjective evaluation of preference). Where the hypothesis is based in theory or previous results, it should be possible to predict the outcome of changes in the independent variables. In most applied lighting research, the selection of indepen-dent variables and their levels should focus on providing information leading to guidance on levels that might be suitable for application. Both applied research and research focused on
developing explanatory models should include independent variables suitable to test the hypoth-esis (null and extreme conditions).
Concern about the rigor of research findings stemming in part from several retractions of falsi-fied data, failed attempts to replicate key findings in social psychology, and the awareness of the ease with which post hoc explanations can undermine theory development has led to the creation of an “open science” movement. The advocates for this approach argue that the open sharing of ideas will advance knowledge on important topics and recognize that weak research undermines the cred-ibility of all scientific advances. Researchers whose projects are intended to generate knowledge (rather than protectable intellectual property) might wish to consider preregistering their hypotheses and plans with a preregistration site such as the Center for Open Science (https://cos. io/).
3.2 Research design 3.2.1 Internal validity
Internal validity concerns the confidence that the reader can have that the conclusions drawn about a particular cause-and-effect relationship were
Fig. 2The research quality considerations discussed here. These interrelate and leave a hole if one is not addressed in sufficient detail.
warranted; colloquially, it concerns the judgment of how well the investigation was performed and reported. There are several important threats to internal validity (Cook and Campbell 1979; Shadish et al.2002), but the most important con-siderations for lighting research are the following:
● Confounding: The failure to exclude plausible
alternative explanations.
● Selection bias: Where groups are not
equiva-lent at the start of the investigation.
● Regression toward the mean: In which
extreme scores tend toward the mean over repeated testing.
● Testing effects: Changes in the outcome
mea-surements as a result of repeated measurement.
One aim of internal validity is to counter alter-native explanations for the findings. In a laboratory experiment, the investigator gener-ally has a high degree of control over possible confounding variables. Part of the research design process involves a logical dissection of the phenomenon to identify such possible alter-natives. For example, it is well known that there are daily cycles in cognitive performance (Carrier and Monk 2000). Therefore, a laboratory inves-tigation that tests the effects of a lighting condi-tion on cognitive performance should be designed such that all lighting conditions are tested at all relevant times of day (counterbalan-cing), to remove the effects of daily cycles from the cognitive performance data. What one does not want is for all of the data from one lighting condition to have been measured in the morning and all of the data for another condition to have been measured in the afternoon; in that case it would be logically impossible to conclude that differences in performance had been caused only by the lighting condition.
In a field investigation, there is generally less experimenter control but more external validity, or realism (see section 3.2.2). This does not remove the need for the investigator to address likely pos-sible confounders, but it often will change the solution. For example, in a field investigation one might include a measurement of fatigue or alert-ness in addition to the cognitive performance tests
and use statistical tools to control for changes in alertness.
In a correlational investigation, such as a survey, internal validity considerations will lead to the inclusion of additional variables, so that the statis-tical analyses can control for possible alternative explanations and selection biases. One will include, for example, detailed demographic ques-tions to ensure that survey respondents are similar between groups to be compared (e.g., occupants of two floors in one building). In any research design, careful planning to address potential threats to validity is mandatory.
Considering that Kruithof’s (1941) investiga-tion is an example of a psychophysics experiment, in which the aim is to understand the relation-ship between the physical stimulus (color tem-perature and illuminance) and a perception (“preference”), there are specific considerations in experimental design to eliminate sources of confounding. These have been discussed else-where in detail (CIE 2014a; Fotios 2018; Fotios and Atli 2012; Fotios and Houser 2009, 2013; Fotios et al. 2008) and are treated more briefly here.
In the hypothesis “X causes Y,” assume that X is a change in CCT and Y is a subjective eva-luation of the visual scene such as spatial bright-ness. Null conditions are trials in which no effect (i.e., no change in Y) is expected: if an effect is found, it reveals the presence and magnitude of an unintended bias. In simultaneous evaluations (e.g., side-by-side matching), a null condition means that the two visual fields are identical (or intended to be identical); that is, lit by lamps of identical spectral power distribution (SPD) and therefore identical CCT (along with identical luminances and spatial distributions etc.). If the outcome is a significant difference between the two fields, this suggests either that the two fields were not identical, as intended, or that there is some asymmetry in observers’ responses such as a bias toward one position over the other. In separate evaluations (e.g., a series of scenes are evaluated one after another), the null condition might be the repeated evaluation of one particular scene. If the first and second evaluations do not agree, this suggests an unintended bias such as an order effect.
Null condition trials reveal one possible source of bias. Counterbalancing and randomization should be used to offset expected problems related to the order of presentation. Consider an experi-ment requiring separate evaluations of several visual scenes in succession. Evaluations in a series of trials may be influenced by unintended effects such as boredom, fatigue, learning, experi-ence, and adaptation. If the visual scenes are observed in the same order by all participants, then evaluations of the latter scenes may be con-founded by these unwanted effects, confounding any conclusions drawn about the independent variables—an order effect. Visual scene X may be concluded as “brightest” simply because it was always evaluated after a relatively dim scene or because it was near the end of the test session and the participant wanted to finish quickly and ticked the end category for all rating scales. Order effects can be offset by mixing the order in which different levels of the independent variable are experienced. If there are a large number of levels, then this mixing may be best achieved by rando-mization, establishing a unique order for every participant.
An alternative to randomization is counterba-lancing, whereby the order is systematically varied and the levels are included in all possible combi-nations. In lighting experiments, it is common for each light setting to be observed by every partici-pant, a situation that can lend itself to a Latin square design, which is an efficient way to system-atically address nuisance variables (e.g., Meyers and Well 1991; Williams 1949). For side-by-side matching trials, one often overlooked variable is the relative position (e.g., left and right) in which the two scenes are located: this should also be counterbalanced so that two scenes, A and B, are observed as AB and BA for an equal number of trials, which is an example of a 2 × 2 Latin square. To underscore the importance of these steps, consider the visual clarity experiments of Aston and Bellchambers (1969). In that study, the refer-ence source illuminated the left-hand booth (of two booths) and a series of test sources illuminated the right-hand booth. Observers adjusted the illu-minance of only the left-hand booth so that the two matched. The authors conclude in favor of the light source illuminating the left-hand booth,
because that was set to a lower illuminance than lighting in the right-hand booth, and attributed this to some quality of its SPD. However, it is equally valid to use these results to conclude that observers prefer the left-hand booth (a position bias) or tend to set illuminances to a lower value (Fotios 2001) rather than draw conclusions about spectral effects. The absence of counterbalancing means that neither of these alternative conclusions can be rejected. In the case of Aston and Bellchambers (1969), counterbalancing would have involved alternating the test and reference sources between the left-hand and right-hand booths, so that the reference source illuminated each for 50% of the trials. In addition, the booth with the adjustable source should have starting conditions of both higher and lower illuminance than the reference condition (in a manner that is both randomized and counterbalanced) in order to test whether or not direction of dimming has an influence on the visual match.
Consider an experiment comparing several levels of CCT and concluding no significant effect: For that conclusion to be robust, the levels of CCT need to have been chosen with care. Essentially, there is a need to include extreme levels of CCT, which, according to previous results, are expected to lead to a significant difference in evaluation. If the experiment concludes no significant effect with extreme levels, then this suggests an error in either the current work or the previous work.
Given that all subjective evaluations are likely to be biased in some way (Poulton1977), one critical step is to evaluate the same set of independent variables using an alternative experimental proce-dure, such as ratings and paired comparisons (e.g., Houser and Tiller2003). We encourage the use of radically different procedures rather than a slight tweak. For example, Boyce (1977) used a simultaneous evaluation (side-by-side matching of two booths) and a separate evaluation (category rating, one booth at a time). Similar approaches have been employed using full-scale rooms (e.g., Houser et al. 2002, 2009). Even better, where pos-sible, is to use involuntary physiological responses or behavioral observation in parallel with subjec-tive evaluations, in addition to replication with a different evaluation procedure. If the conclusions drawn from different procedures agree, then we
can be more confident that the conclusions are robust. This approach is commonly known as “converging operations.” Converging operations can involve variations in research design and in the outcome measures or both together.
Consider the desire to investigate the alleged increase in alertness gained by exposure to blue light in the morning. One might test this with a laboratory experiment or a field quasi-experiment in which one adds more short-wavelength light to the environment; for example, with a bedside lamp. Alternatively, one might monitor morning light exposures in a field inves-tigation and then use a multiple regression approach to relate light exposures to the outcome measures. In either case, converging operations could address this question from multiple direc-tions, such as subjective evaluation of alertness, physiological measure of arousal (e.g., galvanic skin response), a measure of visual performance (e.g., reaction time on a d2 vigilance task), and observation of behavior. If the results of all of these different measures agree that morning expo-sure to blue light increases alertness, that is more convincing than any one measure alone.
Associated with internal validity is considera-tion of how the findings are interpreted. Subjective evaluations are affected by stimulus range bias, which means that the findings should be considered as relative effects and not tied (with-out further independent evidence) to an absolute threshold. For example, if study A concludes that luminance L characterizes the border between comfort and discomfort in the presence of a bright light source, study B is likely to conclude a different threshold luminance if it used a different range of luminances (Fotios and Cheal
2010). If the differences in luminance range are ignored, this may lead to the unwarranted call for a new model or a new standard. Building a complete model requires replication across a range of conditions, as well as using a variety of procedures.
Kruithof did not report whether or not there were any null condition trials in his work or whether or not there was counterbalancing of experimental presentations. Given that some of the illuminance conditions were said to have been provided by daylight together with electric
light, it seems unlikely that counterbalancing was used. Overall, we cannot judge the degree to which threats to internal validity were addressed in his experimental procedure.
3.2.2 External validity
Applied lighting researchers endeavor to have their research results inform professional practice, including applied lighting design and product development. This places a high premium on external validity, sometimes also called generaliz-ability, which is the extent to which the results of the investigation can be applied to other people, other places, or other times than the specific cir-cumstances of the experiment.
There is a trade-off to be made between internal validity and external validity. Laboratory investiga-tions generally have low external validity but offer greater potential to exclude confounding variables. Field investigations can include quasi-experiments (Cook and Campbell 1979; Shadish et al. 2002) in which there is an intervention applied to naturally occurring groups or correlational investigations in everyday settings. In either case, these offer better external validity but less control (see section 3.2.1). A comprehensive understanding of human factors in lighting will require a full range of investiga-tions that builds a framework from observation through explanation to application. For example, early investigations of the behavioral and well-being effects of individual control over local light levels began in the laboratory (Newsham and Veitch 2001) before a field simulation investiga-tion (Boyce et al. 2006) and, finally, a long-term field investigation (Veitch et al. 2010).
Clearly, Kruithof (1941) sought to understand how to use light sources for general illumina-tion, rather than to understand an underlying process. We know very little about the room in which the investigation took place except that it must have contained at least one table, on which light level was measured, and it must have had either windows or skylights, because daylight was used to create some of the lighting condi-tions. This makes it difficult to determine the range of conditions to which one can fairly apply the results. Kruithof himself seems to have understood the need to demonstrate gen-eralizability, because he noted that he obtained
roughly the same results in a living room with light-colored furnishings (but provided no further details of that evaluation). Present-day reporting standards include a complete specifi-cation of the space, the luminance distribution, the furnishings, and the surface reflectances, together with a description of the behavioral setting (e.g., office, bedroom, classroom) and the tasks performed there.
External validity also includes considering the range of people to whom the results apply. For most investigations we would not expect the same results to apply to children as to adults. It is unac-ceptable today to limit samples to one sex or the other, unless there is a scientific reason for doing so (this is rare in lighting research). In general, it is inadvisable to apply results obtained in one culture to another, except perhaps for the most fundamental visual processes, without first testing to determine whether or not there is a cultural influence.
3.3 Lighting conditions
When “X causes Y” is considered in applied light-ing research, the lightlight-ing conditions are “X.” The X variables are independent variables that should be intentionally and systematically manipulated in a true experiment or thoroughly measured and reported in a field investigation. Other conditions are considered “Z,” control variables that are intentionally fixed. Control variables also include potential confounds, like the time of day when testing occurs or the prior light history of partici-pants. These independent (manipulated) and con-trolled (fixed) variables stand in contrast to “Y,” where “Y” represent the dependent (a.k.a., out-come, response) measures discussed in section 3.4. Lighting researchers have a large variety of light-ing conditions that can be manipulated. These can be summarized in four major categories: spatial, spec-tral, intensity, and temporal. These factors are described below. They are treated in greater detail in a technical report from the CIE (2014b). When designing applied lighting research, one may intend to vary only a few conditions, but one must ensure that one does not unintentionally introduce varia-tion in other condivaria-tions because of the manner of operationalizing the chosen conditions.
In addition to the choice of independent variables is the choice of levels of that variable. This choice depends on the purpose of the experiment. If the aim is to demonstrate whether changes in an independent variable lead to a significant effect on the dependent variable, then large differences are required in a first experiment. To do this, the range of values considered may be beyond the range likely to be experienced in real life. Having demonstrated proof of concept, the next stage might be to show relevance to application: in this case, the range of variables may be smaller, closer to expected real-life situations, with smaller differences between levels to better characterize the relationship. If the smaller range now leads to a nonsignificant effect, that is useful knowledge. The choice of levels should also consider those used in previous studies. Including values that were previously used will enable a comparison of results, and thus dis-cussion of validity by repetition and a benchmark for the addition of further values, which extends the range used in prior work.
3.3.1 Spatial
Spatial lighting conditions concern the relative geometric patterns of optical radiation in an obser-ver’s field of view. Subvariables include the following:
● Luminance distribution on all visible surfaces; ● Size and shape of the field of view;
● Size and shape of the visual targets;
● Eccentricity of visual targets, which may be
foveal or parafoveal;
● Conditions that surround the visual task; ● Movement of the visual task;
● Viewing position.
These aspects of the visual field depend upon light sources and their optics, the three-dimensional geometry of the visual environ-ment, and surface finishes. Conditions may range from a uniform Ganzfeld to the highly nonuniform luminance distributions encoun-tered in real settings.
3.3.2 Spectral
Spectral lighting conditions concern the relative wavelength distribution of optical radiation, which is described by a light source’s SPD. Because SPD is an infinitely complex independent variable, researchers often use one or more derived quantities to simplify spectrum for purposes of variable definition and analysis. Some of these derived quantities are the following:
● CCT (2004a);
● The deviation of the light source chromaticity in
relation to the Planckian locus, Duv(Ohno2014);
● Chromaticity coordinates (either CIE x, y; u′,
v′; or Lab; CIE 2004a);
● Average measures of color fidelity, such as the
CIE general color rendering index (Ra; CIE
1995) and the fidelity index from IES TM-30-15 (Rf) and CIE 224:2017 (CIE 2017a; David
et al.2015; IES 2018);
● A measure of relative gamut, such as IES Rg
(David et al.2015; IES2018);
● Measures of chroma and hue distortions, which
relate to gamut shape and have been shown to be more predictive of color preference than average measures of color fidelity and gamut (e.g., Esposito and Houser 2018; Royer et al.
2017; Wei and Houser2017; Wei et al.2016);
● A measure of color discrimination, such as Rd
(Esposito and Houser 2017);
● Ability of the source spectrum to excite
fluor-escent whitening agents (e.g., David et al.
2013; Houser et al.2014).
The lighting community continues to debate how best to specify light source spectrum or, more specifically, how to reduce the spectrum to a set of numbers that are meaningful and simple to communicate. It is clear that no one metric adequately captures all of the informa-tion; however, when one tries to vary one metric, one can unintentionally vary another. For example, CCT alone is a poor indicator of light source color quality because it places the light source along a line of chromaticity coordi-nates normal to the Planckian locus. It is a useful shorthand, but the information is incomplete. CCT does not tell us precisely the
chromaticity coordinates, nor does it provide any information about the color rendering prop-erties of the light source.
Derived measures pose a serious risk of con-founding. For example, two sources may have the same CCT and CIE Ra but render objects very
differently. This could occur, for example, if one source increased average object chroma and the other source decreased average object chroma (Royer et al. 2017; Teunissen et al. 2016). Thus, CIE Ra alone could not be expected to
appropri-ately describe human responses to color rendering quality. Similar arguments could be made for all other spectrally derived measures, suggesting the need for extraordinarily careful manipulation of SPD as an independent variable. IES TM-30-15 includes more than 100 spectrally derived quanti-ties, including measures that characterize hue dis-tortions and chroma shifts for specific color evaluation samples and hue bins (IES 2018). The system was developed, in part, to provide a system with the granularity warranted for appropriate characterization of spectra in lighting research contexts.
3.3.3 Intensity
Intensity of lighting conditions concerns the abso-lute quantity of optical radiation, weighted by the appropriate spectral weighting function. The photometric system describes the spectral weight-ing functions for optical radiation (CIE2004b). An absolute SPD and an appropriate spectral weight-ing function or model are used to derive SI quan-tities such as luminance (cd/m2) and illuminance (lx; CIE 2004b) and melanopic flux (melanopic lux; CIE2018). Non-SI metrics may also be calcu-lated similarly, such as circadian stimulus or cir-cadian light (Rea et al. 2010). Modifiers such as field-of-view size or lens transmittance may be added to derive quantities such as corneal irradi-ance (µW/cm2) or retinal illuminance (trolands; CIE 2016; Wyszecki and Stiles 1982).
For applied lighting research, the measurement geometry is a critical element of specifying the stimulus intensity. Reports must specify where the measurement was made as well as the result of the measurement. See Guide to Protocols for Describing Lighting (CIE 2014b) for best practices.
3.3.4 Temporal
Temporal lighting conditions concern both the timing and duration of exposure to optical radiation as well as the temporal pattern of the output from the lighting system. The principal temporal variables can be summarized as follows:
● Steady-state visual stimulus, versus timed
exposure, or a flash;
● Morning, daytime, evening, or nighttime
exposure;
● Temporal light modulation of the stimulus,
which, depending upon frequency, modula-tion depth, and waveform, might or might not be perceived or sensed.
The first two considerations are especially impor-tant to circadian photobiology, because the non-visual response to optical radiation is dependent upon temporal alignment with the observer’s cir-cadian cycle and photic history. The advent of light emitting diodes (LEDs) has brought renewed research interest into the third consideration in the above list, with developments under way that will lead to new metrics that predict visual (e.g., flicker), behavioral, and neurological responses (CIE2017b).
The time course of luminance and chromatic adaptation are relevant temporal considerations because a person’s adaptation is critically impor-tant to how optical radiation is sensed and per-ceived. Complete adaptation encompasses both luminance and chromatic adaptation. Adaptation relates to the temporal presentation of the stimuli. For example, 90% chromatic adaptation at photo-pic levels typhoto-pically takes about a minute (Fairchild and Reniff 1995), which has implications for how presentation time is operationalized when design-ing an experiment. If an experimental design involves side-by-side viewing booths with sources that have different spectra, observers will be in a state of mixed adaptation. Full understanding of the phenomenon being studied would also require a second experimental procedure that avoids mixed adaptation.
3.3.5 Other variables, Kruithof’s work, and best practices
Though not lighting conditions, observer-related variables are also pertinent in applied lighting research. These variables include the number of observers and their sex, age, photic history, and the presence or absence of vision abnormalities (e.g., visual acuity correction, color deficiencies, cataracts) or other relevant characteristics. The cultural background of the observers can influence some types of observer responses. Knowledge level (e.g., expert, naïve) might (e.g., Houser et al.2004) or might not (e.g., Houser et al.2009; Houser and Hu 2004) influence participant responses. These items should be considered during participant selection and screening and must be reported in publications. To ensure internal validity, the experimental design should exclude the possible influence of some of these variables; for example, if fatigue could also affect the outcome (Y) vari-ables, all data collection should occur at the same time of day.
We know very little about the lighting condi-tions in Kruithof’s work. Regarding spatial consid-erations, we know that the conditions employed a combination of daylight, incandescent light, and fluorescent light. These sources emit light differ-ently, yet no information about luminance distri-bution was reported. We do not know whether the daylight was from a window or from a skylight. The size and shape of the room were not reported, and there was no information provided about interior reflectances. Spectrum was simplified to CCT as a derived quantity, but there is no ratio-nale as to why that was done. Intensity was described only as horizontal illuminance on a table with a height of 80 cm. Because we have no knowledge about the geometry of the room, the photometric distribution of the sources, the posi-tion of the observers, or the locaposi-tion of windows or skylights, it is impossible to know how the horizontal illuminance related to the stimulus seen by the observers. Moreover, we do not know the specific conditions for any of the light settings. Kruithof reported only a figure composed of two curves. The figure shows no data points, making it impossible to assess how the curves were
derived. Kruithof did not explain the duration or timing of the experiments and offered no informa-tion about participants—not even the number of people involved.
The definition, control, and measurement of variables in all of the above categories are neces-sary in order to derive data from which it is possible to make reliable and confident inferences. As editors and reviewers, we sometimes hear argu-ments that there was “not enough time or resources” to control or measure salient variables, or to include null conditions, or to counterbalance, or to employ more than one method. To the con-trary, we assert that there is not enough time or resources not to take such actions. Misleading results, resulting from an experiment that did not provide sufficient control, drain the resources of subsequent experimenters who are required to refute these misleading results by the inclusion of additional variables, levels, or procedural steps in their own work. Time and resources will always be limited, which is one reason why it is so important to run careful experiments. Unreliable data are the inevitable result of poorly crafted independent variables, lighting conditions that are inadequately characterized, and conditions that confound or conflate distinct aspects of the luminous environ-ment. The lighting science and research commu-nity cannot afford to squander resources on experiments that yield unreliable data.
Even though lighting conditions and other vari-ables have been presented here in separate cate-gories, in practice they are interrelated. Rigorous lighting research demands careful consideration, definition, characterization, measurement, and reporting of how and why the lighting conditions vary.
3.4 Outcome measurement
If one wants to understand how lighting condi-tions affect people, then all of the behavioral and physiological measurements available to other scientists are available. The knowledge base for developing these tools comes not from applied lighting itself but from psychology and physiology. The choice of outcome measurements generally flows logically from the research question or
hypothesis: One measures variables that reflect the concepts or processes one seeks to understand. We know that Kruithof (1941) sought to under-stand the conditions under which light sources appeared “pleasing” (see Fig. 1). We do not, how-ever, know how he measured pleasingness. Subsequent investigators have used a wide variety of means to assess this response to the lit environ-ment, from forced-choice answers to questions such as, “Which of these stimuli do you prefer?” (e.g., Wei and Houser 2017) or “Which room would you prefer to work in?” (Houser et al.
2004), to a forced-choice based on a categorical scale (e.g., strongly prefer, moderately prefer, slightly prefer; Wei et al. 2014, 2016), to several questions each based on a categorical rating (e.g., normal/shifted, saturated/dull, like/dislike; Royer et al.2016), to scales derived from a few questions related (for example) to the colorfulness, pleasant-ness, or naturalness of the appearance of a scene lit by various stimuli (Dikel et al.2014). Kruithof may have used one of these procedures or something entirely different: that we do not know means that we are unable to consider how well he countered the expected limitations associated with a specific procedure.
Using multiple methods (i.e., converging opera-tions) to measure the target concepts builds a strong knowledge base because every behavioral measurement has error, but each method and each tool tends to err in different ways. Psychometrics is a subdiscipline of psychology that concerns the development of measurement instruments with which to assess intangible concepts, called con-structs—for example, “preferred lighting condi-tions” is a construct, as is “knowledge about photometry.” Instructors who set examination questions are performing psychometry, although they might be unlikely formally to apply its stan-dards (American Educational Research Association, the American Psychological Association, and the National Council on Measurement in Education 2014).
In the authors’ experience as journal editors and reviewers, applied lighting researchers generally seem unaware of validity and reliability as applied to their behavioral and physiological measure-ments—certainly far less aware than they are of the need for good photometric measurement
practice. Validity concerns whether or not the measurement tool captures the concept intended, without unintentionally also overlapping with other concepts. Face validity concerns whether or not the measurement looks like it ought to mea-sure what is intended. It is a necessary but gener-ally not sufficient demonstration of the validity of the measurement. In the development process for these measurement tools, we look for convergent validity (when the tool correlates well with other concepts to which it ought to relate) and discrimi-nant validity (when the tool does not correlate with concepts to which it logically has no relation). Reliability concerns whether or not the measure-ment tool is internally consistent but also has a dimension of repeatability—if the same person responds twice to the same conditions using this tool, the responses should be the same. A full treatment of this topic is beyond the scope of this article, but a classic text in the field is Ghiselli et al. (1981).
3.5 Statistics and interpretation
Statistics is a branch of applied mathematics that deals with the analysis and presentation of data using equations, tables, and figures. Descriptive statistics summarize data from a sample and infer-ential statistics suggest whether differences between data are caused by manipulated variables or random variation. As noted in section 3.1, it is preferable that a research project begin with a hypothesis “X causes Y,” where both descriptive and inferential statistics should be employed. For exploratory investigations with questions like “does X cause Y?” and even more preliminary work with question like “what happens to Y when X does this?” it might only be possible to report descriptive statistics. Generally, clear hypotheses lead to experimental designs that yield data that can be analyzed with inferential statistics, leading to conclusions that have the potential to advance lighting science. In this sense, using statistics is not something that hap-pens only after data are collected. Rather, the research design process of conceptualizing research problems, formulating hypotheses, and developing methods for data collection provides a framework to support the use of various
statistical procedures in the service of answering the research question and testing the hypothesis.
For any given research question, statistics rarely provide a simple yes/no answer. The experimenter must interpret data using objective parameters (e.g., p value) coupled with subjective criteria (e.g., α level). Interpretation is informed by statis-tical significance but also involves making distinc-tions between statistical significance and substantive importance (also known as practical significance). An effect size is a numerical measure of the strength of an outcome. An effect size may be large and statistically significant and still be unimportant. Conversely, an effect size may be small and statistically nonsignificant yet still be important. Such interpretations, which may seem counterintuitive, can occur for statistical or prac-tical reasons. For example, very large sample sizes lead to statistical significance for unimportant relationships (e.g., at a sample size of 1000 a Pearson correlation coefficient of 0.01 is statisti-cally significant, but it is unlikely that such a low correlation would be of practical interest). Thus, it is pertinent to design experiments so that data are gathered in a way that both effect sizes and infer-ential statistical tests may be reported and inter-preted (see also Uttley2018). We join others (e.g., Peng et al. 2013; Vacha-Haase et al. 2000) in encouraging the reporting of effect sizes and their integration with other statistical tests. The American Psychological Association Task Force on Statistical Inference summarized guidance on this topic (Wilkinson1999).
Figures and tables are often essential to the appropriate interpretation of numerical data. In our experience, there is a wide range of quality and author interest in the display of data through carefully crafted figures. Effective figures often require carefully scaled axes, different marker types and line weights, and explanatory captions, all designed to work in harmony and to facilitate the visual interpretation of data trends. The needs of good formatting are unlikely to be met by the default values chosen by graph drawing software. It may take many hours to construct a single figure that is based on a complex set of data. In our experience, the investment in creating effective visualizations of data is time well spent; results presented well graphically are often more
persuasive than paragraphs of text. Conversely, we deplore the use of graphical presentations in which, for example, scales are manipulated so that small differences are magnified to appear more important.
At the time Kruithof worked, the requirements for detailed statistical analysis were few, and many of the statistical procedures that are now routine had not been developed. Manual computation of inferential tests was time consuming and the role of these tests in the support of arguments about causation was not universally recognized. There are no such details in his report (see Fig. 1). Although his report may have met the standards of the day, we are nonetheless left with unan-swered questions about the relationship he observed. For example, what does it mean to have established the relationship to pleasingness “with an accuracy of 20 or 30 percent”?
3.6 Research and publication ethics
We have choices about the moral framework in which we act; however, responsible researchers will choose to act within the commonly accepted ethical frameworks for their professions. Different regions of the world organize themselves differ-ently in this regard; in Canada, all university-based researchers, regardless of discipline, are expected to follow the Tri-Council Policy Statement: Ethical Conduct for Research Involving Humans (Government of Canada 2018). In the United States, the Federal Policy for the Protection of Human Subjects (“Common Rule”; U.S. Department of Health and Human Services 2018) applies. In other parts of the world, we have been told that individual disciplines are responsible for developing their own ethical frameworks.
As far as we have been able to ascertain, only psychology among the disciplines relevant to light-ing research has a slight-ingle, universal framework for ethics, the Universal Declaration of Ethical Principles for Psychologists (International Union of Psychological Science, International Association of Applied Psychology2008). The fra-mework consists of four principles, each of which illuminates core values that are based on funda-mental human rights:
Principle I Respect for the Dignity of Persons and Peoples
Principle II Competent Caring for the Well-Being of Persons and Peoples Principle III Integrity
Principle IV Professional and Scientific Responsibilities to Society
Kruithof (1941) worked before the development of such frameworks to protect the dignity, safety, and interests of those whose data are the subject of study. There was no requirement in his day for free and informed consent, protection of privacy, con-fidentiality of data, or a thorough analysis of the risks and benefits of participation prior to deciding to participate. These are among the considerations for the ethical conduct of research today.
Most institutions today have some formal requirement for oversight of research involving human participants, but the ethical conduct of research requires more than following administra-tive procedures; it requires that the researcher accept responsibility for treating participants with respect, reflecting the privilege it is that others agree to contribute their time and effort for our benefit. The result of careful thought about ethical matters is often stronger research. The starting point ought to be the consideration that an inves-tigation that is scientifically invalid is also unethi-cal because it wastes the effort and information of the participant and unnecessarily exposes them to risk, however slight.
Research ethics extend beyond the ways in which we treat research participants while data are being collected. To respect both the contri-bution of those individuals to the work and to respect society writ large, we also must consider publication ethics. Fulfilling these responsibil-ities will include reporting the investigation thoroughly enough to permit readers to exam-ine it critically; limiting conclusions to those that the data will support; citing sources truth-fully; and obtaining permission for any repro-duced material. Other aspects of publication ethics as they are understood today include accurate authorship credits and the acknowl-edgment of any potential conflicts of interest (Committee on Publication Ethics 2017).
3.7 Reporting
For papers that report scientific research results, best practices for reporting can be considered within a manuscript’s methods, results, and con-clusions. We commend the general guidance recently provided in the psychology community as providing useful information that can be applied to many lighting investigations (Appelbaum et al.2018; Levitt et al. 2018).
As a general rule, methods should be reported with sufficient detail to permit another person who is educated on the topic to duplicate the experiment. For example, if observers evaluated several different lighting conditions within a full-scale room, report the dimensions and reflectances of room surfaces. If there were objects in the room, describe them (e.g., Royer and Wei 2017). Provide a photograph of the room. Explain where the observer was positioned and the direction of gaze. Summarize the luminous conditions, as with luminance imaging (preferable) or a sufficient number of spot measurements. The make and model of measurement instruments should be described, including the most recent calibration date and traceability of the calibration.
Physical measurements, like all other measure-ments, have a statistical distribution (e.g., Adamsson et al. 2018). If an experiment reports that 30 participants evaluated a room that was illuminated to 300 lx at a given measurement point, the range at that measurement point should be reported, because it surely was not 300 lx for all of the 30 participants. Or, if it was, then the authors should describe how they managed to fix the illuminance to such a precise and unvarying set point!
Reporting methods in the careful way described above permits informed interpretations of the data. The first task of the authors should be to convince themselves that their data and inferences can be justified by their methods and data. This is best accomplished by being your own harshest critic. Alternative explanations should be consid-ered at every step in the experiment, from con-ceptualization and experimental design through analysis and reporting. Authors who take steps to rule out alternative explanations advance lighting science with reliability and conviction. Conversely,
when poorly crafted experiments appear in the literature, they may cause damage by retarding real advancement. It may take decades to over-come ill-informed inferences and false conclusions that are based on unreliable data. Repeating some-thing that is false does not make it true, but if repeated with enough frequency, enough people will believe it to be true. After more than 75 years, this is indeed the case with Kruithof’s curve (Fotios2017).
Another common problem is the tendency to expect too much from a study or from a data set. Rarely do studies prove anything, though they should support something in a limited way, given the practical and contextual factors of the study. Resist the tempta-tion to overgeneralize. Overreaching statements weaken a paper and invite a reader to doubt other parts of the manuscript. Results should be reported with cautionary language. Generalizations, if offered, should be appropriately qualified.
The best manuscripts do more than just report data and make inferences that are fair and balanced—they also offer wisdom to readers. Comprehensive and insightful manuscripts begin with thorough yet succinct literature reviews that provide precedents for the study and offer a clear rationale and motivation for the new experimental work. Well-written manuscripts often conclude by placing the results within the context of other studies and bridge the gap between research and application. Such manu-scripts are written by authors who not only explain what they did but also why they did it and why it is important.
Finally, a manuscript is only as good as its weakest part. If the introduction and background are weak, then it may appear that the work has weak theoretical underpinnings. If the methods are inadequately described, or if the data are not thoroughly analyzed, then how can a reader trust the results? If the writing is unclear, or if figures are poorly crafted, readers may be too frustrated to read the manuscript. Effective report-ing includes attention to completeness, craftsmanship, clarity, and conciseness.
4. Conclusion
In this article we have discussed several aspects of research planning that should lead toward
findings that are more robust and significant. This discussion has used the Kruithof curve as an example, which related pleasing conditions of illumination to specific relationships between illuminance and CCT. Although the Kruithof curve has been widely cited in design texts and frequently “validated” in subsequent experimental work, we suggest that this should not be the case: The work leading to the Kruithof curve does not meet current expecta-tions of good experimental design. A review of Kruithof-type experiments (Fotios 2017) sug-gested an entirely different relationship, speci-fically that there is no consistent relationship between CCT and pleasing conditions, and
people generally do not prefer dim lighting. If this recent review is correct, then the result of poor research has been to mislead design rather than to support it.
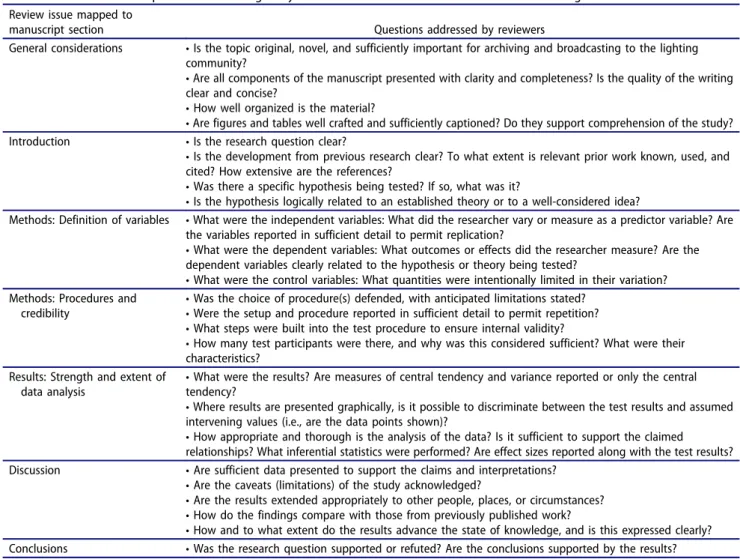
To summarize, inTable 1we offer a checklist of the points that we ask journal reviewers to use in evaluating manuscripts that report scientific research results. Authors who take care to address these points in the planning of their projects, and who refer to this list in the preparation of their manuscripts, should find that the path to publica-tion runs more smoothly. Readers of published work might also wish to ask these questions as they evaluate the strength of the investigations they encounter. The result should be faster and
Table 1.Examples of the questions that might be considered when reviewing the work of others that reports scientific research results. Manuscripts of this type should contain the usual sections of introduction, methods, results, discussion, conclusions, and references. Authors can expect to be challenged by reviewers and editors if critical details are missing.
Review issue mapped to
manuscript section Questions addressed by reviewers
General considerations • Is the topic original, novel, and sufficiently important for archiving and broadcasting to the lighting community?
• Are all components of the manuscript presented with clarity and completeness? Is the quality of the writing clear and concise?
• How well organized is the material?
• Are figures and tables well crafted and sufficiently captioned? Do they support comprehension of the study?
Introduction • Is the research question clear?
• Is the development from previous research clear? To what extent is relevant prior work known, used, and cited? How extensive are the references?
• Was there a specific hypothesis being tested? If so, what was it?
• Is the hypothesis logically related to an established theory or to a well-considered idea?
Methods: Definition of variables • What were the independent variables: What did the researcher vary or measure as a predictor variable? Are the variables reported in sufficient detail to permit replication?
• What were the dependent variables: What outcomes or effects did the researcher measure? Are the dependent variables clearly related to the hypothesis or theory being tested?
• What were the control variables: What quantities were intentionally limited in their variation? Methods: Procedures and
credibility
• Was the choice of procedure(s) defended, with anticipated limitations stated? • Were the setup and procedure reported in sufficient detail to permit repetition? • What steps were built into the test procedure to ensure internal validity?
• How many test participants were there, and why was this considered sufficient? What were their characteristics?
Results: Strength and extent of data analysis
• What were the results? Are measures of central tendency and variance reported or only the central tendency?
• Where results are presented graphically, is it possible to discriminate between the test results and assumed intervening values (i.e., are the data points shown)?
• How appropriate and thorough is the analysis of the data? Is it sufficient to support the claimed relationships? What inferential statistics were performed? Are effect sizes reported along with the test results? Discussion • Are sufficient data presented to support the claims and interpretations?
• Are the caveats (limitations) of the study acknowledged?
• Are the results extended appropriately to other people, places, or circumstances? • How do the findings compare with those from previously published work?
• How and to what extent do the results advance the state of knowledge, and is this expressed clearly? Conclusions • Was the research question supported or refuted? Are the conclusions supported by the results?
more efficient progress in applied lighting research, which surely is a goal shared by all. Disclosure statement
No potential conflict of interest was reported by the authors.
Funding
The authors report no funders for the preparation of this article.
ORCID
Jennifer A. Veitch http://orcid.org/0000-0003-3183-4537
Steve A. Fotios http://orcid.org/0000-0002-2410-7641
Kevin W. Houser http://orcid.org/0000-0001-6097-1560
References
[AERA APA and NCME] American Educational Research Association, the American Psychological Association and the National Council on Measurement in Education.2014. Standards for educational and psychological testing. Washington (DC): AERA.
Adamsson M, Laike T, Morita T.2018. Comparison of static and ambulatory measurements of illuminance and spectral composition that can be used for assessing light exposure in real working environments. Leukos:1–14. Online before print. doi:10.1080/15502724.2017.1391101.
Appelbaum M, Cooper H, Kline RB, Mayo-Wilson E, Nezu AM, Rao SM. 2018. Journal article reporting stan-dards for quantitative research in psychology: the APA publications and Communications Board task force report. Am Psychol. 73(1):3–25.
Aston SM, Bellchambers HE.1969. Illumination, colour ren-dering and visual clarity. Light Res Technol. 1(4):259–61. Boyce PR. 1977. Investigations of the subjective balance
between illuminance and lamp colour properties. Light Res Technol. 9:11–24.
Boyce PR, Cuttle C. 1990. Effect of correlated colour tem-perature on the perception of interiors and colour discrimination. Light Res Technol. 22(1):19–36.
[CIE] Commission Internationale de l’Eclairage. 1995. Method of measuring and specifying colour rendering properties of light sources, 3rd ed. Vienna (Austria): CIE. Publication No: CIE 13.3-1995.
[CIE] Commission Internationale de l’Eclairage.. 2004a. Colorimetry. Vienna (Austria): CIE. Publication No: CIE 15:2004.
[CIE] Commission Internationale de l’Eclairage. 2004b. Photometry - The CIE system of physical photometry.
Vienna (Austria): CIE. Publication No: CIE S 010/ E:2004/ISO 23539:2005(E).
[CIE] Commission Internationale de l’Eclairage. 2014a. Guidance towards best practice in psychophysical proce-dures used when measuring relative spatial brightness. Vienna (Austria): CIE. Publication No: CIE 212:2014. [CIE] Commission Internationale de l’Eclairage. 2014b.
Guide to protocols for describing lighting. Vienna (Austria): CIE. Publication No: CIE 213:2014.
[CIE] Commission Internationale de l’Eclairage. 2016. ILV: International lighting vocabulary, 2nd edition. Vienna (Austria): CIE. Publication No: CIE DIS 017/E:2016. [CIE] Commission Internationale de l’Eclairage. 2017a. CIE
2017 Colour fidelity index for accurate scientific use. Vienna (Austria): CIE. Publication No: CIE 224:2017. [CIE] Commission Internationale de l’Eclairage.2017b. Final
report CIE stakeholder workshop for temporal light mod-ulation standards for lighting systems. Vienna (Austria): CIE. Publication No: CIE TN008:2017.
[CIE] Commission Internationale de l’Eclairage. 2018. CIE system for metrology of optical radiation for ipRGC-influ-enced responses to light. Vienna(Austria): CIE. Publication No: CIE ED/IS 026/E:2018.
Boyce PR, Veitch JA, Newsham GR, Jones CC, Heerwagen JH, Myer M, Hunter CM.2006. Lighting qual-ity and office work: two field simulation experiments. Light Res Technol. 38(3):191–223.
Carrier J, Monk TH. 2000. Circadian rhythms of perfor-mance: new trends. Chronobiol Int. 17(6):719–32. Committee on Publication Ethics. 2017. Core practices.
https://publicationethics.org/core-practices.
Cook TD, Campbell DT. 1979. Quasi-experimentation: design and analysis for field settings. Boston (MA): Houghton Mifflin.
Cooper H, Ed.2012. APA Handbook of Research Methods in Psychology. Washington (DC): American Psychological Association.
David A, Fini PT, Houser KW, Ohno Y, Royer MP, Smet KA, Wei M, Whitehead L. 2015. Development of the IES method for evaluating the color rendition of light sources. Opt Express. 23(12):15888–906.
David A, Krames MR, Houser KW.2013. Whiteness metric for light sources of arbitrary color temperatures: proposal and application to light-emitting-diodes. Opt Express. 21 (14):16702–15.
Davis RG, Ginthner DN.1990. Correlated color temperature, illuminance level and the Kruithof curve. J Illum Eng Soc. 19:27–38.
de Kort YAW.2018. Theoretical and methodological considera-tions when planning research on human factors in lighting. Leukos. This issue. doi:10.1080/15502724.2018.1558065
Dikel EE, Burns GJ, Veitch JA, Mancini S, Newsham GR.
2014. Preferred chromaticity of color-tunable LED lighting. Leukos. 10(2):101–15.
Esposito T, Houser KW. 2017. A new measure of color discrimination for LEDs and other sources. Light Res
Technol:147715351772920. Online before print. doi:10.1177/1477153517729200.
Esposito T, Houser KW.2018. Models of colour quality over a wide range of spectral power distributions. Light Res Technol:147715351876595. Online before print. doi:10.1177/1477153518765953.
Fairchild MD, Reniff L. 1995. Time course of chromatic adaptation for color-appearance judgments. J Opt Soc Am A. 12(5):824–33.
Fotios S, Atli D. 2012. Comparing judgements of visual clarity and spatial brightness through an analysis of stu-dies using the category rating procedure. Leukos. 8 (4):261–81.
Fotios S, Atli D, Cheal C, Houser K, Logadóttir A. 2015. Lamp spectrum and spatial brightness at photopic levels: A basis for developing a metric. Light Res Technol. 47 (1):80–102.
Fotios SA.2001. An error in brightness matching associated with the application of dimming. Light Res Technol. 33 (4):223–31.
Fotios SA.2017. A revised Kruithof graph based on empirical data. Leukos. 13(1):3–17.
Fotios SA. 2018. Using category rating to evaluate the lit environment: is a meaningful opinion captured?. Leukos. This issue. doi:10.1080/15502724.2018.1500181.
Fotios SA, Cheal C.2010. Stimulus range bias explains the outcome of preferred-illuminance adjustments. Light Res Technol. 42(4):433–47.
Fotios SA, Houser KW. 2009. Research methods to avoid bias in categorical ratings of brightness. Leukos. 5 (3):167–81.
Fotios SA, Houser KW.2013. Using forced choice discrimi-nation to measure the perceptual response to light of different characteristics. Leukos. 9(4):245–49.
Fotios SA, Houser KW, Cheal C. 2008. Counterbalancing needed to avoid bias in side-by-side brightness matching tasks. Leukos. 4(4):207–23.
Ghiselli EE, Campbell JP, Zedeck S. 1981. Measurement theory for the behavioral sciences. San Francisco (CA): W. H. Freeman.
Government of Canada.2018. Panel on research ethics: navi-gating the ethics of human research [accessed 2018 Feb 27].http://www.pre.ethics.gc.ca/eng/index/.
Han S, Boyce PR 2003. Illuminance, CCT, décor and the Kruithof curve. 25th Session of the CIE, San Diego, 25 June–2 July 2003. 1(2); D3 282-285 (see also Han S. Effect of illuminance, CCT and décor on the perception of light-ing. MS in Lighting thesis.
Houser KW, Fotios SA, Royer MP. 2009. A test of the S/P ratio as a correlate for brightness perception using rapid-sequential and side-by-side experimental protocols. Leukos. 6(2):119–38.
Houser KW, Hu X.2004. Visually matching daylight fluor-escent lamplight with two primary sets. Col Res Appl. 29 (6):428–37.
Houser KW, Tiller DK. 2003. Measuring the subjective response to interior lighting: paired comparisons and
semantic differential scaling. Light Res Technol. 35 (3):183–98.
Houser KW, Tiller DK, Bernecker CA, Mistrick RG. 2002. The subjective response to linear fluorescent direct/indir-ect lighting systems. Light Res Technol. 34(3):243–64. Houser KW, Tiller DK, Hu X. 2004. Tuning the fluorescent
spectrum for the trichromatic visual response: A pilot study. Leukos. 1(1):7–22.
[IUPSyS and IAAP] International Union of Psychological Science, International Association of Applied Psychology.
2008. Universal declaration of ethical principles for psychologists. http://www.iupsys.net/about/governance/ universal-declaration-of-ethical-principles-for-psycholo gists.html.
[IES] Illuminating Engineering Society. 2018. IES-TM-30-18 Method for evaluating light source color rendition. New York (NY): The Illuminating Engineering Society; 26 p. Houser KW, Wei M, David A, Krames M. 2014. Whiteness Perception under LED Illumination. Leukos. 10(3):165–80. Kerlinger FN, Lee HB. 2000. Foundations of behavioral
research. Fort Worth (TX): Harcourt College.
Kruithof AA.1941. Tubular luminescence lamps for general illumination. Philips Tech Rev. 6(3):65–73.
Levitt HM, Bamberg M, Creswell JW, Frost DM, Josselson R, Suárez-Orozco C.2018. Journal article reporting standards for qualitative primary, qualitative meta-analytic, and mixed methods research in psychology: the APA publications and communications board task force report. Am Psychol. 73 (1):26–46.
MacAdam DL.1942. Visual sensitivities to color differences in daylight. J Opt Soc Am. 32(5):247–74.
Meyers JL, Well AD. 1991. Research design and statistical analysis. New York (NY): HarperCollins.
Newsham GR, Veitch JA.2001. Lighting quality recommen-dations for VDT offices: A new method of derivation. Light Res Technol. 33:97–116.
Ohno Y.2014. Practical use and calculation of CCT and Duv. Leukos. 10(1):47–55.
Peng CYJ, Chen LT, Chiang HM, Chiang YC. 2013. The impact of APA and AERA guidelines on effect size reporting. Ed Psych Rev. 25(2):157–209.
Platt JR.1964. Strong inference. Science. 146(3642):347–53. Poulton EC. 1977. Quantitative subjective assessments are
almost always biased, sometimes completely misleading. Br J Psychol. 68:409–25.
Rea M, Figueiro M, Bierman A, Bullough J.2010. Circadian light. J Circadian Rhythms. 8(1):2.
Royer MP, Houser KW, David A.2017. Chroma shift and gamut shape: Going beyond average color fidelity and gamut area. Leukos. 14(3):149–65. doi:10.1080/15502724.2017.1372203. Royer MP, Wei M. 2017. The role of presented objects in
deriving color preference criteria from psychophysical studies. Leukos. 13(3):143–57.
Royer MP, Wilkerson A, Wei M, Houser KW, Davis RG.2016. Human judgements of color rendition vary with average fidelity, average gamut, and gamut shape. Light Res Technol. 49(8):966–91. doi:10.1177/1477153516663615.