Universit´e Ferhat Abbas S´etif 1
Facult´e des Sciences, D´epartement de Physique
Th`
ese
Pr´esent´ee pour obtenir le titre de Docteur en Radiophysique et Imagerie Biom´edicale
D´
eveloppement d’une approche
hybride pour l’am´
elioration des
images CBCT pour la
radioth´
erapie adaptative
Halima Saadia Kidar
Pr´esent´ee le 01 D´ecembre 2020, devant le jury compos´e de:
Faycal Kharfi Pr. Universit´e Ferhat Abbas S´etif 1 Pr´esident
Hacene Azizi Pr. Universit´e Ferhat Abbas S´etif 1 Directeur de th`ese Habib Zaidi Pr. Hˆopitaux Universitaires Gen`eve, Suisse Examinateur Mohamed Kaddeche Pr. Universit´e Badji Mokhtar, Annaba Examinateur Djamel Eddine. C. Dr.Universit´e Ferhat Abbas S´etif 1 Examinateur Belkhiat
Saadia Benhalouche Dr. Universit´e des Sciences et de la Invit´ee Technologie d’Oran
University Ferhat Abbas Setif 1
Faculty of Sciences, Department of Physics
PhD Thesis
Presented to obtain Doctor degree in Radiation Physics and Biomedical Imaging
Development of a hybrid
approach for the enhancement of
CBCT images for adaptive
radiation therapy
Halima Saadia Kidar
Presented on December 1,2020, in front of the jury:
Faycal Kharfi Pr. Ferhat Abbas Setif 1 University President Hacene Azizi Pr. Ferhat Abbas Setif 1 University Advisor Habib Zaidi Pr. Geneva University Hospital , Switzerland Examiner Mohamed Kaddeche Pr. Badji Mokhtar-Annaba University Examiner Djamel Eddine. C. Dr. Ferhat Abbas Setif 1 University Examiner Belkhiat
Saadia Benhalouche Dr. University of Sciences and Technology Invited Mohamed-Boudiaf of Oran
Undertaking this PhD has been a truly life-changing experience for me and it would not have been possible to do without the support and guidance that I received from many people.
First and foremost, I would like to thank my supervisor Doctor Hacene AZIZI for the patient guidance, encouragement and advices he has provided throughout my time as his student. I greatly appreciate the freedom he has given me to find my own path and the support he offered when needed. Additionally, I would like to thank my committee members Pr. Faycal KHARFI , Pr. Habib ZAIDI , Pr. Mohamed Kaddeche, Dr. Djamel Eddine BELKHIAT , and Dr. Saadia BENHALOUCHE for their interest in my work.
I also express my gratitude to the head of the Dosing, Analysis and Characterization with high resolution (DAC-HR) Laboratory, Professor Faycal KHARFI , for accepting me into his group and supporting my work.
Spacial thanks go to the stuff of the department of radiotherapy (Centre de lutte Contre le Cancer) in Setif, Algeria, for providing the data sets used in this work.
This work would also have been impossible without the help of Miss Wafa BOUKELLOUZ from the department of computer sciences ate Ferhat Abbas Setif University. Thank you so much for your knowledge, skills, time and support.
Finally, I would like to acknowledge friends and family who always supported me. First and foremost, I would thank my father Lakhdar , sisters Khadidja, Fadhila, Naima and Faiza and my brother Mhamed Islem for believing in me and being there for practical support in all those things of life beyond doing a PhD.
Recently, the integration of in-board cone beam computed tomography (CBCT) systems into linear accelerators has provided not only a powerful tool for improving the accuracy of patient positioning but also it makes it possible to adapt the treatment planning with the patient anatomy modifications throughout the entire treatment, known as adaptive radiation therapy (ART). During ART planning, after applying a rigid registration between daily acquired CBCT images and planning CT (pCT) scans and getting information about patients structural changes and internal organs deformations, a repeated acquisition of CT images (repCT) is needed for replanning if the patients anatomical changes are significative. Although repCT images provide the most up-to-date information for a human body with an accurate hounsfield unit (HU) distribution for dose calculation, their repeated acquisition may pose a health concern to patients due to the additional dose. Therefore, the aim of this thesis is to investigate the feasibility of daily CBCT images for dose calculation instead of acquiring repCT images. The main interest is to propose a promising strategy to overcome the limitations related to the high amount of scatter that reduces the quality of CBCT images compared to the pCT.
To this end, we proposed three complementary approaches that allow the correction of the HU distribution in the CBCT images. The first proposed approach is inspired from the fact that the CBCT and the pCT images have not the same gray-level histograms. Therefore, we applied the histogram matching (HM) process to resemble their histograms and offer the possibility to distinguish the different tissue types in the CBCT images. As a second approach, we proposed the application of multilevel threshold (MLT) to improve the correctness of the HU distribution obtained with HM. Finally, in the third approach we proposed the generalization of the previously proposed approaches to contribute in the minimization of the ART workload requirements. The main idea is to include the notion of inter-patient deformable registration in order to investigate the pCT images available in the archive for the correction of CBCT images rather than acquiring new CT images for each patient.
can improve the HU distribution in the CBCT images and generate corrected images in good agreement with the pCT.
Keywords: CBCT correction; deformable registration; histogram matching; multilevel threshold; adaptive radiation therapy.
R´ecemment, l’int´egration des syst`emes de tomodensitom´etrie `a faisceau conique (CBCT) embarqu´es dans les acc´el´erateurs lin´eaires a fourni non seulement un outil puissant pour l’am´elioration de la pr´ecision du positionnement du patient mais il a permis aussi d’adapter la planification du traitement aux modifications de l’anatomie du patient tout au long du traitement, connu sous le nom de radiothrapie adaptative (ART). Pendant la planification du ART, apr`es avoir appliqu´e un recalage rigide entre les images CBCT du jour et les images CT de planification (pCT) et obtenu des informations sur les changements structurels du patient et les d´eformations des organes internes, une acquisition r´ep´et´ee des images CT (repCT) est n´ecessaire pour la replanification si les changements anatomiques sont significatifs. Bien que les images repCT fournissent les informations du jour sur le corps humain avec une distribution prcise des unit´es hounsfield (HU) n´ec´essaires pour le calcul de dose, leur acquisition r´ep´et´ee peut poser un probl`eme de sant´e aux patients `a cause de l’accumulation de dose. Par cons´equent, le but de cette th`ese est d’´etudier la faisabilit´e du calcul de dose bas´e sur des images CBCT au lieu d’acqu´erir les images repCT. L’int´erˆet principal est de proposer une strat´egie pour surmonter les limitations li´ees `a la grande quantit´e du rayonnement diffus´e qui r´eduit la qualit´e des images CBCT par rapport aux images pCT.
`
A cette fin, nous avons propos´e trois approches compl´ementaires qui permettent la correction de la distribution des HU dans les images CBCT. La premi`ere approche propos´ee s’inspire du fait que les images CBCT et pCT n’ont pas les mˆemes histogrammes de niveaux de gris. Par cons´equent, nous avons appliqu´e le processus de correspondance d’histogramme (HM) pour ressembler leurs histogrammes et offrir la possibilit´e de distinguer les diff´erents types de tissus dans les images CBCT. Comme deuxi`eme approche, nous avons propos´e l’application d’un seuillage `a plusieurs niveaux (MLT) pour am´eliorer l’exactitude de la distribution des HU obtenue avec HM. Enfin, dans la troisi`eme approche, nous avons propos´e la g´en´eralisation des approches propos´ees pr´ec´edemment pour contribuer `a la r´eduction des exigences de charge de travail de l’ART. L’id´ee principale est d’inclure la notion du recalage
d´eformable inter-patients afin d’exploiter les images pCT disponibles dans l’archive pour la correction des images CBCT au lieu d’acqu´erir de nouvelles images CT pour chaque patient.
Les r´esultats de l’analyse visuelle et statistique ont montr´e que les approches propos´ees peuvent am´eliorer la distribution des HU dans les images CBCT et g´en´erer des images corrig´ees en bon accord avec les images pCT.
Mots cl´es: Correction des CBCT; recalage d´eformable; correspondance des histogrammes; seuillage `a plusieurs niveaux; radioth´erapie adaptative.
Aknowledgments i Abstract ii R´esum´e iv Contents vi List of publications ix List of Figures x
List of Tables xiv
List of abreviations xv
Introduction 1
1 Clinical and Technical Notions 4
1.1 Introduction . . . 4
1.2 External radiotherapy . . . 4
1.2.1 Workflow of radiotherapy . . . 4
1.2.2 Evolution of radiotherapy techniques . . . 7
1.3 Integration of image registration process . . . 13
1.4 Investigation of CBCT images . . . 17
1.4.1 Acquisition system . . . 17
1.4.2 CBCT image quality . . . 18
1.4.3 Towards ART based on CBCT images . . . 22
1.5 Conclusion . . . 23
2 Literature review 24 2.1 Introduction . . . 24
2.2 Classification of CBCT correction approaches . . . 24
2.2.1 Physics-based approaches . . . 24
2.2.2 Calibration-based approaches . . . 27
2.2.3 pCT-based approaches . . . 29
2.2.4 Deep learning-based approaches . . . 32
2.3 Discussion . . . 32
2.4 Conclusion . . . 35
3 The impact of DR accuracy on CBCT enhancement 37 3.1 Introduction . . . 37
3.2 Data description . . . 37
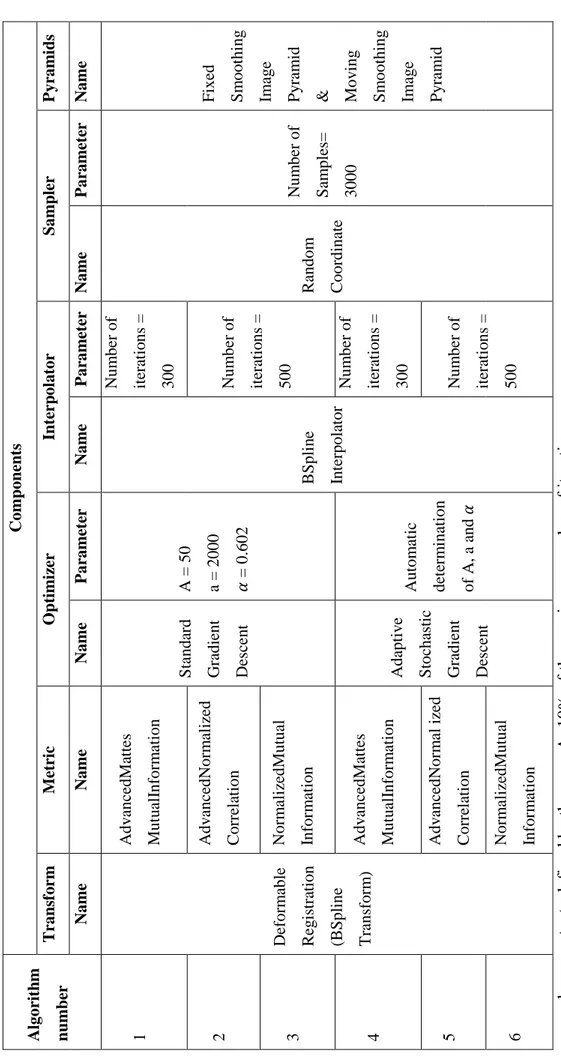
3.3 Evaluation of CT to CBCT deformable registration algorithms . . . 38
3.3.1 Data preprocessing . . . 38
3.3.2 Image registration. . . 38
3.3.3 Evaluation . . . 41
3.3.4 Computation time . . . 41
3.3.5 Results and discussion . . . 41
3.4 Impact of DR on CBCT enhancement. . . 45 3.4.1 Corrected CBCT generation . . . 45 3.4.2 Data analysis . . . 46 3.4.3 Results . . . 46 3.4.4 Discussion . . . 51 3.5 Conclusion . . . 52
4 Optimization of the proposed method 53 4.1 Introduction . . . 53
4.2 Methods . . . 53
4.2.1 Data description . . . 53
4.2.2 Description of the proposed approach . . . 54
4.2.3 Evaluation . . . 56 4.3 Results . . . 57 4.3.1 Visual assessment . . . 57 4.3.2 Profiles comparison . . . 57 4.3.3 Correlation . . . 59 4.3.4 Volumes Comparison . . . 59
4.3.5 Tissue classes comparison . . . 60
4.4 Discussion . . . 60
5 Generalization of the proposed method 63
5.1 Introduction . . . 63
5.2 Methods . . . 63
5.2.1 Description of the proposed approach . . . 63
5.2.2 Evaluation . . . 64 5.3 Results . . . 65 5.3.1 Visual assessment . . . 65 5.3.2 Profiles comparison . . . 66 5.3.3 Volumes Comparison . . . 71 5.3.4 Correlation . . . 71 5.4 Discussion . . . 73 5.5 Conclusion . . . 74
Conclusions and Perspectives 75
Bibliography 77
Appendices 87
The thesis is based on the following papers :
Published papers
• Halima Saadia Kidar, Hacene Azizi and Wafa Boukellouz. Evaluation of CT to CBCT Deformable Registration Algorithms for Adaptive Radiation Therapy. Proceeding of Engineering and Technology. 33:40-44, 2017.
• Halima Saadia Kidar and Hacene Azizi. Assessing the impact of choosing different deformable registration algorithms on Cone-Beam CT enhancement by histogram matching. Radiation Oncology, 13(1):217, 2018.
• Halima Saadia Kidar and Hacene Azizi. Enhancement of Hounsfield unit distribution in cone-beam CT images for adaptive radiation therapy: Evaluation of a hybrid correction approach. Physica Medica, 69:269-274, 2020.
Unpublished papers
• Halima Saadia Kidar, Hadjer Saadallah and Hacene Azizi. Generalization of a hybrid approach for the correction of cone beam CT images using an inter-patient image registration.
“Accepted for publication in the proceeding of the First International Conference on Communications, Control Systems and Signal Processing (CCSSP 2020).”
1.1 The workflow of external radiotherapy. . . 5
1.2 Graphical representation of the volumes of interest, as defined in ICRU reports 50 and 62 [16]. . . 6
1.3 Example of treatment plan evaluation for prostate cancer by the verification of the isodose distribution (a) and the dose-volume histograms (b) [19]. . . 7
1.4 Comparison of the principals of 3D-CRT and IMRT. In (a), the use of uniform fields yields a convex dose distribution that include the OARs; while in (b), the combination of multiple beams produces the desired dose coverage of the target volume and sufficient sparing of OARs [21]. 8 1.5 Principal of VMAT. The moving source rotates along a circle indicated by the outermost circle in the diagram. The green and blue rectangles represent the position of the leaves at each gantry angle. The next circle shows the segment weighting plotted as a grey rectangle of varying height and intensity which both vary in proportion to the segment weighting. The next circle in represents the reconstructed maps from re-sorted parallel rays shown with the associated parallel rays. It can be seen that these re-sorted rays have an intensity modulation. [24]. . . 9
1.6 Process of image-guided adaptive radiotherapy [29]. . . 11
1.7 Basic components of an image registration framework [38]. . . 14
1.8 Illustration of a linac-mounted kV-CBCT system. . . 17
1.9 Schematic representation of the conventional, fan-beam geometry and the cone-beam geometry [17]. . . 18
1.10 pCT and CBCT for the same patient (axial, coronal and sagital views) displayed using the same window level. . . 18
1.11 CBCT image of a homogeneous phantom which displays the cupping artefact commonly found in CBCT imaging. The central part of the phantom appears to be less dense than the rest of the phantom, and this effect is a combined result of scattered photons and beam hardening [47]. 19
1.12 CBCT image of a homogeneous phantom with dense implements. Typical thin lines tangent to the sharp edges appear in the direction of the beam [48]. . . 20
1.13 Example of CBCT image displaying the radar artefact as a bright circular line extending from the patient surface inside the patients body. Similar effects can be observed around bony anatomy in other CBCT acquisitions [47]. . . 20
1.14 One source of undersampling resulting in aliasing errors in CBCT is the cone divergence itself. Obviously, the slice A of the volume nearest to the source collects many more rays per voxel (as measured on the detector pixels, p) than slice B, which is closest to the detector. The number of rays per voxel linearly decreases with the distance of the slice from the source [50]. . . 21
1.15 Typical aliasing patterns in CBCT data sets. The lines (arrows) diverge from the centre towards the periphery and are most probably caused by the undersampling owing to the cone beam geometry. . . 21
1.16 Example of CBCT image of a homogeneous phantom displaying ring artefacts (arrow) centred around the location of the axis of rotation. As with many other artefacts, they are most clearly visible in axial slices, i.e. in beam direction[50]. . . 22
1.17 Example of a typical double contours (arrows) induced by patient movement during the acquisition process of the projection images. . . . 22
2.1 Conceptual chart of histogram-matching algorithm [70]. . . 30
3.1 A slice of CBCT images (a), planning CT images (b) and the results of their superimposition before alignment (c) and after alignment (d) with rigid registration. . . 42
3.2 Results of superimposition of CBCT and deformed pCT images after using six DR algorithms based on (a) GD and MI (b) GD and NCC (c) GD and NMI (d) ASGD and MI (e) ASGD and NCC (f) ASGD and NMI. 42
3.3 Comparison of MSD values between CBCT and deformed pCT images with and without couches for two patients using the different algorithms. 43
3.4 Comparison of the NCC values between CBCT and deformed CT images with and without couches for the two patients using the different algorithms. . . 44
3.6 Absolute difference between deformed pCT and CBCT in the first row and corrected CBCT in the second row using one RR and three DR algorithms. Blue colors represent low discrepancies while red colors represent the highest ones. . . 47
3.7 MAE values of CBCT images before and after correction using a) RR-MI, b) DR-NCC, c) DR-MI and d) DR-NMI. . . 49
3.8 MAE values of CBCT images for each algorithm before HM (a) and after HM (b). . . 49
4.1 Pipeline of the CBCT enhancement process. . . 55
4.2 A pCT slice with four lines describing the directions of the extracted profiles. . . 56
4.3 Absolute difference between the HU values of the deformed pCT and CBCT images (a) before correction, (b) after using only HM and (c) after using HM+MLT correction. . . 57
4.4 HU comparison between deformed pCT and CBCT images (a-d) before any correction and (e-h) after HM+MLT correction along the four lines describing the directions of the extracted profiles shown in Figure 4.2. . 58
4.5 Correlation values between deformed pCT, uncorrected CBCT, CBCTHM and CBCTHM-MLT for each patient.. . . 59
4.6 MAE between deformed pCT, uncorrected CBCT, CBCTHM and
CBCTHM-MLT. . . 61
5.1 Generation of corrected CBCT images pipeline. Example of correcting the CBCT images of the first patient from the pCT images obtained for the remaining patients. . . 64
5.2 Absolute difference between deformed pCT and CBCT for five patients before correction and after correction using pCT images obtained for 6 other patients. . . 65
5.3 Comparison of Hounsfield Units between deformed pCT and CBCT images of the first patient before correction and after correction from the pCT of different patients along the first line. . . 67
5.4 Comparison of Hounsfield Units between deformed pCT and CBCT images of the first patient before correction and after correction from the pCT of different patients along the second line. . . 68
5.5 Comparison of Hounsfield Units between deformed pCT and CBCT images of the first patient before correction and after correction from the pCT of different patients along the third line. . . 69
5.6 Comparison of Hounsfield Units between deformed pCT and CBCT images of the first patient before correction and after correction from the pCT of different patients along the forth line. . . 70
5.7 Correlation values between deformed pCT, uncorrected CBCT and CBCT after correction for each patient. . . 72
A.1 Absolute difference between deformed pCT and CBCT for six patients before correction and after correction using pCT images obtained for 6 other patients. . . 89
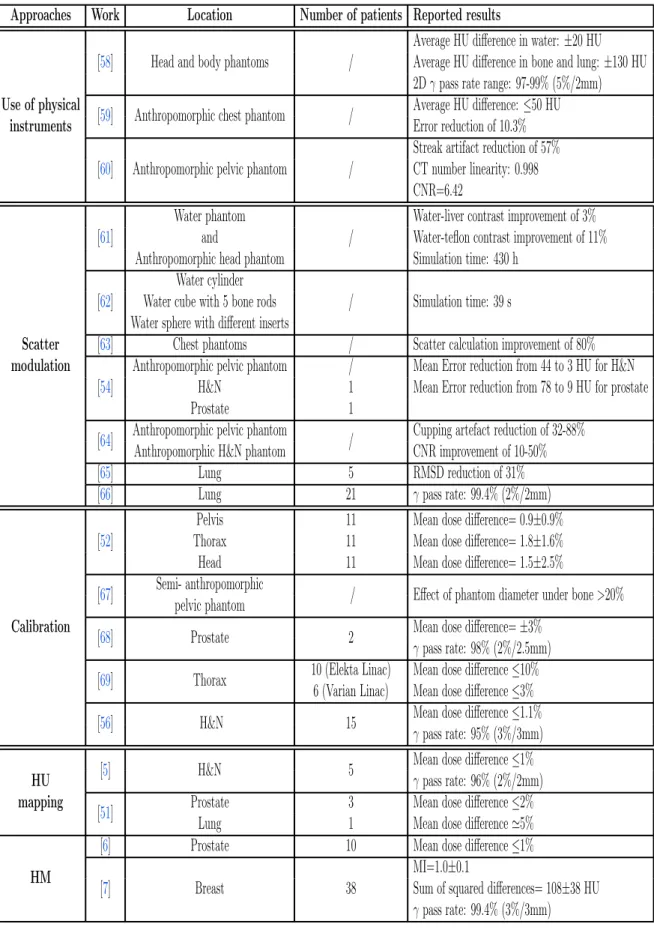
2.1 Summary of the different approaches used for the correction of CBCT images. . . 33
3.1 Acquisition settings of pCT and CBCT images. . . 38
3.2 Summery of study algorithms with their different components and parameters. . . 40
3.3 Comparison of the computation time of the different algorithms using images with and without couches. . . 44
3.4 HU average error values between deformed pCT and CBCT before and after HM for each patient with the mean and the standard deviation. . 48
3.5 Comparison of the mean pixel values in fat and muscle between the pCT, CBCT and corrected CBCT images with the three different DR algorithms. . . 50
4.1 HU range and peak value of different tissue types present in pCT and CBCT images after HM. The ranges of soft bone and bone were divided into two sub-ranges, each replaced by a peak value, to take into account low and high HU values that represent each tissue. . . 56
4.2 RMSD between the HU values of the deformed pCT, CBCT, CBCTHM
and CBCTHM-MLT images for each patient with the mean and the
standard deviation. . . 60
5.1 HU average error values between deformed pCT and CBCT images before and after correction for each patient. In bold, the mean and the standard deviation. Values in red represent the HU error when correcting CBCT images from the pCT corresponding to the same patient with the percentage of change. . . 71
2D two-dimensional 3D three-dimensional
3D-CRT 3-dimensional conformal radiotherapy ART adaptive radiotherapy
ASGD adaptive stochastic gradient descent CC correlation coefficient
CNR contrast to noise ratio CT computed tomography CTV clinical target volume Dmin minimum dose
Dmax maximum dose
Dmean mean dose
DCNN deep convolutional neural network DIR deformable image registration DL deep learning
DOFs degrees of freedom DVHs dose-volume histograms ED electron density
FOV field of view GD gradient descent
GAN generative adversarial network GTV gross tumor volume
H&N head and neck
HM histogram matching
HU hounsfield unit
ICRU International Commission on Radiation Units and Measurement IGRT image guided radiotherapy
IMRT intensity modulated radiotherapy
ITK insight segmentation and registration toolkit ITV internal target volume
kV-CBCT kilovoltage cone-beam CT Linac linear accelerator
MAE mean absolute error
MC Monte Carlo
MI mutual information
MLC multileaf collimator MLT multilevel threshold
MRI magnetic resonance imaging MSD mean squared difference
MU monitor unit
MV-CBCT megavoltage cone-beam CT NCC normalized correlation coefficient NMI normalized mutual information OARs organs at risk
pCT planning computed tomography PET positron emission tomography PTV planning target volume
repCT replanning computed tomography RMSD root mean squared difference ROIs regions of interest
RR rigid registration RT radiotherapy SD standard deviation
VMAT volumetric modulated arc therapy VOIs volumes of interest
Recently, the growing use of modern imaging modalities in radiotherapy (RT) has allowed a better medical care for cancer patients under the treatment machine. Thanks to the integration of in-room imaging systems as the cone beam computed tomography (CBCT), the verification and the correction of the patient’s setup during the course of treatment in three dimensions with sufficient soft tissue contrast and low patient dose become possible. Moreover, the development of CBCT systems in terms of images acquisition, rapidity and improved image quality has allowed the appearance of more sophisticated treatment techniques as adaptive radiation therapy (ART). This technique aims to adapt the treatment planning with patient anatomy modification throughout the entire treatment; it is mainly based on three complex and consuming time processes: acquisition of daily CBCT images for making decision if the re-planning is necessary by comparing them to the CT images, the second process deals with the acquisition of new planning CT (pCT) images and the delineation of volumes of interest to provide a base for the last process which is the dose re-calculation.
The development of such treatment techniques has offered a huge place to integrate the medical image processing field in clinical routine. With its various processes, this field has enabled the improvement of delivered treatment in terms of precision and execution time. Deformable registration (DR) process could be considered as the most used in ART because it highlighted the importance of investigating different imaging modalities as CBCT images to quantify organs deformation [1], propagate contours [2] or calculate the dose accumulation [3], all by deforming the pCT to the CBCT images. Nowadays, another application of DR aiming to generate from the daily CBCT images a basis for dose calculation without the need to acquire new pCT images and keep the dose to the patient as low as possible has been carried out. Yet, the use of CBCT images for such application is a challenge due to the high amount of scatter that reduces their quality and causes a lack of CT number, called also Hounsfield units (HU), accuracy compared to the pCT images [4]. Therefore, many approaches for the correction of CBCT images, either by the combination of DR with medical image processing methods or by direct correction approaches, can be found in literature.
In DR-based approaches, the main idea is to apply a medical image processing methods as the HU mapping [5], multilevel threshold [6], histogram matching [7], creation of shading map [8] or the use of deep learning [9] after deforming the pCT to the CBCT images in order to transfer the HU distribution to the CBCT images. Direct approaches have also been employed to correct CBCT images; they can be classified into three approaches: the first one, which is the most obvious, is the use of physical scatter rejection techniques as anti-scatter grids [10] or bow-tie filters during the data acquisition. The second approach is the scatter correction based on Monte Carlo modeling of the imaging system [11] and the last approach is the calibration of CBCT systems using phantoms [12].
Most of these studies converge to the use of DR-based approaches due to their efficiency and rapidity compared to the integration of hardware or the use of simulation. Therefore, to justify this choice, this thesis aims first to review the different methods existing in the literature and determine their points of strength and weakness. Then, based on the results of comparison, it proposes a new approach for the correction of HU distribution in the CBCT images.
Thesis outline
The thesis is divided into five chapters, the first two ones present the basic clinical and technical notions required for the comprehension of the different techniques cited in this work. The remaining three chapters present the main contributions for the generation of corrected CBCT images.
Each chapter can be described as follows:
Chapter 1
presents the main concepts frequently used in the clinical routine ofradiotherapy. It also presents the evolution of RT techniques with emphasis on the reasons behind the integration of CBCT imaging and image registration in the RT domain, particularly, the ART. Finally, it discusses the limitations of treatment by this latter and explains how research is being oriented towards the generation of corrected CBCT images for dose calculation in ART;
Chapter 2
reviews the different CBCT correction approaches available in literatureand compares the results of their application on several cases. It also discusses the advantages and limitations of each approach. Finally, it proves the choice of the used approach in this thesis;
Chapter 3
presents two contributions, the first is a preliminary work consisting of the evaluation of different CT to CBCT registration algorithms in terms of their accuracy and computation time. In the second contribution, the proposed correction approach is presented and based on the results of the performed tests, the impact of the chosen algorithms on the correction accuracy is assessed;Chapter 4
focuses on the optimization of the previously proposed approach byhybridizing it with another one. The new developed approach is referred to as hybrid, because it applies consecutively two correction approaches and attempts to improve the HU distribution in the CBCT images obtained from the previously used method.
Chapter 5
presents the fourth contribution that aims to generalize the use of thehybrid approach in order to minimize the workload requirements in ART. The main idea is to include the notion of inter-patient image registration that allows investigating the CT scans already available in the archive for the correction of CBCT images rather than acquiring new CT images for each patient.
Clinical and Technical Notions
1.1
Introduction
Radiotherapy (RT), also known as radiation therapy, is a field that has rapidly advanced over the last three decades, thanks to the breakthrough of multi-modal imaging systems and the development of computer technology and treatment machines. These technological advances has allowed to treat very complicated target volumes while sparing the adjacent normal structures. In this chapter we started by describing the standard workflow of RT, introducing the main concepts frequently used in clinical routine. Then, we discussed the evolution of RT techniques focusing on the reasons behind the integration of modern imaging modalities and image processing tools. Finally, we focused on the latest treatment technique, its limitations and the main proposed solutions that aim to increase its performance.
1.2
External radiotherapy
External radiotherapy is a treatment technique that aims to destroy cancer cells using high-energy ionizing radiation produced by an external source. Depending on the tumor type, its location, size and stage, it can be curative, palliative or symptomatic. Curative radiotherapy is the most common and its main purpose is to sterilize the tumor and preserve as possible the surrounding normal critical structures known as organs at risk (OARs).
1.2.1
Workflow of radiotherapy
Generally, the workflow of external radiotherapy goes through different complex processes starting from the data acquisition to the treatment delivery as illustrated
Figure 1.1: The workflow of external radiotherapy.
inFigure 1.1. Each part of the workflow can be described as follows:
1.2.1.1 CT scans acquisition
The 3D planning begins with the acquisition of CT scans, called planning CT (pCT), for the patient in the treatment position. Numerous immobilization devices could be used to help duplicate the same position throughout the treatment course.
1.2.1.2 Definition of target volumes and OAR
From the acquired CT scans, radiation oncologists define target volumes and OAR according to a comprehensive guidelines provided by the International Commission on Radiation Units and Measurement reports 50, 62 and 83 [13, 14,15].
For the target volume delineation, several concentric volumes are described (Figure 1.2). First, the extent of malignant cells, including any involved nodes, is called the gross tumor volume (GTV). Next, a margin arround the GTV is added to account for potential local-regional subclinical extension, and is called the clinical target volume (CTV). The GTV and CTV are based only on anatomic and biological considerations. Another volume, called the internal target volume (ITV), taking into account variation in the position, shape and the size of the CTV was lately defined [14]. The final volume is the planning target volume (PTV). This volumetric expansion
Figure 1.2: Graphical representation of the volumes of interest, as defined in ICRU reports 50 and 62 [16].
takes into account the uncertainties of the CTV position from day-to-day, the patient movement (e.g., breathing), and differences in the patient positioning.
For the OAR delineation, all normal tissues surrounding the tumor and may receive a significant dose from the treatment plan are taken in consideration [17,18].
1.2.1.3 Treatment planning
Once the geometrical information concerning the shapes of the volumes of interest (VOIs) is complete, medical physicists determine the beams arrangement (number of beams, weights, shapes, orientations, energies, use of beams modifiers,...) that allows the generation of acceptable treatment plan respecting the dose prescription provided by the radiation oncologist. The dose calculation is performed according to the ICRU guidelines and it should be normalized at the center of PTV to 100% with the dose elsewhere within the PTV being in the range 100 ± 5%.
The acceptance of the treatment plan is based on qualitative and quantitative evaluation of the dose distribution; the qualitative evaluation consists of integrating the dose distribution in two or three-dimensional (2D, 3D) patient model (Figure 1.3.a), presented in the observer’s view, which gives a fast impression about the global dose distribution. It should be ensured that the target volume is covered by the 95% isodose line. For the quantitative evaluation the dose-volume histograms (DVHs) present a powerful parameter that enables getting a precise information about the percentage of dose received by a particular volume (Figure 1.3.b). 95% of the PTV should receive at least 95% of the prescribed dose while for the OARs a set of tolerances should be respected.
Another statistical parameters as the minimum, maximum and the mean dose (Dmin,
Figure 1.3: Example of treatment plan evaluation for prostate cancer by the verification of the isodose distribution (a) and the dose-volume histograms (b) [19].
1.2.1.4 Dose delivery
This process aims to correctly transfer the planned irradiation technique to the patient. So that, it is critically important to position the target volume under the treatment machine as during the acquisition of CT scans. First, the skin marks made at the simulation session are aligned to the room-mounted positioning lasers. Then, the in-room imaging systems are used to verify the position of the target volume and the OARs.
1.2.2
Evolution of radiotherapy techniques
In the past two decades, the use of modern imaging modalities, efficient 3D treatment planning systems and developed treatment machines has allowed the appearance of more sophisticated treatment techniques such as the 3D conformal radiotherapy (3D CRT), intensity modulated radiotherapy (IMRT), volumetric modulated arc therapy (VMAT), image guided radiotherapy (IGRT) and adaptive radiotherapy (ART). The application of these techniques in clinical practice is based on the standard workflow described in the section 1.2.1; however, some significant differences exist, particularly in the treatment planning and dose delivery processes. This section focuses on the description of the evolution of radiotherapy from the 3D CRT to the ART by explaining in details the contribution of each technique to improve the dose targeting to the tumor and spare the normal tissues.
1.2.2.1 3D Conformal radiation therapy
3D-CRT is a technique where the beams of radiation used in treatment are shaped to match the tumor [20]. In its beginning, the beam shaping was performed with
metal blocks, called “cerrobend” blocks, which allowed to introduce fields with irregular shapes and conform the dose distribution closely to the tumor. Individual realization of these blocks turned out to be time-consuming and expensive; therefore, great progress in 3D CRT was achieved by the development and the integration of computer-controlled multileaf collimator (MLC) in the linear accelerators (Linac).
With this technology, the delivery of dose distribution with high conformity became possible; however, conformal and homogeneous dose distribution can not be obtained in all cases. This is particularly true for complex-shaped target volumes, especially, the concave-shaped ones that remained a challenging task.
1.2.2.2 Intensity modulated radiation therapy
To tackle the problem of complex-shaped target volumes, intensity modulated radiation therapy was introduced into clinical use. As its name implies, this technique allows the modulation of the intensity or fluence of multiple radiation beams incident from different directions, so that each beam delivers intentionally non-uniform dose to the target. The superimposition of such beams results in more conformal dose distribution and allows for lower doses to OARs as seen inFigure 1.4 [20, 21].
Compared to the 3D-CRT where the number, position, shape and intensity of used beams are configured manually; the IMRT is based on inverse planning concept that begins the treatment planning with the ideal dose prescription and ends with the IMRT radiation beams providing more degree of freedom to optimize the plan [22].
Despite the clear benefits of IMRT in terms dose escalation and normal tissue
Figure 1.4: Comparison of the principals of 3D-CRT and IMRT. In (a), the use of uniform fields yields a convex dose distribution that include the OARs; while in (b), the combination of multiple beams produces the desired dose coverage of the target volume and sufficient sparing of OARs [21].
sparing, there are some limitations. First, the use of multiple gantry angles, fixed fields and differential beam intensity increases the treatment delivery time which may impact patient reproducibility and increase intrafraction organ motion variability. Second, the use of IMRT is an increase in low dose radiation to non-target tissue (i.e., integral dose) due to higher monitor unit (MU) requirements for IMRT delivery and increased number of beams which raises some concern regarding the risk of secondary radiation-induced cancer. Finally, all uncertainties related to daily inter-fraction positioning, displacement and distortions of internal anatomy and intra-fraction motion of tumors and normal tissues during the course of treatment, may also limit the applicability and efficiency of IMRT.
1.2.2.3 Volumetric modulated arc therapy
Arc therapy has emerged as a technique to address some of the limitations of fixed fields treatments. In contrast to fixed field IMRT, arc therapy incorporates rotation of the Linac gantry while the beam is on [23]. In most cases the patient is treated from all angles in one or more 360-degree rotations (Figure 1.5).
The major conceptual advantage of VMAT over standard IMRT is that since the
Figure 1.5: Principal of VMAT. The moving source rotates along a circle indicated by the outermost circle in the diagram. The green and blue rectangles represent the position of the leaves at each gantry angle. The next circle shows the segment weighting plotted as a grey rectangle of varying height and intensity which both vary in proportion to the segment weighting. The next circle in represents the reconstructed maps from re-sorted parallel rays shown with the associated parallel rays. It can be seen that these re-sorted rays have an intensity modulation. [24].
rotation of the source is performed around the patient, all angles are available to deliver radiation to the target volume while avoiding normal tissues, and time is used efficiently because the radiation delivery does not stop in between different angles. Furthermore, the decreased monitor unit required for this technique can result in a lower dose to normal tissues.
1.2.2.4 Image guided radiation therapy
As mentioned previously, internal organs motion, patient’s shapes changes and patient’s setup errors may limit the efficiency of IMRT or VMAT and result in under-dosage of target volume or over-dosage of OARs. Therefore, optimal treatment delivery relies on accurate image guidance.
Usually, image guidance refers to the use of different imaging systems in order to detect and correct random and systematic errors that occur before or during the treatment delivery. Several imaging modalities such as kilovoltage cone-beam CT (kV-CBCT), megavoltage cone-beam CT (MV-CBCT), magnetic resonance imaging (MRI) and positron emission tomography (PET) can be used to acquire information on the patient’s body position or the position of the target organs, including bone structures, soft tissues, or a tumor itself [21, 25, 26].
With these modalities, the image guidance intervention in the workflow of radiotherapy appears in three main levels that could be summarized as follows:
• Image guidance for delineation: CT scans are the standard imaging modality in radiation treatment planning since it combines high geometrical accuracy with a measure of electron density which enables dose calculations. However, in comparison with MRI, the quality of CT scans is inferior in the detailed definition of soft tissues, particularly, microscopic tumor extensions. Therefore, coupling MRI with CT scans should be applied for an accurate delineation of volumes of interest. Furthermore, the use of biological imaging as PET provides additional information about the proliferating areas of the tumor and allows differentiating areas of biological importance within the boundaries of target volumes [27]. • Image guidance for patient’s setup: In-room imaging systems as the
MV-CBCT and kV-CBCT are currently used to refine the patient’s position under the treatment machine and control the evolution and the localization of the target volume during the treatment. Both of these modalities provide volumetric images in single revolution of the gantry using the megavoltage treatment source for the MV-CBCT and kilovoltage source for the kV-CBCT.
dose exposure, but also high quality of kV-CBCT images which allows reduced observer variability and consequently better reproducibility of the desired position [28].
• Image guidance for treatment verification: Online volumetric pre-treatment imaging, as kV-CBCT, serves as an ideal method for target verification at the time of treatment due to its ability to describe anatomical distribution with high contrast. Based on geometrical measures, it allows estimating tumor regression throughout the treatment. Currently, PET scans are also taken to estimate the degree of tumor response [21].
1.2.2.5 Adaptive radiation therapy
Although IGRT gives clinicians the possibility of better patient’s positioning during the treatment by aligning the beam with the target before radiation, a simple repositioning is insufficient to correct shape variations in target or nearby critical structures. The more complex correction is usually performed by replanning: a process called ART, which includes the modification of initial plan to adapt to changes in target volume or OARs. As shown in Figure 1.6, the ART process goes through four complex and time consuming steps: (1) initial planning, (2) image guidance for patient’s setup, (3) repeated imaging and adaptive planning and (4) treatment delivery. In theory, these steps can occur in clinical routine on three time scales:
• Offline adaptation. The plan is re-optimized between fractions in case of
clinically significant variations in the patient’s anatomy (weight loss, tumor shrinkage,...)[30, 31].
• Online adaptation. In this case, the re-optimization is applied just before irradiation. In-room imaging are often used to detect and correct systematic and random errors [32, 33,34].
• Real time adaptation. The plan is re-optimized during irradiation by adapting the beam according to the target position (tracking) [35, 36] or by interrupting the irradiation when the target moves outside the planned area (gating) [37]. To date, the implementation of online strategies in clinical practice is challenging because patients must remain immobilized on the treatment couch while waiting for ART correction. Moreover, these strategies could provide greater treatment precision but at the cost of substantial increase in physician and stuff effort and treatment time. Several researches have converged to the full automation of the ART workflow in order to reduce the workload requirements for online ART. The main focus was attributed to the image guidance and the replanning steps. Since IGRT is mainly based on the comparison of the information provided by the daily acquired images, usually kV-CBCT, and the initial pCT images, the notion of automatic image registration process has been appeared. In addition, as the replanning process requires the need for new pCT images acquisition which may pose a health concern to patients, the idea of investigating the daily kV-CBCT images not only for guidance but also for treatment planning have seen a special interest.
In the two following sections, the role of image registration and daily kV-CBCT images as base for treatment planning in ART and its limitations are described in details.
1.3
Integration of image registration process
Notations
IF Fixed image IM Moving image IF Average intensity of IF IM Average intensity of IM xi Voxel number iN Total number of voxels in an image T Transform
µ Registration parameters b
µ Registration results ζ Cost function
H(A) = −R pA(a) log pA(a)da Entropy of a random variable
H(A, B) = −R pAB(a, b) log pAB(a, b)dadb Joint entropy of two variables
pA(a), pB(b) Marginal discrete probabilities
Image registration plays a central role in various stages of image guidance in ART. It is a process of establishing spatial correspondences across two images of the same scene (in medical image registration: the same anatomical region) acquired at different times by the same or different imaging modalities to obtain a complete information [29]. The purpose is to determine a geometric transformation (translation, rotation or deformation) that maps points from one image (moving image) to their homologous points in another image (fixed image). In this way, images can be combined and fused on a voxel-by-voxel basis and differences between anatomical structures can be quantified for image guidance and follow up [21].
The general image registration process can be illustrated in Figure 1.7. In this process, the registration is considered as an optimization problem which has to be solved throughout the minimization of a cost function using an iterative way. Commonly, this problem is formulated as follows:
b
µ = arg min
µ ζ (µ; IF, IM) (1.1)
From the Figure 1.7 and Equation 1.1 several components can be recognized:
Moving image: is the image which will be deformed to correspond to the fixed image;
Figure 1.7: Basic components of an image registration framework [38].
to the moving image;
Similarity measure: is, by definition, the metric that quantifies the degree to which a pair of imaging studies are aligned (or mis-aligned). Using standard optimization techniques the transformation parameters are manipulated until this metric is minimized (or maximized). Most registration metrics in use presently can be classified as either geometry-based or intensity-based. Geometry-based metrics make use of features extracted from the image data such as anatomic or artificial landmarks (points) and organ boundaries (contours or surfaces). However, the definition of such features requires the use of accurate segmentation techniques. Intensity-based (voxel-based) metrics use the numerical gray-scale information directly to measure how well two images are registered. Several mathematical formulations are used to measure this similarity; four of the most common are described below:
1. Mean Squared Difference (MSD): is a simple and easy-to-apply metric. It is computed as the average squared intensity difference between the fixed and the moving images. Its formula is given by:
M SD(IF, IM) = 1 N N X i=1 (IF(xi) − IM(xi))2 (1.2)
This metric is effective for registering two images have essentially identical intensities (Mono-modal images)[39, 40].
2. Normalized Correlation Coefficient (NCC): is one of the common used metrics. it determines a linear relation between the fixed and the moving images. It can be formulated as follow:
N CC = − PN i=1(IF(xi) − IF)(IM(xi) − IM) q PN i=1(IF(xi) − IF)2 PN i=1(IM(xi) − IM)2 (1.3)
This metric is more complex, but offers greater flexibility, as it can be applied to multi-modal images[41, 42].
3. Mutual Information (MI): as the name implies, this metric is based on the information content of the fixed and the moving images and is computed directly from the probability distribution of these images intensities. It is given by:
M I(IF, IM) = H(IF) + H(IM) − H(IF, IM) (1.4)
This method is more complex than either MSD or NCC, but offers even more flexibility and is often the metric of choice for multi-modal images[43, 44]. 4. Normalized Mutual Information (NMI): is a normalized version of the MI
and it is given by:
N M I(IF, IM) = 1 + M I(IF, IM) H(IF, IM) = H(IF) + H(IM) H(IF, IM) (1.5) Transform: the fundamental task of image registration is to find the geometric transformation, T, that maps the coordinates of a point in the moving image to the coordinates of the corresponding point in the fixed image. In general, a number of parameters (often referred to as degrees of freedom (DOFs)) is required to determine the transformation [45]. This number depends on the form of T, which in turn depends on the clinical site, clinical application and the modalities involved. According to its degree of freedom, transformations are categorized into three types:
1. Rigid transform: a rigid registration (RR) allows to treat the image as a rigid body, which can translate and rotate. It can be described by the following formula:
Tµ(x) = R(x − c) + t + c (1.6)
With R a rotation matrix, c the center of rotation and t the translation.
2. Affine transform: affine transformation can be seen as the extension of rigid transformation. It is composed of rotations, translations, scaling, and shearing. Its formula is given by:
Where the matrix A has no restrictions.
3. Deformable transform: a deformable image registration (DIR) is often used in sites where rigid or affine transformations are not powerful enough to achieve acceptable alignment of anatomical structures. One class of deformation model is called B-spline, which is a curve that interpolates points in space based on a set of control points. A set of parameters associated with each control point defines the exact shape of this interpolation. The number and location of control points determine the extent of deformation that a spline can express. The formula describing this deformation is given by:
Tµ = x + X xk∈Nx pkβ3( x − xk σ ) (1.8)
With xk the control points, β3(x) the cubic multidimensional B-spline control
points spacing and Nx the set of all control points within the compact support
of the B-spline at x.
Interpolator: during optimization an interpolator is used to evaluate intensity at non-voxel positions. Different interpolation methods including nearest neighbor, linear and Nth Order B-Spline interpolators exist. The most used one is The Nth Order
B-Spline Interpolator; for which the higher the order the better the quality.
Optimizer: an optimizer is the element that aims to find the optimal metric value giving the most accurate alignment. Gradient descent (GD) is the most common one and it is defined as follows:
µk+1= µk− akg(µk) (1.9)
with g(µk) = ∂ζ/∂µ, the gradient at the position µk and ak =
a
(k + A)α the decaying
function where: a > 0, A ≥ 1 and 0 ≤ α ≤ 1 are user defined constants.
There is also a more advanced version of the standard GD called the adaptive stochastic gradient descent (ASGD); it allows an automatic calculation of the parameters a, A and α and tends to be more robust.
Samplers: an image sampler defines the way to select a subset of voxels for the metric calculation. It should be assumed that the loop covers all voxels in the fixed image. The subset can be selected in different ways: random, on a grid,... etc.
Pyramid: a pyramid allows starting the registration from images with low complexity (smoothed or down-sampled) to images with high complexity.
Figure 1.8: Illustration of a linac-mounted kV-CBCT system.
1.4
Investigation of CBCT images
As sight previously, significant (non-rigid) changes in the patient’s anatomical structures can be quantified only by treatment guidance based on the comparison of the initial pCT and the daily acquired images. One of the most widely used imaging technique for treatment guidance, being also the one under consideration in this thesis, is CBCT. This section serves to describe this imaging modality in details with emphasis on its imaging quality and its main limitations.
1.4.1
Acquisition system
A CBCT imaging system consists of a kilovoltage (kV) X-ray source and flat panel detector mounted orthogonally to the linear accelerator gantry axis, on the opposite side of the patient with respect to the imaging source (Figure 1.8) [46]. The rotational axes are parallel to the treatment table and pass through the center of the target. When the system rotates, planar projections are recorded from different angles. Then, a 3D image of the patients anatomy is reconstructed from all projections [17].
CBCT has the particularity of using a cone-shaped beam, unlike the CT where the beam is fan-shaped as shown inFigure 1.9. This cone-beam geometry makes it possible to acquire tens of tomographic sections for a single rotation of the CBCT gantry compared to the acquisition of individual consecutive sections with a conventional CT.
Figure 1.9: Schematic representation of the conventional, fan-beam geometry and the cone-beam geometry [17].
1.4.2
CBCT image quality
Although image reconstruction principals of CBCT images is similar to that of pCT images, the CBCT image quality is very different (Figure 1.10). The fact that the patient is imaged using a cone-shaped beam that covers a large section (large field of view(FOV)) increases the amount of detected X-ray scatter resulting in a multitude of artefacts that reduce their quality compared to the pCT images. Here, a brief overview of these different artefacts and their sources is presented.
Figure 1.10: pCT and CBCT for the same patient (axial, coronal and sagital views) displayed using the same window level.
1.4.2.1 Cupping artefacts
Cupping, so called shading, artefacts are the most prominent in CBCT imaging. They come out as an apparent decrease in density towards the center of homogeneous
objects imaged on a CBCT system (Figure 1.11). These artefacts are due to the high scatter conditions found in CBCT imaging, where the large 2D detector panel acquires signal from scattered photons as well as primary photons. Furthermore, differential attenuation of polyenergetic x-ray beams (known as beam hardening) adds to the cupping artefact, although at smaller magnitude than the scattered photons [47].
Figure 1.11: CBCT image of a homogeneous phantom which displays the cupping artefact commonly found in CBCT imaging. The central part of the phantom appears to be less dense than the rest of the phantom, and this effect is a combined result of scattered photons and beam hardening [47].
1.4.2.2 Streaking artefacts
Streaking artefacts, often termed ”missing values artefacts”, are another effect of high scatter condition in CBCT imaging. They appears if the object under study contains highly absorbing material, e.g. bone or prosthetic gold restorations. In this case, the high density material causes an abrupt change in the scatter to primary ratio (SPR), and the soft tissue behind bony anatomy may appear to have a lower density than in other regions of the same image (Figure 1.12).
1.4.2.3 Radar artefacts
Radar artefacts are pronounced, if the CBCT scanning isocenter located near the surface of the human body (Figure 1.13). These artefacts are due to non-instantaneous readout of the 2D flat panel imager used in CBCT imaging for IGRT showing themselves as a bright circular lines extending from the patient surface inside the patients body. Similar effects can be observed around bony anatomy in other CBCT acquisitions.
1.4.2.4 Aliasing artefacts
Aliasing artefacts in CBCT imaging are mainly related to two factors: the size of the detector elements, i.e. the pixel size, and the cone-beam geometry. First, in order
Figure 1.12: CBCT image of a homogeneous phantom with dense implements. Typical thin lines tangent to the sharp edges appear in the direction of the beam [48].
Figure 1.13: Example of CBCT image displaying the radar artefact as a bright circular line extending from the patient surface inside the patients body. Similar effects can be observed around bony anatomy in other CBCT acquisitions [47].
to completely reconstruct a continuous signal, the sampling frequency (represented by the number of pixels per area) must be higher than twice the highest frequency in the signal. Thus, violating this condition may raise the problem of undersampling [49]. Second, owing to the divergent shape of the cone beam, the voxels close to the source will be traversed by more rays than those close to the detector (Figure 1.14). Hence, these artefacts manifests as line patterns commonly diverging towards the periphery of the reconstructed volume (Figure 1.15).
1.4.2.5 Ring artefacts
Ring artefacts are more pronounced when homogeneous media are imaged. Owing to the circular trajectory and the discrete sampling process, these artefacts appear as concentric rings centered around the location of the rotation axis (Figure 1.16). In a
Figure 1.14: One source of undersampling resulting in aliasing errors in CBCT is the cone divergence itself. Obviously, the slice A of the volume nearest to the source collects many more rays per voxel (as measured on the detector pixels, p) than slice B, which is closest to the detector. The number of rays per voxel linearly decreases with the distance of the slice from the source [50].
Figure 1.15: Typical aliasing patterns in CBCT data sets. The lines (arrows) diverge from the centre towards the periphery and are most probably caused by the undersampling owing to the cone beam geometry.
broader sense, ring artefacts could also be allocated to the group of aliasing artefacts.
1.4.2.6 Motion artefacts
CBCT scanners are mounted on the linac gantry that does not rotate more than one revolution per minute. A result of the slow CBCT acquisition following from the gantry rotation speed is that CBCT images are prone to motion artefacts, e.g. patient’s breathing, cardiac motion or intestinal gas. The general problem is quite easy to explain for patient motion artefacts (Figure 1.17). If an object moves during the scanning process, the reconstruction does not account for that move since no information on the movement is integrated in the reconstruction process. Hence, the lines along which the
Figure 1.16: Example of CBCT image of a homogeneous phantom displaying ring artefacts (arrow) centred around the location of the axis of rotation. As with many other artefacts, they are most clearly visible in axial slices, i.e. in beam direction[50].
Figure 1.17: Example of a typical double contours (arrows) induced by patient movement during the acquisition process of the projection images.
backprojection takes place do not correspond to the lines along which the attenuation had been recorded, simply because the object has moved during the acquisition.
1.4.3
Towards ART based on CBCT images
The fact that CBCT images suffer from high amount of artefacts did not limit its use for image guidance alone, but it opened a new research axes looking for the investigation of CBCT images as a basis for treatment adaptation, particularly, as an alternative to the acquisition of new pCT in case of anatomical changes [51, 52].
caused by all of the above mentioned artefacts. Therefore, many studies proposed different techniques to overcome this limitation and ensure suitable HU distribution for an accurate dose calculation. These techniques include: the integration of physical instruments as anti-scatter grids to reduce the impact of scatter on the CBCT reconstruction quality [10, 53], scatter measurement based on the imaging system modeling (simulation) [11,54], calibration of CBCT images using phantoms [12,55,56] and finally the use of image processing techniques that allow correcting the HU distribution in the CBCT images based on that provided by the pCT images [5,6,57]. Most of research converges to the use of image processing techniques due to their efficiency and rapidity compared to the integration of hardware or the use of simulation. These techniques are classified and reviewed in detail in the next chapter with discussion of their main advantages and limitations.
1.5
Conclusion
This chapter presented the technical and clinical notions widely used in the RT domain. The main goal was to provide a basic knowledge to understand the rational behind the choice of the problematic in this thesis. It focused on the description of the evolution of RT from its simplest forms to its more complicated ones which are the ART techniques. Actually, the growing use of in-room imaging, especially CBCT systems, with the integration of image registration tools has highlighted the idea of implementing online ART techniques in the clinical routine. Reaching this goal was associated with the appearance of increasing number of published works proposing the investigation of CBCT images as a base for treatment planning instead of acquiring new pCT images. For deep understanding, the next chapter presents these works and reviews the existing techniques that aims to generate appropriate CBCT images for dose calculation in the context of online ART.
Literature review
2.1
Introduction
Cone-beam CT imaging is now fully integrated in radiation therapy; it can be considered as a powerful tool for improving tumor targeting and dose delivery to normal tissues. However, these images suffer from a reduced contrast due to the increased amount of scatter which limits the use of CBCT images directly for dose calculation [4]. For that reason, several authors proposed promising techniques to enhance the quality of CBCT images. This chapter provides a state of art of CBCT image correction techniques. The main goal is to review briefly the different correction methods available in literature and compare the results of their application for the treatment of several patients by ART.
2.2
Classification of CBCT correction approaches
So far, four types of CBCT correction approaches have been evaluated in literature: physics-based, calibration-based, pCT-based and deep learning-based approaches. Each type is detailed in this section.
2.2.1
Physics-based approaches
2.2.1.1 Use of physical instruments
This technique is the most obvious and it can be defined as the use of anti-scatter grids or beam blockers to prevent the influence of scattered irradiation on the CBCT image quality.
In 2007, L´eterneau et al [58] assessed the impact of post-patient anti-scatter grid in combination with a non linear scatter correction on the CBCT number accuracy.
Testing of the complete process was performed on phantoms with assessment of dosimetric accuracy based on 2D γ-analysis. The results showed that the cupping artefact was reduced from 30% to 4.5%. Also, the CBCT number accuracy was improved in water of about ±20 HU and in bone and lung to within ±130 HU. γ-analysis showed that 97 to 99% of the pixels of radiochromic films agreed with the calculated dose within 5% of dose difference or 2 mm of distance to agreement. However, this technique is limited by the fact that the use of anti-scatter grid can reject some of the scatter but serves also to attenuate the primary beam, which can result in an increase in image noise for the same dose to the patient.
In 2009, Zhu et al [59] proposed the use of another instrument which is the beam blocker usually placed between the source and the imaging object. This instrument has a strip pattern, such that partial volume can still be accurately reconstructed and the whole-field scatter distribution can be estimated from the detected signals in the shadow regions using interpolation or extrapolation. Hence, the estimated scatter may be separated from the CBCT information acquired in an open field without beam blocker. The evaluation results showed that the errors in HU were reduced from about 350 HU to bellow 50 HU when applying this method on Catphan600 phantom, while when using an anthropomorphic phantom, the error was reduced from 15.7% to 5.4%. Despite these findings, the need for two scans to measure scatter and acquire image data with and without beam-blocks is a limiting factor due to the additional dose to the patient.
In 2010, Jin et al [60] proposed the same method as [59] but they acquired the imaging data simultaneously from the grid interspace regions during scatter measurement. They reported that the proposed technique reduced the streak artifact index from 58% to 1% in comparison with the conventional CBCT. It also improved CT number linearity from 0.880 to 0.998 and the contrast-to-noise ratio (CNR) from 4.29 to 6.42. Even though, this technique remains limited by the grid parameters as the septa width that affect the image quality.
2.2.1.2 Simulation of the imaging system
This technique consists of the scatter modulation using simulation methods.
In 2006, Jarry et al [61] used Monte Carlo (MC) simulation to predict scatter distribution in CBCT images. The study was performed on a cylindrical water phantom and an anthropomorphic head phantom and for evaluation purposes contrast and profile measurements were obtained for the scatter corrected and non-corrected images. An improvement of 3% for contrast between solid water and a liver insert and 11% between solid water and a Teflon insert were obtained and a significant reduction in cupping
and streaking artifacts was observed. However, simulation time was about 430 hours which is a significant amount of time.
In 2008, Mainegra-Hing et al [62] developed a new MC simulation code for CBCT scatter computation. They proposed the use of a variance set that allowed increasing the simulation efficiency by a factor of 4000. They also proposed a denoising process for the computed scatter distribution that reduced the simulation time by another factor of 10. Such that the calculations described in [61] would be 39 seconds instead of the 430 hours reported. However, since results reported in their work can be considered only preliminary, extensive benchmarking of the algorithm with real CBCT images, and a better model of the X-ray source and detector array is still needed.
In 2014, Thing et al [63] studied two simulation geometries with two different x-ray sources and variant user input parameters to take into account the impact of the source geometry not addressed in [62]. They reported that optimizing the input parameters to the specific simulation geometry can improve scatter calculation efficiencies by more than 4 orders of magnitude. However, this study was based on lengthy simulation and it is important to realize a few easy ways of reducing the required calculation time.
In 2015, Xu et al [54] proposed a new method for scatter estimation. In contrast to the previously cited works, they measured the scatter from the pCT images instead of scatter-contaminated CBCT images. Then, scatter signals were removed from the CBCT projections and corrected CBCT images was reconstructed. This method was evaluated in numerical simulation, phantom and real patient cases. In the simulation cases, the mean HU errors was reduced from 44 to 3 HU and from 78 to 9 HU in the full-fan and the half-fan cases, respectively. In both the phantom and the patient cases, image artifacts caused by scatter, such as ring artifacts around the bowtie area, were reduced. The limitation of this method is that scatter correction results in increased noise level in the reconstructed images and denoising algorithms are still needed.
In the same year, Bootsma et al [64] novel scatter correction method that uses a sparse number of MC simulations run concurrently with a fitting algorithm. They reported that the fitting function decreases the statistical noise in the MC scatter distribution. Also, The cupping was measured to be reduced by 32%−88% in the simulated head and pelvis phantoms. However, there are still some image artifacts remaining in the corrected images, some of which are related to the under sampling of the projection space and image lag.
In 2016, Thing et al [65] proposed another artefact correction method to tackle the problems related to the image lag, detector scatter, body scatter and beam hardening. In contrast to the previous studies where each factor was studied extensively using different phantoms, they investigated the potential increased image quality when all
artefacts sources are considered together. The study was performed on five lung cancer patients and the obtained results showed that the root mean squared difference between the reconstructed CBCT and the reference CT images was reduced by 31%. Even though, this method did not address the time consuming and difficult contouring on the noisy CBCT images.
In 2017, Thing et al [66] investigated the artefact corrected CBCT images resulted from [65] for dose calculation. They performed the study on 21 lung cancer patients with re-simulation CT images acquired during radiotherapy. For evaluation, dose comparisons were made using γ-analysis. They reported that dose distributions calculated on the artefact corrected CBCT images had a median 2%/2 mm gamma pass rate of 99.4% when compared to the reference rCT. Doses calculated on the clinical CBCT images had a median 2%/2 mm gamma pass rate of 93.1%. However, as sight previously the required time to perform the correction for each patient is not taken into consideration.
2.2.2
Calibration-based approaches
This technique can be defined as the establishment of HU-ED tables for CBCT system referring to the calibration tables of CT scans using different phantoms. The mean CT values in the phantom CBCT datasets are described by the density values of the pCT which are determined based on the relationship between CT values and physical density as specified by the phantom manufactures.
In 2008, Richter et al [52] investigated the feasibility of dose calculation in CBCT images using this correction method. Four different correction strategies to match CT values and ED in CBCT images were analyzed: standard CT HU-ED table without adjustment for CBCT; phantom based HU-D tables; patient group based HU-ED tables (pelvis, thorax, head); and patient specific HU-ED tables. Their results showed a mean difference of 564±377 HU between CT values determined from the pCT and CBCT images. For dose calculation in real patient CBCT images, the largest differences between CT and CBCT were observed for the standard CT HU-D table: differences were 8.0±5.7%, 10.9±6.8% and 14.5±10.4% respectively for pelvis, thorax and head patients. The use of patient and group based HU-D tables resulted in small dose differences between planning CT and CBCT: 0.9±0.9%, 1.8±1.6%, 1.5±2.5% for pelvis, thorax and head patients, respectively. The application of the phantom based HU-ED table was acceptable for the head patients but larger deviations were determined for the pelvis and thorax patient populations. However, this technique showed a dependency to the acquisition parameters and different HU-ED tables were required for each region to overcome this limitation.
![Figure 1.2: Graphical representation of the volumes of interest, as defined in ICRU reports 50 and 62 [16].](https://thumb-eu.123doks.com/thumbv2/123doknet/3407751.98724/26.892.309.612.133.343/figure-graphical-representation-volumes-defined-icru-reports.webp)
![Figure 1.3: Example of treatment plan evaluation for prostate cancer by the verification of the isodose distribution (a) and the dose-volume histograms (b) [19].](https://thumb-eu.123doks.com/thumbv2/123doknet/3407751.98724/27.892.158.754.137.375/figure-example-treatment-evaluation-prostate-verification-distribution-histograms.webp)

![Figure 1.7: Basic components of an image registration framework [38].](https://thumb-eu.123doks.com/thumbv2/123doknet/3407751.98724/34.892.141.774.141.370/figure-basic-components-image-registration-framework.webp)
![Figure 1.9: Schematic representation of the conventional, fan-beam geometry and the cone-beam geometry [17].](https://thumb-eu.123doks.com/thumbv2/123doknet/3407751.98724/38.892.215.699.160.399/figure-schematic-representation-conventional-beam-geometry-cone-geometry.webp)

![Figure 2.1: Conceptual chart of histogram-matching algorithm [70].](https://thumb-eu.123doks.com/thumbv2/123doknet/3407751.98724/50.892.299.621.132.461/figure-conceptual-chart-of-histogram-matching-algorithm.webp)