Bridge Building: Afterschool Activities,
Youth Social Networks, and Community Development
By
Benjamin Forman
B.A. Economics Trinity College, Hartford 1999
Submitted to the Department of Urban Studies and Planning in Partial Fulfillment of the Requirements for the Degree of
Master in City Planning at the
Massachusetts Institute of Technology June 2004
MASSACI-OF
@ Benjamin Forman
JU
All rights reserved
LI
ILIE
The author hereby grants to MIT permission to reproduce and to distribute publicly paper and electronic Copies of this thesis document in whole or in part.
USETTS INSTITUTE TECHNOLOGY
N
21 2004
BRARI ES
ROTCH
Signature of Author:De rtment of Urban Studies and Planning Mm, 9n 2004 Certified by:
V
rinuip L. ClayChancellor and Professwr of lWrban Studies and PlInninn Accepted by:
nln ivi. is r-rencnman Professor of the Practice of City Planning Chair, Master in City Planning Committee
Bridge Building: Afterschool Activities,
Youth Social Networks, and Community Development
By
Benjamin Forman
Submitted to the Department of Urban Studies and Planning in Partial Fulfillment of the Requirements for the Degree of Master in City Planning
ABSTRACT
In recent years, U.S. cities have dramatically increased funding for afterschool activities. These afterschool programs may contribute to community development by expanding social networks, providing new channels for the flow of information and resources to low income neighborhoods. Drawing on research and literature from the fields of sociology, political science and adolescent development, I develop an argument for this hypothesis. The theory is tested using both qualitative data collected from interviews at three case study sites, and quantitative data from surveys distributed to afterschool youth programs in the Boston area. I find that afterschool programs build both bridging and bonding so-cial capital by increasing local and extra-local connections between adolescents and adults, peers, and parents. Policy recommendations designed to increase the social network impact of afterschool programming are provided.
Thesis Supervisor: Philip L. Clay
PREFACE
A few years back I read a Boston Globe editorial about creating a vibrant city for
kids. In the words of the Globe's editorial board, "Boston ought to be a jungle-gym of a city, a great place for children to grow up, full of chances to climb and experiment." How true, I thought to myself. I have always believed that the "Hub" and its institutions should bring together Bostonians, near and far, of all different races and ethnicities, to share in culture and tradition, knowledge and learning. If this were to happen, in an ideal world, social ties would cut through the heart of the city, stretch out beyond the neighborhoods and into the suburbs. Kids of different races would better understand one another, and Greater Boston would be stronger.
Of course, reality does not always conform to the ideal world. I'm an example of
this type of experiment. As a child I traveled in to Boston from a homogenous suburb to sail at a summer program that was theoretically diverse. While there was opportunity for cross-racial-ethnic-socioeconomic contact, it rarely occurred. At the end of the summer,
I went back to my suburban middle school with no more true knowledge of the City and
its people; despite all the subway rides, I wasn't any more culturally competent than my suburban peers.
Today there are even more programs offering integrated activity in Boston. Are these programs just swing-sets, each child moving along on a predetermined path? Or are they truly jungle gyms, geometrically diverse, with opportunities to explore a
ACKNOWLEDGEMENTS
I would like to express my appreciation to Debra McLoughlin, Gretchen
MacKilli-gan and Magali Ruiz of the After-School for All Partnership. Without their thoughts, ideas, and help organizing the survey, this project would not have been possible.
Chris Lynch, Janie Ward Simmons, Rick Weissbourd, Fran Riley, and Joanne Panzini all spent valuable time talking with me about this project at various stages.
I would also like to thank the dedicated staff members at all of the inspiring case
study programs: Susan MacDonald at The Youth Voice Collaborative; Miriam Messinger, Kartika Palar, Lisa Owens and Hector Negron at The City School; and Zachary Lehman, Emily Helm, Paige Brewster, Derry Mason, Ben Gildin and Juan-Carlos Ferrufino at MetroLacrosse.
I am also indebted to the young teens who graciously offered to share their
per-sonal experiences as participants in afterschool programs.
Lastly, I would like to express gratitude to my thesis reader Keith Hampton, who fostered my interest and knowledge in the field of social networks; and my advisor Phillip Clay, who led me to this fascinating research topic and then ushered me along with in-valuable comments, suggestions and advice.
CONTENTS
ABSTRACT ... 2
PREFACE ... 3
ACKNOW LEDGEMENTS ... 4
FIGURES AND TABLES ... 8
INTRODUCTION ... 9 1.1 Research Justification ... 10 1.1.1 Timeliness ... ... ... ... ... 10 1.1.2 Theoretical underpinnings ... 11 1.1.3 Potential ... 12 1.2 Thesis Objectives...12 1.3 Unit of Analysis ... 12
1.5 Organization of the Thesis... 13
CONTEXT ... 15
2.1 Demographics and Neighborhoods ... 15
2.1.1 Demographics ... 16
2.1.2 Neighborhoods ... 16
2.2 School and Afterschool ... 18
2.2.1 School ... 18
2.2.2 Afterschool ... 19
2.3 Boston's Youth Population: Strengths and Needs ... 21
2.3.1 Strengths ... 21
2.3.2 Needs ... 23
2.4 Summary...24
LITERATURE REVIEW ... 25
3.1 Social Networks: An Overview... 25
3.2 Social Networks and Neighborhood Economic Power ... 27
3.2.1 Searching for work ... 29
3.2.2 Long-term economic impact of neighborhood poverty on youth... 31
3.3 Social Networks and Neighborhood Political Power ... 33
3.3.1 Bridging social capital ... 33
3.3.2 Bonding social capital ... 36
3.4 Social Networks and Adolescence ... 38
3.4.1 Ties to peers... 38
3.4.2 Ties to adults ... 40
3.4.3 Forging new ties ... 41
3.5 Summary...42
RESEARCH QUESTIONS AND M ETHODOLOGY ... 44
4.1 Research Questions... 44 4.1.1 Inter-local ties ... 45 4.1.2 Extra-local ties ... 45 4.1.3 Mobilization ... 45 4.1.4 Program structure... 46 4.2 Surveys...46 4.2.1 Survey design... 47
4.2.2 Sampling and data collection ... 48
4.3 Qualitative Field Research ... 49
4.3.1 Case study locations ... 49
4.3.2 Observation ... 50 4.3.3 Interviews ... 50 SURVEY RESULTS ... 51 5.1 The Sample ... 51 5.1.1 Response ... 51 5.1.2 Sample characteristics ... 52 5.1.3 Social networks ... 54
5.2 New Afterschool Ties ... 54
5.2.1 Participation in afterschool programs generates new weak ties...54
5.2.2 W eak ties generated by afterschool programs reach high... 57
5.3 Accessing Afterschool Ties ... 58
5.3.1 Youth use connections to help parents and siblings... 58
5.3.2 Youth use connections to help friends ... 59
5.3.3 Afterschool programs advise students about improving community... 60
5.4 Summary...60
CASE STUDIES ... ... ... 61
6.1 Pre-Existing Adolescent Social Networks ... 61
6.1.1 Pre-existing local ties ... 62
6.1.2 Pre-existing extra-local ties ... 63
6.1.3 Diversity of pre-existing ties ... 66
6.2 The Impact of Afterschool Programs on Adolescent Social Networks...66
6.2.1 New ties between adolescents... 67
6.2.2 New Ties between adolescents and adults...71
6.2.3 Changes to pre-existing ties... 73
6.2.4 Parental ties ... 73
6.3 Information Passed Through New Afterschool Ties... 74
6.3.1 Information exchanged between adults and youth ... 74
6.3.2 Information exchanged between youth and their peers ... 76
6.3.2 Information exchanged between youth and their peers ... 77
6.3.2 Information exchanged between youth and their peers ... 78
6.4 Summary...80
CONCLUSIONS... 82
7.1 Revisiting the Research Questions... 82
7.2 General Themes... 83
7.2.1 Afterschool programs increase positive 'chatter' in youth networks ... 83
7.2.2 Afterschool programs instill collective meaning and identity in youth... 85
7.2.3 Afterschool programs build collective efficacy among adults... 87
7.3 Limitations and Unanswered Questions ... 88
7.3.1 Limitations ... 88
7.3.2 Unanswered questions... 89
POLICY RECOMMENDATIONS ... 90
8.1 Five Focus Areas ... 90
8.1.1 Building diverse programming... 91
8.1.2 Creating bonding and bridging social capital ... 91
8.1.3 Connecting family to programs ... 91
8.1.4 Helping youth spread information to peers ... 92
8.1.5 Keeping alumni networks together ... 92
8.2 Five Technology Concepts ... 93
8.2.2 Virtual Ties... 94 8.2.3 Electronic Networking... 94 8.2.4 Digital Stories ... 95 8.2.5 Community Radio ... 96 REFERENCES ... 97 APPENDIX ... ... ... 106
FIGURES AND TABLES
Figures
Figure 1-1: Types of Social Ties Generated by Afterschool Programs...13
Figure 2-1: Dissimilarity Indices for Boston Youth under Age 18 ... 17
Figure 3-1 Neighborhood Network Diagrams ... 28
Figure 5-1: Distribution of Age and Time in Program Variables ... 53
Figure 5-2: Scatterplot of Afterschool Ties by Years in Program ... 55
Figure 6-1: Information exchanged through weak youth-adult ties...75
Figure 6-2: Information dispersion through youth social networks ... 78
Figure 6-3: Summary of Case Study Findings ... 80
Tables Table 2-1: Boston Youth under Age 18 per Square Mile by Neighborhood...18
Table 2-2: Search Institute's 20 Internal Assets ... 22
Table 3-1: Community Development Benefits of Bonding and Bridging Social Capital..42
Table 5-1: Program Focus Area ... 52
Table 5-2: Racial and Ethnic Composition of Sample vs. Boston's Youth Population .... 53
Table 5-3: Concentration of Boston's Youth in Neighborhoods vs. Sample ... 53
Table 5-4: Linear Regression Models Predicting Number of Afterschool Ties ... 56
Table 5-5: Summary of Position-Generated Variables...57
Table 5-6: Logistic regression predicting likelihood of helping a parent or sibling ... 59
CHAPTER ONE
Introduction
Do afterschool programs contribute to community development by expanding so-cial networks, opening new channels for the flow of information and resources to low in-come neighborhoods? This 'macro-level' question, the focus of my research, demands more attention given the current interest in increasing public support for afterschool pro-gramming. The issue is examined in this thesis by sifting through related studies for relevant insights; and analyzing both qualitative and quantitative data collected from lo-cal afterschool programs. These data show that afterschool programming can achieve community development benefits by strengthening social networks in low income com-munities.
This introductory chapter elaborates further on the timeliness and relevance of the topic to community development practitioners. The chapter also defines some broad objectives for the thesis, and describes how the research is structured to meet these aspirations.
-9-1.1 Research Justification
I rely on three arguments to support the appropriateness of this thesis. The first
is timeliness: In the last few years, investment in afterschool programming has become a national priority. The second is theoretical: Existing research in sociology, adolescent development, and political science can be combined to predict ways in which afterschool activity might contribute to community development. And the final is potential: Research shows that urban youth are anxious for social change and willing to act, when empow-ered, to achieve it.
1.1.1 Timeliness
In the spring of 2001, Mayor Menino announced the formation of After School for
All, a $24 million public-private partnership focused on the creation and expansion of
af-terschool programs in the City of Boston. This initiative pools investments from local foundations, corporations, and universities, placing Boston at the top of a long list of cit-ies increasing their commitment to structured out-of-school activity. The growing de-mand for public sponsorship of afterschool programs is associated with two national trends: increasing workforce participation among single mothers, and testing to ensure minimum standards of educational achievement. Federal policy directives contributed substantially to both trends - the former with the 1996 federal welfare law requiring that recipients find work - and the later with No Child Left Behind (2001), an act which man-dated testing of all students. Recognizing the burdens these reforms place on low in-come working parents and underperforming schools, federal agencies began increasing support for afterschool programs. Funding for the largest federal source of afterschool
spending, 2 1st Century Community Learning Centers, grew from $1 million in 1997 to
well over $1 billion in 2002. Currently federal investment in out-of-school time amounts to approximately $3.6 billion annually (Padgette 2003).
Increased funding spurred research into afterschool programming. This research focused primarily on measuring demand for different types of afterschool activity, and identifying best practices. While advocates have often cited social network implications of adolescent involvement in afterschool organizations, there has been no work to actu-ally study these assertions or identify their community development impact. In the com-munity development field, researchers are just beginning to look at the effect of commu-nity organizations on neighborhood social networks. The impetus for these studies,
Robert Putnam's work on social capital and his best-selling book Bowling Alone (2000), is almost wholly academic. For the most part, the limited research in this area, with re-spect to inner city neighborhoods, has been confined to assessing the effect of
commu-nity development corporations on neighborhood social relations (Briggs 1997).
For researchers looking to uncover afterschool programs with a wider social net-work impact, a number of established organizations offer excellent entry points. These activist afterschool programs sprouted in neighborhoods throughout Boston in response to the youth violence and gang warfare that rocked the city during the latel 980s and early 1990s. As these programs developed, they delved into more complex issues such as the poor quality of Boston's public schools, the lack of jobs for young people, and dis-proportionate minority confinement in the criminal justice system. These young activists reach thousands of youth across the city each year through organized protest, confer-ences, and other events. While all well structured afterschool programs may have posi-tive community effects, these programs are ripe for attention because the information they disseminate is directly related to social change.
1.1.2 Theoretical underpinnings
Advocates for afterschool programming cite a large body of research demonstrat-ing less delinquency, lower rates of drug use, and higher academic achievement among adolescents who participate in organized afterschool activities (Holland and Andre 1987; Kahne et al. 2001). These studies show that youth programs are successful because they intervene directly in the formation of adolescent social networks, reaching young people just as they begin to establish relationships beyond their families (Hurrelmann
1996). Research in sociology demonstrates the importance of social networks to adults
and the communities in which they live. Sociologists note the role of social networks in everything from protecting long-term health to securing meaningful employment (Berk-man and Syme 1979; Campbell et al. 1986). Political scientists write about social net-works and their influence on civic behavior, such as the decision to vote (Verba et al.
1995). In the community development field, chatter about social networks has been
al-most deafening. Despite these on-going conversations, there has been little discussion about whether policy prescriptions (e.g. afterschool programming) can actually build stronger social networks in low income communities.
-1.1.3 Potential
If the theoretical assumptions about youth social networks are correct, the
poten-tial contribution of afterschool programs to community development efforts is enormous. Survey evidence says young people in America's inner cities want social change and are willing to work to achieve it (Lopez 2002; Boston Youth Survey 2001). They want change because they live in neighborhoods that bear witness to decades of failed urban policies. These inner city teens are still scared by the violence and disorder that accom-panied the crack epidemic in the early-1 990s, and they are deeply troubled by the me-dia's perception of their neighborhoods, and the light in which the media casts young people of color in general (Peffley and Williams 1996). Afterschool programs can capi-talize on this desire among youth to effect change by connecting them to people who can pass new information over to them, and then empowering them to transmit this in-formation through their own social networks.
1.2 Thesis Objectives
The objectives of this thesis are threefold:
1) To encourage practitioners both in afterschool programming and community
devel-opment to think about how they can forge social capital by intervening in adolescent social networks.
2) To provide as much evidence as possible testing the hypothesis that afterschool programs are fostering social ties; and to describe how different afterschool pro-grams generate different types of social capital.
3) To offer policy recommendations that will help afterschool programs and community
developers structure afterschool programs to influence social networks to the great-est extent possible.
1.3 Unit of Analysis
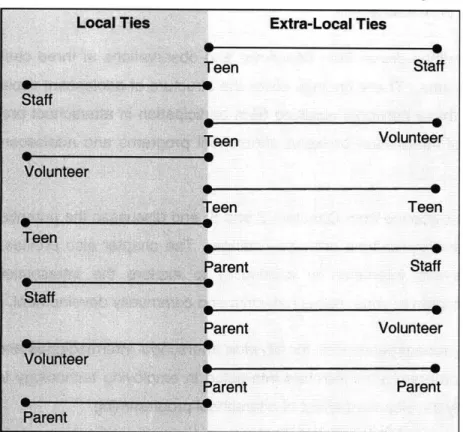
The unit of analysis is the social structure of low income communities. Because afterschool programs predominately focus on youth, at times it may seem like the focus is youth and adolescent social networks. This should not obscure the ultimate objective, which is examining whether youth programs create stronger social ties to, from, and within low income neighborhoods. I refer to these ties as intra-local and extra-local. As the box below illustrates, afterschool organizations can create many different tie
combi-nations between the teens, parents, staff and volunteers who participate in their pro-grams.
Figure 1-1: Types of Social Ties Generated by Afterschool Programs
Local Ties Extra-Local Ties
Teen Staff Staff TPAn Volunteer en Teen arent Staff Volunteer irent Parent
Lines represent a tie. The figure shows that teens and parents involved in youth programs can have ties to local actors (to the left) and/or extra-local actors (to the right)
1.5 Organization of the Thesis
The following outline provides a brief synopsis of each chapter. This information should give the reader a better sense of how the thesis is organized to accomplish the expressed objectives:
o Chapter 2 contains contextual information. The account includes a description of the
demographic characteristics of Boston's youth, their distribution into neighborhoods, and generalizations with regard to their strengths and weaknesses.
o Chapter 3 surveys the landscape of relevant theoretical and empirical research in the
fields of sociology, political science and adolescent development.
13-o Chapter 4 summarizes the research questions, and reviews methodology for the sur-veys and case studies analyzed in Chapters 5 and 6.
o Chapter 5 describes survey evidence on the impact of afterschool programs on
ado-lescent connections to unrelated adults.
o Chapter 6 presents findings drawn from interviews and observations at three case
study afterschool programs. These findings cover the structure of adolescent social networks, changes in these networks resulting from participation in afterschool pro-grams, and the flow of information between afterschool programs and adolescent networks.
o Chapter 7 synthesizes evidence from Chapters 5 and 6, and discusses the potential
community development implications of these findings. The chapter also provides reflections for researchers interested in continuing to explore the intersection between afterschool programs, youth social networks and community development.
o Chapter 8 offers policy recommendations for citywide afterschool intermediaries and
individual afterschool program administrators interested in employing technology to increase the community development effect of afterschool programming.
CHAPTER TWO Context
Teenagers devote much of their energy to making friends and organizing group social life. They build relationships across a geographic expanse defined by schools, religious institutions, community centers, youth organizations, parks, and other hang-out spots. Boston's teenagers travel their own unique routes through this web of institutions, forming different sets of relationships along the way. Some connections adolescents develop are with neighbors and peers; others are with professional adult staff at their school or community-based organizations. Many of the relationships teens maintain are with people who live within their neighborhoods; however, they can also be extra-local in reach. Together these non-familial ties represent a significant part of a young person's
evolving social network. As the next chapter will describe, these networks are
enormously influential in terms of a young person's life prospects. And in the aggregate, they have important community implications.
This chapter presents a portrait of the young people who populate Boston's inner city neighborhoods and the spaces and places which tie them together. The first section details their numbers and distribution into neighborhoods; part two reviews the schools and organizations they attend; and part three discuses broadly their strengths and needs. The first two sections of this chapter describe forces shaping adolescent social networks in Boston. While the last section continues to catalogue factors that affect youth social networks, it also highlights opportunities and challenges community organizations face when they attempt to build adolescent social networks in community development terms. 2.1 Demographics and Neighborhoods
This section relies on Census data to enumerate young Bostonians and describe their diversity. The data also depict demographic attributes of Boston's neighborhoods. These data suggest that the current distribution of youth into neighborhoods creates bar-riers to the formation of cross-cultural relationships. On the other hand, high residential densities in Boston increases overall adolescent sociability.
15-2.1.1 Demographics
The City of Boston is home to approximately 116,000 residents under 18. The youth population is notable for its diversity - two-thirds of residents under 18 are people of color versus approximately half of the overall population. African Americans are the largest youth group (37 percent), followed by Latinos and Latinas (24 percent), Asians (7 percent), and other young people who classify themselves as multiracial/multiethnic (7 percent). This diversity extends to different nationalities as well. According to the Cen-sus, 42 percent of children ages 5 to 17 come from families that speak a language other than English at home. At Boston Public Schools, English is not the native tongue for one out of six students; the most common first languages among these youth are (in de-scending order) Spanish, Haitian Creole, Chinese, Cape Verdean Creole, Vietnamese, and Portuguese (Boston Public Schools 2004).
Diversity is often an opportunity or reason-to-be for afterschool programs. Or-ganizations that concentrate on academic achievement, for instance, frequently focus on tutoring bilingual students. A number of Boston's afterschool cultural programs are built around a particular component of ethnic heritage. Diversity also provides afterschool programs with the opportunity to serve as an important bridge, connecting youth from different racial and ethnic groups. At the same time, diversity represents a significant challenge to afterschool programs that need to equip themselves to understand and re-late to students from many different cultural backgrounds.
2.1.2 Neighborhoods
Despite diversity in numbers, young people tend to be relatively segregated by neighborhood. The traditional measure of segregation is the Index of Dissimilarity. If races and ethnicities are spread evenly in a city, the index equals 0; in an area with complete segregation, the dissimilarity index equals 100. Dissimilarity indexes over 65 are considered extreme segregation. Figure 2-1 illustrates the high levels of residential segregation among some of Boston's children. Segregation is particularly pervasive be-tween African American and European American youth.
The racial segregation of youth generates economic segregation. In Boston, La-tino youth live in neighborhoods with an average poverty rate of 24 percent. The aver-age Asian and African American youth lives in a neighborhood with a poverty rate of
neighbor-hoods where the poverty rate is a much lower 13.8 percent. European American subur-ban youth present an even more extreme contrast. On average, less than 5 percent of residents in their neighborhoods live below poverty (Logan 2003).
Children are raised in their neighborhoods, and this is where they form their first non-familial relations. This means neighborhoods are a very significant part of a young person's socialization (Brooks-Gunn et al. 1993). The high degree of racial and eco-nomic segregation in the City hinders young residents' chances of obtaining a diverse set of social relations.
Figure 2-1: Dissimilarity Indices for Boston Youth under Age 18
80 70 60 , 50 --o 40 -E 30-20 -10 -
0-African American - European Latino - European American Asian American - European
American American
Source: Logan et al. 2003
In contrast to the negative social network implications of neighborhood segrega-tion, the City's built environment has important and beneficial social network implications.
A number of neighborhoods in Boston are very densely populated with youth. In East
Boston, Roxbury, and South Dorchester, there are more than 4,500 children under 18 per square mile (Table 2-1). Density gives kids ample opportunity to meet and interact. Studies show that children who live in high density neighborhoods have a larger number of friends and engage in activities with their peers more frequently (van Vliet 1985).
-Table 2-1: Boston Youth under Age 18 per Square Mile Area Youth (Sq. Miles)
Allston-Brighton 4.4
Back Bay-Beacon Hill 0.9
Central 1.3 Charlestown 1.4 East Boston 2.0 Fenway-Kenmore 1.2 Hyde Park 6.3 Jamaica Plain 3.1 Mattapan 2.8 1 North Dorchester 2.0 Roslindale 3.7 Roxbury 3.9 1 South Boston 3.1 South Dorchester 4.0 1 South End 1.0 West Roxbury 5.5 Boston 48.4 11 by Neighborhood Under Youth/Sq. 18 Mile 6,350 1,456 1,207 1,284 1,762 1,355 2,783 2,031 9,063 4,509 1,209 975 8,165 1,306 6,709 2,185 2,192 4,339 7,373 3,650 7,970 2,142 7,806 4,519 5,385 1,720 8,172 4,543 4,090 3,971 5,631 1,029 5,867 2,394 Source: Census 2000
2.2 School and Afterschool
Knowing who students attend school and afterschool programs with, and where these places are relative to where kids live, is central to an understanding of how Boston youth form their social networks. This section looks at both administrative and survey data to describe these settings.
2.2.1 School
Three-quarters of school-age children in Boston are enrolled in public schools. Out of these 62,000 Boston Public School Students, less than one-third live within walk-ing distance of their school. This is because the City maintains a school choice system that enables parents to choose which schools they want their children to attend. Unfor-tunately, school choice has not significantly increased racial or economic diversity within schools. The public school system is 85 percent students of color (48 percent African-American, 28 percent Latino, and 9 percent Asian) and 74 percent of the students come from families with incomes low enough to qualify for reduced-price meals (Boston Public Schools 2004). At the school level this means, on average, African-American students attend schools that are 60 percent African-American; Latino students attend schools that
are 44 percent Latino; and Asian students attend schools that are 28 percent Asian (Logan et al. 2003).
Very few of the children from Boston who attend private schools end up in set-tings where they develop ties to higher income peers. This is because they mostly go to parochial schools (14 percent of all Boston school children), where the majority of stu-dents come from low income families. A very small number enter private schools or suburban public schools with students from families with higher economic status (4 per-cent and 3 perper-cent of all Boston school children, respectively).
2.2.2 Afterschool
Afterschool, the majority of children (51 percent) ages 6 to 18 participate in some form of organized activity, significantly more than in other cities.' Involvement in after-school programs is fairly constant across age groups with 47 percent of 6 to 9 year olds,
53 percent of 10 to 14 year olds, and 53 percent of 15 to 18 year olds participating.
Afri-can AmeriAfri-can kids have the highest participation rate (55 percent) in afterschool pro-grams, followed by European Americans (52 percent) and Latinos (43 percent). Youth who attend afterschool programs go, on average, 3 times per week (Afterschool for All
2003). Afterschool programs are administered by both public institutions (schools, parks,
libraries, playgrounds) and private institutions (churches, YMCAs, museums, commu-nity-based organizations). The majority of youth in afterschool programs belong to com-munity-based (75 percent) programs located within the participant's neighborhood. This point is worth noting because programs at the neighborhood level are more likely to build local social relations.
A recent survey conducted by the Afterschool for All Partnership demonstrates
the range of programming offered by Boston's youth programs (Afterschool for All 2004). More than one-quarter of the programs address social change directly through topics related to community service, community organizing, or the environment (Figure 2-2). A number of the arts, sports, and general lifestyle programs also generate community de-velopment benefits by emphasizing leadership or building community identity.
1 San Diego (33 percent), Los Angeles (28 percent), Washington D.C. (25 percent), and New
York (22 percent) follow Boston, according to a study by the After-School for All Partnership.
19-General academic support
30-Healthy lifestyle promotion
U
Other
1%
Recreation 18%
Arts and culture
Sports Environment Job training Community service Community organizing Technology/computers College prep MCAS/test-taking support_____ ____ ___________ 0% 5% 10% 15% 20% 25% 30% 35% Percentage of Programs Source: Aftershool for All 2004
Despite the array of activities offered, half of Boston's teen choose not to (or are unable to) attend afterschool programs. According to the 2001 Boston Youth Survey, nearly half (47 percent) of teens work after school; 17 percent work more than 20 hours per week. Given these statistics it is not surprising that work is the second most com-mon reason for not attending afterschool programs after lack of interest. Just under a third (29 percent) of Boston teens report hanging out with friends as their most common afterschool activity, followed by youth who just go home (18 percent) when school is over.
Studies of parenting in urban neighborhoods point to evidence that parents may prevent children from attending afterschool programs out of fear for the child's safety traversing to and from the program. In a study of neighborhoods in Philadelphia, for ex-ample, Frank Furstenberg (1999) and his colleagues found two types of parenting strategies. One approach was 'promotive' with parents enrolling kids in programs to help further developmental goals. Many parents, however, choose an opposite proach which Furstenberg calls 'preventive management'. Parents who take this ap-proach in the most extreme form try to keep children at home as much as possible. A study of Boston's parents found that many felt they had "no safe way to get kids to and from programs" (Afterschool for All 2003).
2.3 Boston's Youth Population: Strengths and Needs
As Melvin Delgado (2000), a professor of social work at Boston University, has written, urban youth are rarely viewed from a strengths perspective because the popular media consistently casts inner city teens in a negative light. Boston's youth are less fre-quently depicted as confident and caring builders of community, although in reality they often take on such a role. This section looks at data from the 2001 Boston Youth Survey and other sources to assess the strengths and needs of the population afterschool
pro-grams must serve.2
2.3.1 Strengths
The Search Institute describes twenty internal assets that together foster a sense
of "confidence, passion, and purpose" in youth (Search Institute 2004). The Institute
breaks these assets into four categories: commitment to learning, positive values, social competence and positive identity. Evidence from the 2001 Boston Youth Survey sug-gests that the City's teenagers possess most of these assets to some degree. In terms of commitment to learning, 70 percent of teens feel that getting good grades is important or very important to their friends, and three out of four teens plan to continue their edu-cation after high school graduation. The Boston Youth Survey also suggests that teen-agers have fairly high self-esteem (two-thirds reported feeling just as good as others all or most of the time) and a positive outlook (two-thirds reported feeling hopeful all or most of the time). There is little survey evidence pointing to social competencies among Bos-ton's youth. However, given the density and diversity to which kids in Boston are
ex-posed, it likely that they would also rate highly on these scales.
The capacity to fight for social changes is perhaps the most important and least understood asset of urban youth. Boston's young live in neighborhoods where fires sparked by redlining, white flight, urban renewal, deindustrialization, and a host of envi-ronmental injustices smolder. The positive side is that fighting these fires has bred local capacity. Many children in Boston have parents who are experienced social change leaders. The Social Capital Benchmark Survey (Boston Foundation 2001) found that
2 Unless otherwise noted, the statistics provided in section 2.3 are from the 2001 Boston Youth
Survey.
-Boston ranks among the highest of the 40 cities surveyed on 'political activism (fifith)',
'collaboration with neighbors (third)', and 'conventional politics (sixth)'.3
Table 2-2: Search Institute's 20 Internal Assets
Achievement Motivation School Engagement Commitment to Learning Homework
Bonding to School Reading for Pleasure Caring
Equality and Social Justice
Positive Values Integrity
Honesty Responsibility
Restraint
Planning and Decision Making Interpersonal Competence
Social Competence Cultural Competence
Resistance Skills
Peaceful Conflict Resolution Personal Power
Positive Identity Self-Esteem
Sense of Purpose
1 _ _ 1 Positive View of Personal Future
Source: Search Institute 2004
Survey evidence suggests that these values have spread. When teenagers were asked what they want out of afterschool programs, their responses were surprisingly so-cially conscious (Lindsay et al. 2002). Youth desired "the skills to overcome the obsta-cles and barriers they face," "workshops that address sex, drugs, and racism," and "the power to make things happen." In the words of the authors, Boston youth were asking for afterschool "activities that support them to serve their own community and learn about the broader world (p. 10)." The 2001 Boston Youth Survey also found similar as-pirations; when asked about most important life goals, 49 percent of respondents said "being a leader in the community," 47 percent said "making a contribution to society," and 44 percent said "working to correct social and economic inequalities."
3 The survey also found that Boston ranked among the worst (39 of 40) on measures of social
trust. Generally trust is positively correlated with civic involvement. While this does not seem to be the case in Boston, the lack of social trust among the City's residents is a point to take note of.
2.3.2 Needs
Youth in Boston clearly have unique needs, primarily for two related reasons. The first problem is that teens in Boston have less contact with their parents than youth in other parts of the state. A large percentage of kids in Boston are raised without the presence of a father figure. According to the 2000 Census, 43 percent of all households with children in the City are headed by single mothers (versus 22 percent statewide). In
neighborhoods with higher concentrations of children, there are generally even larger percentages of children living in single mother households. For instance in Roxbury, nearly 65 percent of households with children are headed by single mothers. The Bos-ton Youth Survey shows that 22 percent of teens have no contact with their fathers. Ap-proximately 62 percent of Boston's single mothers work (Census 2000). The burden on working mothers coupled with the absence of father figures means many children spend limited amounts of time with supportive adults. According to the Mayor's Taskforce on out of school time (2000), two-thirds of children under 14 live in households with parents who are unable to care for them between 2:00 p.m. and 4:00 p.m.
The second greatest need among Boston youth is income. This is related to the first need because children raised in single parent families are more likely to experience poverty with only one wage earner in the household. Estimates suggest that one-quarter of Boston's residents under age 18 lived in households with incomes below the poverty line in 1999. In some neighborhoods, the poverty rates were higher, but across the City poverty generally hovered somewhere between a quarter and third of all children
(Ap-pendix B).4 Living on low income creates serious stresses for parents in Boston.
Ac-cording to one report, the struggle to find quality schools and childcare, heightened fears over housing security, and isolation in communities that lack strong community connec-tions are all sources of family stress in Boston (Freeman and O'Connor 2002).
The combination of absent parents, low income and family stress results in some severe problems for Boston's teens:
o Violence. More than a third of teens reported witnessing violence on the street. One-quarter witnessed violence at school. Twenty-five percent said gang activity was a problem in their schools; and 30 percent saw gangs as a serious problem in their neighborhoods.
4 In this case, poverty refers to a threshold set by the U.S. Census Bureau that varies by family
size and includes both earned income and public assistance income. In 1999, for example, the poverty line was $11,483 for a single mother with one child, an extremely small sum relative to Boston's cost-of-living.
-o Education. One-quarter of Boston Public High School's class of 2000 dropped
out before graduation.5 In 2002, 66 percent of
10th graders scored below state
standards in English; 76 percent scored below these standards in math.
o Health. In 2001, more than a third of Boston's teens reported feelings of
depres-sion that interfered with their regular activities. Nine percent of babies born in Boston in 2000 had low birthweights, 30 percent above the statewide average.
In 2001, 5 percent of children living in Boston had elevated blood lead levels. 6
The City's afterschool programs are designed to address the needs of Boston's youth. Many try to help kids up and out of poverty by improving academic performance and ex-posing teenagers to new career and educational opportunities. Working with low income children is also a challenge for Boston's afterschool programs. It means that parents are unable to cover costs and programs must rely on uncertain subsidies. Even with these subsidies, cost still seems to be a major factor preventing more kids from accessing af-terschool programs. According to a study by the Afaf-terschool for All Partnership, the most frequently cited barrier for parents with children not participating in a program was cost. The study also found that half of parents pay nothing for their child's afterschool program and two-thirds pay less than $20 a week.
2.4 Summary
Boston has a large and diverse youth population. The city's density means that youth have a lot of social interaction as they travel across neighborhoods and neighbor-hood institutions. Unfortunately racial, ethnic, and economic segregation prevail among the city's youth. This strongly influences the type of peers and non-relative adults ado-lescents are likely to add to their social networks. Youth in Boston have important as-sets, including their desire to effect social change; they also face significant deficits. Youth programs in Boston try to build on assets, while working simultaneously to heal deficits.
5 Boston Center for Youth and Families. The Boston 2003 Trend Report: Snapshot of Boston's
Children and Youth. p. 61 and p. 23. 6 lbid, p. 17, p. 43 and p. 45.
CHAPTER THREE Literature Review
Increasing the economic and political power of residents are two immediate goals for community developers working in inner city neighborhoods. A vast body of research reviewed in this chapter points to evidence that 'social networks' are a major influence on both the economic and political power of individuals and the communities in which they live. By re-reading these studies with an eye toward afterschool programs, and in-corporating social network findings with research in the field of adolescent development, this chapter develops the general hypothesis that afterschool programs can have a pow-erful impact on neighborhood community development. The literature reviewed below also exposes the more specific research questions framed in the beginning of Chapter 4.
3.1 Social Networks: An Overview
Before discussing studies that apply social networks to neighborhood level poli-tics and economics, it is worth reviewing some basic social network concepts. Everyone has a social network consisting of people they have met and interacted with throughout their lives. Studies show that our entire social network includes, on average, about 1,500 acquaintances (Killworth et al. 1990). Personal networks, the people we socialize with regularly and depend on more frequently for support, are a subset of this larger social network and generally number in the teens (Wellman 1979). The size and nature of per-sonal networks vary; and there is often correlation between the neighborhood in which a person lives, and the characteristics of their personal network (Fischer 1982). This find-ing is related in part to personal preferences: people often cluster in a neighborhood be-cause they prefer to be around others who are like themselves. The term sociologists use for this tendency is homophily. Networks in which most individuals are similar in terms of characteristics like age, race, religion and socioeconomic status are said to be
highly homophilous. In some circumstances, a network is homophilous because a
per-son is born into a relatively homogenous social setting. In other cases, a network is more or less homophilous than average because of individual choices or life experiences (McPherson et al. 2001).
-When we look at the social network of each neighborhood resident layered on top of one another they form a 'neighborhood social network' with unique characteristics.
In some communities, it is common for people to have ties to neighbors and extended family members that live nearby. This becomes a notable trait of a neighborhood social network that is probably rather 'dense', meaning most people in the area know one an-other, at least by name. In other communities, residents have few neighbors, let alone extended family members, in their personal networks. In this case, the neighborhood's social network is very 'loose-knit'. The density of residents' social networks relates to how information flows into the community. If a network in a local area is dense, people generally have all the information about happenings within the community but very little information about events external to the group. In contrast, a loose-knit network pro-vides information flow from ties that are likely to be spatially dispersed, giving an area access to ideas and resources well beyond its borders. To illustrate, it is useful to look at some fictional examples:
Consider a man who immigrated 5 years ago from a Caribbean country and now lives in an inner city neighborhood. This man works at a local auto repair shop, and like him, most employees of the garage live nearby. When he has conversations about im-portant things in his life, they are either with coworkers or friends and family who also live in the same neighborhood. Now contrast this man with a native-born woman who lives in an inner-suburb and works in a downtown office building. She has important conversations with her husband (who works in a suburb nearby), a co-worker from the city, a close friend from college (who lives in an outer-suburb), and another woman from an inner-suburb (who she met at her gym).
When looking at social networks, the unit of analysis is often the type of support exchanged through a tie. This woman and her friend from the gym are not close; they have only a weak tie. She would not call on the lady to lend her $1,000 or console her at a time of genuine need; for these services she would turn to a strong tie. Still this ac-quaintance provides her with valuable information, such as the location of a new restau-rant that will impress her boss. Weak ties like this one are often 'bridging' ties. This is because the tie spans the 'structural hole' between two otherwise unconnected networks. No members of either network know each other - to the extent that information passes between them - it must travel through this tie (Burt 1992).
The man from the first example has a relatively dense personal network, which means that most of the people with whom he has conversations know each other and
are friends as well. Since most of his friends live nearby, it is likely that the neighbor-hood's social network is also relatively dense. From a sociological perspective, such a community would have high levels of 'bonding social capital', meaning residents fre-quently visit with one another and exchange different types of support (Gittell and Vidal
1998).
The woman's personal network, on the other hand, is relatively loose-knit; few of the people she confides in actually know each other. On the surface, this distinction may appear minor, but as the studies presented below will demonstrate, when aggre-gated spatially, loose-knit networks provide a community with 'bridging social capital'. Bridging social capital facilitates the flow of knowledge into a community and creates linkages to external assets (Putnam 2000). Together both bridging and bonding social capital are important ingredients to communities. As the research presented in the fol-lowing sections will demonstrate, these forms of 'capital' influence the economic and
po-litical power of a community and its residents.7
3.2 Social Networks and Neighborhood Economic Power
Neighborhood economic power is the ability of residents to generate income suf-ficient to develop and support local enterprise, purchase and maintain homes in the community, and save enough of their earnings to ensure long-term security for their
families.8 Most low income communities are a long way from reaching this reasonable
goal, and many sociologists believe that the structure of residents' social networks must change before it can be realized. Personal network characteristics (i.e. size, density, diversity) are highly correlated with socioeconomic status (Campbell et al. 1986). In low income neighborhoods, residents tend to have smaller and denser social networks rela-tive to residents of middle and upper income areas (Fischer 1982; Burt 1992; Kadushin and Jones 1992). A large body of social network research describes how these network characteristics perpetuate economic disadvantage. That is, it may be small dense net-works, as opposed to lack of jobs skills or work experience, that prevent residents of
7 1 do not mean to imply by these examples that loose-knit networks are superior to dense
net-works. Each network structure has advantages and disadvantages addressed by the literature reviewed in the following sections.
8 See Saegert et. al. (2001).
-Extra-Local Tie Intra-Local Tie Bridging Tie
Figure 3-1 Neighborhood Network Diagrams: The structure of residents' personal networks is related to the structure of a neighborhood's social network. Neighbors with dense personal net-works may form relatively unconnected sub-groups (upper-left) or they may be well connected throughout a neighborhood (lower-left). Likewise, neighborhood where residents maintain loose-knit personal networks with external-ties may be either disconnected (upper-right) or well con-nected (lower-right) at the neighborhood level.
low income neighborhoods from escaping poverty. This section reviews the social net-work literature on job search and describes how growing up in neighborhoods where poverty is concentrated influences a child's long-term economic prospects.
3.2.1 Searching for work
In sociological circles, the notion that the structure of social relations has eco-nomic consequences can be traced back to Mark Granovetter's (1973) 'strength of weak ties' argument. According to Granovetter, information passed through weak ties is more likely to generate new income-producing opportunities than the often redundant strong tie information obtained from close family and friends. Studies that set out to test Granovetter's hypothesis helped tweak this weak tie theory. Lin et al. (1981) looked at a sample of 400 men searching for work in the Albany, New York, area and found that those seeking high-status employment in managerial professions relied more often on weak ties than those looking for manual work. Campbell (1986) and her colleagues
made this distinction as well. Their findings showed that when searching for jobs, low income workers depended heavily on family and friends. These individuals of modest means had fewer weak ties, and the weak ties they did possess were generally not the type of bridging ties which provide the 'social leverage' essential to economic mobility
(Briggs 1998).
The weak tie hypothesis has been employed by researchers describing the social structure of inner city neighborhoods, where deindustrialization coupled with population decentralization has severely reduced the supply of jobs. Work that is available to resi-dents of these areas is 'spatially mismatched'; there is a significant gap between where jobs are located, where people who could benefit from them live, and the reach of public transportation infrastructure (Kain 1992). These spatial disparities are the product of ra-cism and the Federal Housing Administration's practice of redlining. They persist largely because of exclusionary zoning practices strongly fixed in place in many suburbs (Rabin
1989). Social scientists believe the families left behind in inner city neighborhoods are
socially isolated from society's mainstream individuals and institutions (Jargowsky 1997; Wilson 1987).
If this is the case, the structure of social relations in these neighborhoods
pre-vents most families from escaping poverty. A recent study by James Elliot (1999) gives credibility to this hypothesis. Elliot analyzed surveys of both employers and job seekers in Atlanta, Boston, Detroit and Los Angeles. He concluded that dense social networks
-among the urban poor explain the persistence of concentrated poverty across inner city neighborhoods.
Perhaps the most visible evidence of damage caused by the economic devasta-tion of America's inner cities is the dramatic change in household structure. With few op-portunities to earn decent wages, men have withdrawn from family life, forcing women to raise children on their own (Wilson 1996). The 1996 welfare reform legislation means mothers in poor urban neighborhoods must work long hours at low-paying jobs to sup-port their families (Corcoran et al. 2000). A number of recent studies suggest that these low income women lack the type of social networks that could improve their situations by providing access to important resources like childcare, employment training, and jobs. Women traditionally have personal networks in which kin and neighbors figure more prominently; voluntary organizations ties tend to be from organizations like the PTA or church groups, versus the business groups or political associations which men more fre-quently join (Smith-Lovin and McPherson 1993). While these ties are often useful in ob-taining support with parenting, they are generally less valuable when seeking
employ-ment.
In a study of urban inequality in Los Angeles, Stoloff (1999) demonstrated that the densely knit social networks of women in low income neighborhoods fail to transmit important employment-related information. Rankin (2003) looked at data from low in-come children and their female caregivers in poor neighborhoods of Boston, Chicago and San Antonio. He found that most women surveyed had a dearth of weak ties. As a substitute, they depended on strong ties to find jobs, which led to lower quality employ-ment. As primary caretakers for children, connections to women are a component im-plicit in many afterschool programs. A tie a young participant develops to a volunteer or member of the program staff could transmit potentially important economic information to the adolescent's mother.
While researchers have yet to explore how social networks impact the economic prospects of youth directly, studies show that there are wide racial disparities between how European-American and African-American youth benefit from the resources stored in their social networks when looking for their first jobs. Holzer (1987) found that among youth aged 16 to 23, European-Americans have more success finding employment us-ing social contacts than African-Americans. Accordus-ing to his calculations, social con-tacts explain 41 percent of the difference in the probabilities of Black and White youth locating work. Korenman and Turner (1996) suggest that among youth living in Boston
who successfully find
jobs
from ties, European-Americans earn more than African-Americans, relative to the Black-White wage differential for youth finding jobs using for-mal channels or direct application. It is interesting to note that African-American youth with European-American friends are able to access the networks of their peers as the weak tie theory predicts. Braddock and McPartland (1987) demonstrated this by com-paring the racial composition of high schools. Their study offered evidence that African-American students from racially segregated schools earn lower incomes as adults be-cause they have fewer European-American peers than African-Americans who attendintegrated high schools.
3.2.2 Long-term economic impact of neighborhood poverty on youth
The research presented up until this point suggests that living in neighborhoods with concentrated poverty makes it difficult for low income workers, especially single mothers, to access employment. The studies also presented evidence that the social networks of African-American youth negatively influence initial employment prospects. An important question remaining then is does growing up in a neighborhood with con-centrated poverty have a lasting impact on job prospects? There is a wide range of lit-erature describing how 'neighborhood effects' might influence a child's future life pros-pects. This research shows that children with the same family and socioeconomic back-ground are more likely to experience poverty as adults if they are raised in a neighbor-hood where poverty predominates (for a review of this literature see Ellen and Turner
1997). Researchers have had a difficult time producing a unified theory of how
concen-trated poverty works to undermine adolescent development. The weak institutions hy-pothesis is probably the least disputed among many explanations. In this view, local in-stitutions (i.e. schools, police, health service providers) in poor neighborhoods are over-burdened and thus fail to fulfill their important missions with respect to children (Fursten-burg 1993). Other researchers believe that problems (i.e. domestic violence, substance abuse, teen pregnancy) spread peer-to-peer like epidemics in neighborhoods that are densely populated with poor residents (Crane 1991).
The neighborhood effects theory most consistent with a social network approach is one of 'collective socialization'. According to this view, when the majority of adults who children interact with are unemployed or have jobs that provide low levels of satisfaction, children decide that the working world offers little return. In these neighborhoods of con-centrated poverty, information from socially connected network members, which would
-help children learn the norms and habitats of work life, is often missing (Wilson 1987,
1996). The absence of role models and mentors impedes a child's development and
negatively impacts his or her long-term employment status (Sanders 1998). As Sophie Pedder found in her study Chicago's South Side, many inner city kids never travel down-town or leave their immediate neighborhood; as a result, their view of opportunity is severely restricted (Massey and Denton 1993). Evidence shows that children weigh their chances for success in the future based on subjective perceptions of how the opportunity structure works (Galster and Killen 1995). When young people from poor urban neighborhoods begin to see an impenetrable opportunity structure, they disengage from the workforce. MacLeod's (1987) ethnographic work of children living in New Haven public housing noted that the social isolation of the housing projects presented an insurmountable barrier, even for the neighborhood's most ambitious teens. Holzer and Offner (2001) demonstrated the effect of increases in concentrated poverty on employment by highlighting the downward trend in employment rates of young African-American men, ages 16 to 24, between 1979 and 2000.
While data from the 2000 Census show that the trend during the 1970s and 1980s towards increasingly concentrated inner city poverty was reversed in the 1990s (Jargowsky 2003), the actual story is more complicated and less positive. In Metropoli-tan Boston, the economic geography of opportunity is shifting. Housing pressures are pushing poor families out from the core to small satellite cities like Brockton, Lawrence
and New Bedford.9 At the same time, these older industrial cities continue to
hemor-rhage jobs as more and more factories relocate overseas. Second-tier cities are in-creasingly becoming areas of persistent and concentrated poverty. For children living in these places, opportunity is nearly invisible.
Afterschool programs that increase the size and diversity of youth social net-works have the power to change a child's long-term economic prospects. According to a study by Xavier Briggs (1998), "adding just one steadily employed adult to an adoles-cent's circle of significant ties has dramatic effects on perceived access (p. 177)." But the most powerful result of improving one youth's network is the effect it is likely to have on other youth. A teenager with a more diverse set of contacts is able to help siblings,
9 This claim is hard to support with empirical evidence because the last decennial Census cap-tured population characteristics just as the trend surfaced. It is, however, widely acknowledged
by service providers in Boston neighborhoods. See Vineet Gupa. "City Weekly," The Boston
extended family, and friends in their efforts to find meaningful employment. There is al-ready some evidence that afterschool programs have this effect. Surveys of parents with children in 60 afterschool programs across the country found that their child's par-ticipation in the program helped 45 percent of parents "get better jobs or do better at their jobs" (Grossman 2002). While this effect is surely associated with the childcare provided by the program, such a large impact suggests that parents might be getting leads to jobs through new ties related to their child's participation. Afterschool invest-ment in youth, therefore, should have a type of multiplier effect across the local commu-nity.
3.3 Social Networks and Neighborhood Political Power
Neighborhood political power, defined broadly, is a community's capacity to mo-bilize residents, non-profit organizations, and external institutions to recognize and
ad-dress local concerns.10 Social network literature raises several points with respect to
how the personal relations of residents contribute to, or in some cases prohibit, a com-munity's ability to advance its unique political interests. Like economic power, studies demonstrate the contribution of a certain type of weak bridging tie. In the context of po-litical power, ties that extend out beyond a neighborhood represent 'bridging social capi-tal'. However, in contrast to economic power, where weak ties are the essential force, communities also benefit from 'bonding social capital' or strong networks of local ties be-tween residents. This section looks at literature discussing the complexities of each type of social capital, their respective relationships to neighborhood political power, and ways in which afterschool programs might generate more of each.
3.3.1 Bridging social capital
In the last few years, political scientists started looking at social networks with in-creased scrutiny. Not surprisingly, their efforts show that individuals with loose-knit net-works are more exposed to different and more current political information (Huckfeldt et al. 1995). As a result, they tend to vote more frequently (Verba et al. 1995). People with diverse sets of friendship ties also engage in more non-electoral political acts such as attending rallies, signing petitions, or belonging to groups that take local action for social change (Kotler-Berkowitz 2004). Residents with low density social networks are also
- 33