ISSN 1811-9743 DOI: 10.3923/ijds.2017.236.242
Research Article
Lactation Stage Effect on Nutritional Quality of Algiers Area
Cows’ Milk
1,2
Fawzi Rostane Meklati,
3Amel Meribai and
1,4Meriem Hind Ben-Mahdi
1Laboratoire de Recherche, Santé et Productions Animales, Ecole Nationale Supérieure Vétérinaire (ENSV), 16004 Alger, Algérie 2Centre de Recherche Scientifique et Technique en Analyses Physico-chimiques (CRAPC) BP 248, 16004 Alger, Algérie
3Laboratoire de Technologie Alimentaire et Nutrition humaine, Ecole Nationale Supérieure Agronomique (ENSA), 16200 Alger, Algérie 4Ecole Supérieure des Sciences de l’Aliment et des Industries, Agro-alimentaires d’Alger (ESSAIA), 16200 Alger, Algérie
Abstract
Background and Objective: The quality of cow's milk from imported races is a new subject in the field of milk production in Algeria while
taking into account the new breeding conditions these animals are subjected to. Consequently, this study aims to study the effect of one of these conditions, the lactation stage, on milk physico-chemical parameters along with its impact on Fatty Acids (FA) content.
Methodology: A group of 340 dairy cows were spread out over 3 dairy-farms located in the surrounding of Algiers. They were monitored
for 10 month s lactation at a rate of one sampling a month in order to cover 3 stages: Early, mid and late lactation. Results: The study showed that lactation stage significantly contributes (p<0.05) to variation of some physico-chemical parameters (acidity, density and Fat Levels (FL)) of milk delivered to local transformers. Milk (FA) profile significantly changed too (p<0.05) with a weak proportion of Saturated Fatty Acids (SFA) at early lactation, increasing very significantly (p<0.0002) at late lactation (60.73 vs. 66.16% respectively). The Short and Medium Chain Fatty Acids (SMCFA), except for C4:0 were rather in weak proportion at early lactation stage and increased during the advance of the process. However, Long Chain Fatty Acids (LCFA), particularly C18:0 and C18:1 showed an opposite tendency with a high proportion at early lactation. No lactation stage influence was shown on C18:2 and C18:3 contents (p>0.05). Conclusion: By controlling the breeding conditions, the study showed that lactation stage significantly contributes to variation in Algiers milk fat composition and alters the activity of fatty acid pathways. Besides, milk will get interesting nutritional qualities.
Key words: Raw milk, imported races, lactation stage, nutritional quality, fatty acids
Received: January 12, 2017 Accepted: March 06, 2017 Published: April 15, 2017
Citation: Fawzi Rostane Meklati, Amel Meribai and Meriem Hind Ben-Mahdi, 2017. Lactation stage effect on nutritional quality of algiers area cows milk. Int. J. Dairy Sci., 12: 236-242.
Corresponding Author: Fawzi Rostane Meklati, Laboratoire de Recherche, Santé et Productions Animales, Ecole Nationale Supérieure Vétérinaire (ENSV), 16004 Alger, Algérie Tel: +213549310280
Copyright: © 2017 Fawzi Rostane Meklati et al. This is an open access article distributed under the terms of the creative commons attribution License, which permits unrestricted use, distribution and reproduction in any medium, provided the original author and source are credited.
Int. J. Dairy Sci., 12 (3): 236-242, 2017
INTRODUCTION
Bovine milk is a complex liquid containing approximately 4.6% lactose, 3.9% fat, 3.2% protein and 0.7% minerals1. Milk
lipids are made up of more than 98% of triglycerides, source of more than 400 Fatty Acids (FA)2.
Milk FAs take source from dietary intake, de novo
synthesis in the mammary gland, they are also formed in the rumen through ruminal biohydrogenation and can be released from body lipids mobilization3,4.
However, several factors affect the milk physico-chemical composition and particularly the lipid fraction. It generally, varies in accordance with seasons, lactation number, feeding and health-status4-6.
Many studies have been carried out in Algeria in order to study physico-chemical parameters or milk hygienic quality from farms or dairy units but few of them have studied the fatty acid composition7-11. This study contributes to
investigate among dairy cows introduced in the country, the evolution of some physico-chemical parameters according to the lactation stage of milk intended to transformation. The objective was to assess the ideal cow lactation stage to increase the cheese-yield and to suggest the best possible stage lactation distribution to increase the FA contents, healthy for the consumers while reducing harmful ones and therefore, provide a qualitative nutritional intake product.
MATERIALS AND METHODS
Location of the dairy cows: This study is carried out over
340 dairy cows from a variety of imported races introduced in Algeria (Holstein and Montbeliard), accompanied as far as their 10th lactation month and spread over 3 dairy farms located in the Mitidja, a grassland from Northern Algeria (Algiers latitude 36E46 34 N, longitude 3E3 36 E, Blida latitude 36E29 N, longitude 2E50 E, Tipaza latitude 36E35 31 N, longitude 2E26 58 E).
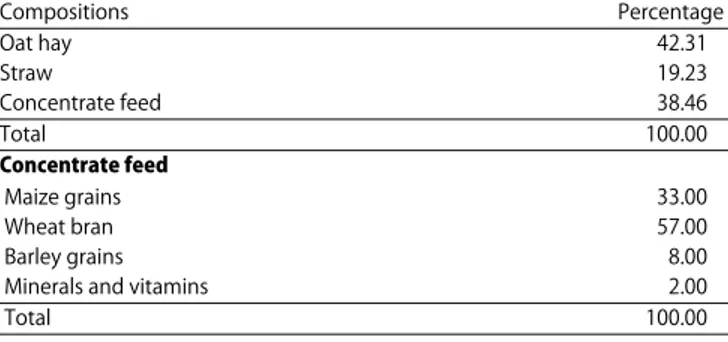
Dairy cow s feeding: The experiment was held in real
dairy-farming conditions with similar total mixed ration over the 3 farms and made up of oathay, straw and concentrate feed defined and prepared in-situ within the farm by the breeder (Table 1). Grass rationing is served at will and watering made 3-4 times per day.
Sampling procedure: Milk sampling was carried out from the
morning on every lactation month. All samples were stored at 4EC until prior to used for analysis.
Table 1: Formulation of total mixed ration distributed (all farms)
Compositions Percentage Oat hay 42.31 Straw 19.23 Concentrate feed 38.46 Total 100.00 Concentrate feed Maize grains 33.00 Wheat bran 57.00 Barley grains 8.00
Minerals and vitamins 2.00
Total 100.00
Three lactation steps are taken into consideration during this study: Early, mid and late ones. The initial step shows the first three months lactation average value. The second one refers to the 4th until the 6th month and the third one from 7th-10th month.
Analysis: The acidity and density measures were determined
according to the AFNOR standards (NF V04-206, 1969) and (NF V04-204, 2004)12. Total Dry Extract (TDE) was determined
using an infrared desiccator. Protein Levels (PL) were obtained after measuring the total amount of nitrogen protein according to the Kjeldhal method (ISO 8968-1, IDF 020-1: 2014)13, whereas Fat Levels (FL) were determined by
the Gerber s method (NF V04-210, 2000)12.
The conversion factor (0.945) enables to infer Total Fatty Acids (TFA) proportions contained in milk fat14.
Fatty Acid Methyl Esters (FAMEs) were prepared according to ISO Standards15 after fat extraction16. They were
analyzed by an Agilent GC 6890A gas chromatograph (Agilent Co. Ltd, USA) coupled to a mass-selective detector (MSD 5973) from the same company, using a fused silica capillary column (HP-Wax, 60 m×0.25 mm, 0.25 µm film thickness, Agilent Co. Ltd, USA). The carried gas was helium at flow rate 0.5 mL/min. The injection volume was 1 µL in 1:20 split mode. The injector temperature was maintained at 250EC. The initial oven temperature was held at 40EC for 4 min, increased to 140EC at a rate of 10EC/min (held for 1 min) and then increased by 2EC/min to a final temperature of 240EC (held for 2 min).
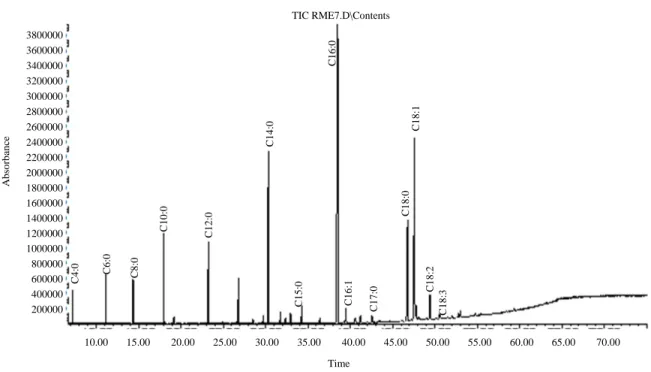
Identification of common FA (Fig. 1) was performed with NIST 02 [US National Institute of Standards and Technology (NIST), Gaithersburg, MD, USA] mass spectral database.
Three replicates were performed for each sample. The average of these three values and Standard Deviation (SD) were determined for each identified component.
Statistical analysis: Data from 340 dairy cow s milk (all races
combined) were statistically treated by ANOVA one factor criterion by analysis of variance using STATISTICA version 6.1 237
Int. J. Dairy Sci., 12 (3): 236-242, 2017
Fig. 1: Chromatogram of some common fatty acids in milk, C4:0: Butyric, C6:0: Caproic, C8:0: Caprylic, C10:0: Capric, C12:0: Lauric, C14:0: Myristic, C15:0: Pentadecanoic, C16:0: Palmitic, C16:1: Palmitoleic, C17:0: Margaric, C18:0: Stearic, C18:1: Oleic, C18:2: Linoleic and C18:3: Linolenic
Table 2: Means and significance effects of lactation stage on milk physico-chemical composition Lactation stage
---Physico-chemical parameters Early Mid Late p-value
pH 6.60±0.06 6.65±0.02 6.67±0.02 NS1
Acidity (ED) 17.93±0.95a 17.26±0.16ab 16.69±0.18b 0.04
Density 1030.93±0.23ab 1030.27±0.04b 1031.66±0.75a 0.03
TDE (g LG1) 120.73±2.39b 120.37±0.58b 126.37±2.90a 0.02
Fat-free dry matter (g LG1) 84.93±0.04 84.20±0.15 85.02±0.93 NS
PL (g LG1) 30.43±0.87 31.64±0.34 31.86±0.70 NS
FL (g LG1) 35.80±2.80b 36.17±0.66b 41.11±2.72a 0.03
TFA (g LG1) 33.83±2.64b 34.18±0.63b 38.85±2.57a 0.03
1p>0.05, In each column, values (mean±SD) mentioned with different letters are significantly different (p<0.05) by using Duncan s test. The letter a corresponds to
the highest adjusted mean. In a same column, values with different letters differ significantly from each other
(Statsoft, France). Analysis is based on a model described by a categorical explanatory variable (one variability factor) which is in our case lactation stage.
When ANOVA results are significant (p<0.05), Duncan s test multiple averaging was applied. It permits to study in detail significant variations recorded in each different lactation stage group: Early, mid and late.
RESULTS AND DISCUSSION
Typical milk characteristics: The variance results (ANOVA
using one-way analysis of variance) showed a significant lactation stage effect (p<0.05) on acidity, density, TDE, FL and also TFA, but, it revealed no effect (p>0.05) on PL, fat-free dry matter and pH (Table 2).
Titratable acidity raised at early and mid lactation compared to the late one (p<0.02) with +1.24ED, which confirms Coulon et al.17 results with +1.10ED and
Boudalia s et al.9 ones at early lactation. However, TDE, FL and
TFA showed an opposite trend: They were higher in late lactation compared with the early and the mid ones. The same tendency was observed for density, which remains in the standards but with a difference of +1.39 (Table 2), a result that was already reported both by Benyounes et al.7 and
Legarto et al.18. However, Boudalia et al.9 recorded lower
values at early lactation (1028-1029).
The TDE increases as lactation progresses (p<0.02; Table 2). This tendency is in accordance with the one obtained by Nantapo et al.19 but lower than that obtained by
Boudalia et al.9 at early lactation (125-130 g LG1). 3800000 3600000 3400000 3200000 3000000 2800000 2600000 2400000 2200000 2000000 1800000 1600000 1400000 1200000 1000000 800000 600000 400000 200000 C4 :0 C6 :0 C8 :0 C10 :0 C12 :0 C14 :0 C15 :0 C16 :0 C16 :1 C17 :0 C18 :0 C18 :1 C18 :2 C18 :3 10.00 15.00 20.00 25.00 30.00 35.00 40.00 45.00 50.00 55.00 60.00 65.00 70.00 TIC RME7.D\Contents Time Abs o rb ance
Int. J. Dairy Sci., 12 (3): 236-242, 2017 70 60 50 40 30 20 10 0 F att y acid s p er cen tag e
SFA UFA MUFA PUFA
* * * Fatty acids Early Mid Late Besides, FL and TFA are at their lowest levels at early
lactation stage (Table 2). These minimal contents correspond to the average amount of the first three month s lactation period characterized by a depression phase during the peak milk yield18,20,21. This could explain their weakness observed
during this step compared to the two other lactation ones. They increase in mid lactation in order to reach the maximal values in late lactation (p<0.03) in agreement with the Legarto et al.18 results.
Moreover, PL have ofcourse increased during lactation but without any impact of the lactation stage (p >0.05). Off the first lactation week and to a lesser extent in the last month, some studies have proved that the proportion of casein contained in proteins don t vary under lactation-stage effect17, whereas others20 have shown a very significant
content-variation in PL during lactation.
Duchacek et al.22 and Bousbia et al.23 have noticed that
FL differences are better marked than PL changes during the 17 first weeks of lactation.
Fatty acids profiles: Statistical analysis showed a significant
effect of lactation stage on milk FA profile with a highly effect on SFA and unsaturated ones (UFA) (p<0.0003), but for this last family, the effect is oriented mainly on mono-unsaturated fatty acids (MUFA), whereas it showed no significant effect (p>0.05) on the poly-unsaturated ones (PUFA).
The amount of SFA significantly increases from 60.73 % at early lactation up to 64.30% in midlactation (p<0.002) to reach a value of 66.16% in late lactation (p<0.03, Fig. 2). These
results are in accordance with those obtained by Legarto et al.18, Craninx et al.21 and Soyeurt et al.24, which
reported a 3 to 6 percent increase in the 4 to 6 lactation early months.
For milk transformers, the high SFA contents do improve conservation and stability of the final products by extending their shelf-life but maybe at the expense of the consumer s health increasing the risks of circulatory diseases19.
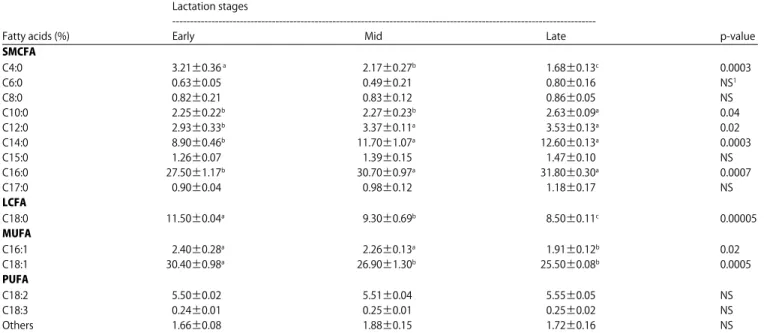
Among SFA, butyric acid (C4:0) highly decreased from early to late lactation (p<0.0003, Table 3). It comes out that the early lactation stage of cows milk from Algiers area are significantly richer in C4:0 than the mid and late lactation ones. These results are in accordance with some studys20,25-27.
Fig. 2: Milk fatty acids distribution according to lactation stage. *Significantly different (p<0.05), SFA: Short fatty acids, UFA: Unsaturated fatty acids, MUFA: Monounsaturated fatty acids, PUFA: Polyunsaturated fatty acids
Table 3: Means contents and significance of effects of lactation stage on milk fatty acids composition Lactation stages
---Fatty acids (%) Early Mid Late p-value
SMCFA C4:0 3.21±0.36 a 2.17±0.27b 1.68±0.13c 0.0003 C6:0 0.63±0.05 0.49±0.21 0.80±0.16 NS1 C8:0 0.82±0.21 0.83±0.12 0.86±0.05 NS C10:0 2.25±0.22b 2.27±0.23b 2.63±0.09a 0.04 C12:0 2.93±0.33b 3.37±0.11a 3.53±0.13a 0.02 C14:0 8.90±0.46b 11.70±1.07a 12.60±0.13a 0.0003 C15:0 1.26±0.07 1.39±0.15 1.47±0.10 NS C16:0 27.50±1.17b 30.70±0.97a 31.80±0.30a 0.0007 C17:0 0.90±0.04 0.98±0.12 1.18±0.17 NS LCFA C18:0 11.50±0.04a 9.30±0.69b 8.50±0.11c 0.00005 MUFA C16:1 2.40±0.28a 2.26±0.13a 1.91±0.12b 0.02 C18:1 30.40±0.98a 26.90±1.30b 25.50±0.08b 0.0005 PUFA C18:2 5.50±0.02 5.51±0.04 5.55±0.05 NS C18:3 0.24±0.01 0.25±0.01 0.25±0.02 NS Others 1.66±0.08 1.88±0.15 1.72±0.16 NS
1p>0.05, In each column, values (mean±SD) mentioned with different letters are significantly different (p<0.05) by using Duncan s test. The letter a corresponds to
the highest adjusted mean. In a same column, values with different letters differ significantly from each other. SMCFA: Short and medium chain fatty acids, LCFA: Long chain fatty acids, MUFA: Monounsaturated fatty acids, PUFA: Polyunsaturated fatty acids
Among SMCFA, lauric (C12:0), myristic (C14:0) and palmitic (C16:0) acids markedly increased in mid lactation (p<0.03, p<0.0009 and p<0.002 respectively) up to +0.44, +2.80 and +3.20% respectively, to get steady until late lactation. Stoop et al.26 mentioned an increase of C16:0
between early and mid lactation of +2.1%, which is in accordance with the trend observed in our study. Kay et al.25
and Bilal et al.27 highlighted the same trend for these FA from
early to mid lactation.
Lauric (C12:0), myristic (C14:0) and palmitic (C16:0) acids were proved to be the increase of total plasma and LDL cholesterol cause; therefore, their presence with high contents is unwanted28-30.
Stearic acid (C18:0) in high content at early lactation, linearly failed and decreased in mid (11.50 vs. 9.30%, p<0.0004) and in late lactation (9.30 vs. 8.50, p<0.03; Table 3). This trend is in accordance with the once obtained by Craninx et al.21, Stoop et al.26, Bilal et al.27 and
Bainbridge et al.31. A study showed the C18:0 protective
effects from some circulatory diseases32.
However, the high content in butyric acid compared to the other short-chain FA can be explained because its synthesis is not inhibited at all resulting from two inhibition-free Acetyl CoA Carboxylase sources: One half, comes directly from a four preformed carbon atoms group called $-hydroxybutyrate; the second half is formed through a free malonyl-CoA way using the condensation of the acetyl units5,33. The whole short-chain FA, derived from denovo
synthesis in the mammary gland, make up an important source of energy to the consumer as they are quickly synthesized in the digestive tract and then metabolized by liver33.
Moreover, UFAs and that of MUFAs decrease significantly from 39.27-35.70% from early to mid lactation (p<0.001) to reach 33.84% in late lactation (p<0.05) for the UFA and 33.52-29.94% from early to mid, to reach 28.05% in late lactation (p<0.0003) for MUFA (Fig. 2). Among this latter family, C18:1, known to be favourable to human health34
showed high contents at early lactation and a significant drop of 3.5% at mid lactation to be steady until late lactation (Table 3).
This result is in accordance with those of Palmquist et al.5, Duchacek et al.22, Kay et al.25, Stoop et al.26,
Nogalski et al.35, Samkova et al.36 and Stadnik et al.37,
who suggest that high content of C18:1 during early lactation could be explained by the fact that the dairy cow would be in a negative energetic balance situation with on one hand, a LCFA rallying increase from the adipose tissue reserves and
SMCFA de novo inhibition synthesis in the mammary gland and on the other hand, a weak ingested dietary amount, hence the poor availability of acetate and $-hydroxybutyrate FA precursors.
These changes may show a counterbalance between SMCFA concentrations and the circulatory lipids FA. Usually, these latter increases while C18:0 and C18:1 FA decrease during lactation development21,38. However, some
researchers noticed that C18:0 and a C18:1 rising in late lactation20,26.
These changes reveal some variations concerning the synthetic FA amounts in the mammary gland3. Indeed, studies
showed that FAs going from C4:0-C14:0 and about 50% of C16:0 result from de novo synthesis within mammary gland whereas LCFA, such as C18:1 come from in circulatory system lipids and result either from nutritional sources or from body lipids4,33.
On the other hand, linoleic (C18:2) and "-linolenic (C18:3) acids showed a little change during lactation (Table 3). These results are in accordance with those obtained by Legarto et al.18 wand Bitman and Wood38. Nevertheless,
Wang et al.39 noticed a 0.32% decrease of C18:2 from
early to late lactation but without significant difference concerning C18:3. Garnsworthy et al.20, Craninx et al.21 and
Nantapo et al.19 noticed a significant influence of lactation
stage over C18:2 and C18:3 content variation during lactation, especially as these latter are considered to be vital Fatty Acids and fundamental to Human Health30,40. Consequently,
the C18:2 high proportions noticed in this study, inform about the good nutritional quality and the PUFA richness of Algiers-milk.
SIGNIFICANCE STATEMENT
The aim of this study was to determine the influence of lactation stage on milk fatty acid profile from a variety of imported cow s races introduced in Algeria. The objective was to suggest the best lactation stage in order to increase for consumers the content of healthy fatty acids, with reducing those which are harmful. Results shown that, relatively to mid and late lactation stages, Algerian cow s milk from early lactation stage contain interesting nutritional qualities for consumers and dairy transformers.
ACKNOWLEDGMENTS
We are grateful to all farmers for their help, access to their dairy farms and assistance in obtaining research data.
Int. J. Dairy Sci., 12 (3): 236-242, 2017
REFERENCES
1. Jensen, R.G., A.M. Ferris and C.J. Lammi-Keefe, 1991. The composition of milk fat. J. Dairy Sci., 74: 3228-3243.
2. Jensen, R.G., 2002. The composition of bovine milk lipids: January 1995 to December 2000. J. Dairy Sci., 85: 295-350. 3. Chilliard, Y., A. Ferlay, R.M. Mansbridge and M. Doreau,
2000. Ruminant milk fat plasticity: Nutritional control of saturated, polyunsaturated, trans and conjugated fatty acids. Ann. Zootech., 49: 181-205.
4. Mansson, H.L., 2008. Fatty acids in bovine milk fat. Food Nutr. Res., Vol. 52. 10.3402/fnr.v52i0.1821
5. Palmquist, D.L., A.D. Beaulieu and D.M. Barbano, 1993. Feed and animal factors influencing milk fat composition. J. Dairy Sci., 76: 1753-1771.
6. Heck, J.M.L., H.J.F. van Valenberg, J. Dijkstra and A.C.M. van Hooijdonk, 2009. Seasonal variation in the Dutch bovine raw milk composition. J. Dairy Sci., 92: 4745-4755. 7. Benyounes, A., H.E. Bouriache and F. Lamrani, 2013. [Effect of
stage of lactation on the physical-chemical quality of milk from Holstein cows in the eastern region of Algeria]. Livest. Res. Rural Dev., Vol. 25.
8. Adjlane-Kaouche, S., R. Benhacine, F. Ghozlane and A. Mati, 2014. Nutritional and hygienic quality of raw milk in the mid-northern region of Algeria: Correlations and risk factors. Scient. World J. 10.1155/2014/131593
9. Boudalia, S., D. Benati, R. Boukharouba, B. Chemakh and M. Chemmam, 2016. Physico-chemical properties and hygienic quality of raw and reconstituted milk in the region of Guelma-Algeria. Int. J. Agric. Res., 11: 77-83.
10. Titouche, Y., A. Hakem, D. Salmi, B. Yabrir and N. Chenouf et al., 2016. Assessment of microbiological quality of raw milk produced at Tizi Ouzou area (Algeria). Asian J. Anim. Vet. Adv., 11: 854-860.
11. Yabrir, B., M. Labiad, A. Mostefaoui, A. Hakem, Y. Titouche, F. Gaucheron and A. Mati, 2016. [Free fatty acid profiles and cholesterol and lipid indexes of raw ewe s milk from two Algerian breeds (Ouled-Djellal and Rumbi), collected in the steppe area]. Biotechnol. Agron. Soc. Environ., 20: 17-24. 12. AFNOR., 2010. Lait et Produits Laitiers-Methodes
d Analyse. Association Francaise de Normalisation, France, ISBN: 978-2-12-190461-0..
13. ISO., 2014. Milk and milk products-determination of nitrogen content-Part 1: Kjeldahl principle and crude protein calculation. ISO 8968-1:2014, International Organization of Standardization (ISO), Geneva.
14. Paul, A.A. and D.A.T. Southgate, 1978. McCance and Widdowson's the Composition of Foods. 4th Edn., HMSO and Elsevier, London, Amsterdam, Pages: 417.
15. ISO., 2011. Animal vegetables fats and oils-gas chromatography of fatty acid methyl esters-Part 2: Preparation of methyl esters of fatty acids. ISO 12966-2: 2011, International Organization of Standardization (ISO), Geneva.
16. ISO., 2010. Milk-determination of fat content-gravimetric method (Reference method). ISO 1211: 2010, IDF 1: 2010, International Organization of Standardization (ISO), Geneva. 17. Coulon, J.B., Y. Chilliard and B. Remond, 1991. Effets du stade physiologique et de la saison sur la composition chimique du lait de vache et ses caracteristiques technologiques (aptitude a la coagulation, lipolyse). INRA Prod. Anim., 4 : 219-228. 18. Legarto, J., M. Gele, A. Ferlay, C. Hurtaud and
G. Lagriffoul et al., 2014. Effets des conduites d elevage sur la production de lait, les taux butyreux et proteique et la composition en acides gras du lait de vache, chèvre et brebis evaluee par spectrometrie dans le moyen infrarouge. INRA Prod. Anim., 27: 269-282.
19. Nantapo, C.T.W., V. Muchenje and A. Hugo, 2014. Atherogenicity index and health-related fatty acids in different stages of lactation from Friesian, Jersey and Friesian×Jersey cross cow milk under a pasture-based dairy system. Food Chem., 146: 127-133.
20. Garnsworthy, P.C., L.L. Masson, A.L. Lock and T.T. Mottram 2006. Variation of milk citrate with stage of lactation and
de novo fatty acid synthesis in dairy cows. J. Dairy Sci., 89: 1604-1612.
21. Craninx, M., A. Steen, H. van Laar, T. van Nespen, J. Martin-Tereso, B. de Baets and V. Fievez, 2008. Effect of lactation stage on the odd-and branched-chain milk fatty acids of dairy cattle under grazing and indoor conditions. J. Dairy Sci., 91: 2662-2677.
22. Duchacek, J., M. Vacek, L. Stadnik, J. Beran and M. Okrouhla, 2012. Changes in milk fatty acid composition in relation to indicators of energy balance in Holstein cows. Acta Univ. Agric. Silvicult. Mendel. Brunensis, 60: 29-37.
23. Bousbia A., F. Ghozlane, M. Benidir and B. Belkheir, 2013. Quantitative and qualitative response of dairy production of cattle herds to husbandry practices. Afr. J. Agric. Res., 8: 5622-5629.
24. Soyeurt, H., P. Dardenne, F. Dehareng, C. Bastin and N. Gengler, 2008. Genetic parameters of saturated and monounsaturated fatty acid content and the ratio of saturated to unsaturated fatty acids in bovine milk. J. Dairy Sci., 91: 3611-3626.
25. Kay, J.K., W.J. Weber, C.E. Moore, D.E. Bauman and L.B. Hansen et al., 2005. Effects of week of lactation and genetic selection for milk yield on milk fatty acid composition in holstein cows. J. Dairy Sci., 88: 3886-3893.
26. Stoop, W.M., H. Bovenhuis, J.M.L. Heck and J.A.M. van Arendonk, 2009. Effect of lactation stage and energy status on milk fat composition of Holstein-Friesian cows. J. Dairy Sci., 92: 1469-1478.
27. Bilal, G., R.I. Cue, A.F. Mustafa and J.F. Hayes, 2014. Effects of parity, age at calving and stage of lactation on fatty acid composition of milk in Canadian Holsteins. Can. J. Anim. Sci., 94: 401-410.
28. Barber, M.C., R.A. Clegg, M.T. Travers and R.G. Vernon, 1997. Lipid metabolism in the lactating mammary gland. Biochim. Biophys. Acta Lipids Lipid Metab., 1347: 101-126.
29. Williams, C.M., 2000. Dietary fatty acids and human health. Ann. Zootech., 49: 165-180.
30. Parodi, P.W., 2004. Milk fat in human nutrition. Aust. J. Dairy Technol., 59: 3-59.
31. Bainbridge, M.L., L.M. Cersosimo, A.D.G. Wright and J. Kraft, 2016. Content and composition of branched-chain fatty acids in bovine milk are affected by lactation stage and breed of dairy cow. PLoS ONE, Vol. 11. 10.1371/journal.pone.0150386 32. Hunter, J.E., J. Zhang and P.M. Kris-Etherton, 2010.
Cardiovascular disease risk of dietary stearic acid compared with trans, other saturated and unsaturated fatty acids: A systematic review. Am. J. Clin. Nut., 91: 46-63.
33. Palmquist, D.L., 2006. Milk Fat: Origin of Fatty Acids and Influence of Nutritional Factors Thereon. In: Advanced Dairy Chemistry Volume 2 Lipids, Fox, P.F. and P.L.H. McSweeney (Eds.). Springer, USA., pp: 43-92.
34. Lopez-Huertas, E., 2010. Health effects of oleic acid and long chain omega-3 fatty acids (EPA and DHA) enriched milks. A review of intervention studies. Pharmacol. Res., 61: 200-207.
35. Nogalski, Z., M. Wronski, M. Sobczuk-Szul, M. Mochol and P. Pogorzelska, 2012. The effect of body energy reserve mobilization on the fatty acid profile of milk in high-yielding cows. Asian-Aust. J. Anim. Sci., 25: 1712-1720.
36. Samkova, E., J. Spicka, M. Pesek, T. Pelikanova and O. Hanus, 2012. Animal factors affecting fatty acid composition of cow milk fat: A review. South Afr. J. Anim. Sci., 42: 83-100. 37. Stadnik, L., J. Duchacek, J. Beran, R. Tousova and M. Ptacek,
2015. Relationships between milk fatty acids composition in early lactation and subsequent reproductive performance in Czech Fleckvieh cows. Anim. Reprod. Sci., 155: 75-79. 38. Bitman, J. and D.L. Wood, 1990. Changes in milk fat
phospholipids during lactation. J. Dairy Sci., 73: 1208-1216. 39. Wang, T., J.J. Oh, J.N. Lim, J.E. Hong and J.H. Kim et al., 2013.
Effects of lactation stage and individual performance on milk
cis-9, trans-11 conjugated linoleic acids content in dairy cows. Asian-Aust. J. Anim. Sci., 26: 189-194.
40. Connor, W.E., 2000. Importance of n-3 fatty acids in health and disease. Am. J. Clin. Nutr., 71: 171S-175S.