Potential use of milk mid-infrared spectra to predict individual
1methane emission of dairy cows
2F. Dehareng1,a,b, C. Delfosse1,a, E. Froidmont2, H. Soyeurt3, C. Martin4, N.
3
Gengler3 , A. Vanlierde1 and P. Dardenne1
4 1
Valorisation of Agricultural Products Department, Walloon Agricultural Research 5
Centre, B-5030 Gembloux, Belgium 6
2
Department of Production and Sectors, Walloon Agricultural Research Centre, B-7
5030 Gembloux, Belgium 8
3
Animal Science Unit, Gembloux Agro Bio-Tech, University of Liège, B-5030 9
Gembloux, Belgium; National Fund for Scientific Research, B-1000 Brussels, 10
Belgium. 11
4
UR1213 Herbivores, INRAClermont-Theix Research Centre, France 12
13 a
These authors contributed equally to the study 14
b
Corresponding author: Frédéric Dehareng. E-mail: dehareng@cra.wallonie.be
15
16
ABSTRACT
18
This study investigates the feasibility to predict individual methane (CH4) 19
emissions from dairy cows using milk mid-infrared (MIR) spectra. To have a large 20
variability of milk composition, two experiments were conducted on 11 lactating 21
Holstein cows (2 primiparous and 9 multiparous). The first experiment aimed to 22
induce a large variation in CH4 emission by giving two different diets: the first one 23
was mainly composed of fresh grass and sugar beet pulp and the second one of 24
maize silage and hay. The second experiment consisted of grass and corn silage 25
with cracked corn, soybean meal and dried pulp. Twice a day, for each milking 26
period, the milk yields were recorded and a milk sample of 50 mL was collected from 27
each cow and analyzed by MIR spectrometry. Individual CH4 emissions were 28
measured daily using the SF6 method during a 7-day period. CH4 daily emissions 29
ranged from 10.2 to 47.1 g CH4/kg of milk. The spectral data were transformed to 30
represent an average daily milk spectrum (AMS), which was related to the recorded 31
daily CH4 data. By assuming a delay before the production of fermentation products 32
in the rumen and their use to produce milk components, five different calculations 33
were used: AMS at days 0, 0.5, 1, 1.5, and 2 compared to the CH4 measurement. 34
The equations were built using Partial Least Squares regression. From the calculated 35
R²cv, it appears that the accuracy of CH4 prediction by MIR changed in function of 36
the milking days. In our experimental conditions, the AMS at day 1.5 compared to the 37
measure of CH4 emissions gave the best results. The R² and SE of the cross 38
validation were equal to 0.79 and 5.14 g of CH4/kg of milk. The multiple correlation 39
analysis done in this study showed the existence of a close relationship between milk 40
fatty acid (FA) profile and CH4 emission at day 1.5. The lower square root of the R² 41
(R = 0.87) obtained between FA profile and CH4 emission compared to the one 42
corresponding to the obtained calibration (Rc = 0.93) shows the interest to apply 43
directly the developed CH4 equation instead of the use of correlations between FA 44
and CH4. In conclusion, our preliminary results suggest the feasibility of direct CH4 45
prediction from milk MIR-spectra. Additional research has the potential to improve the 46
calibrations even further. This alternative method could be useful to predict the 47
individual CH4 emissions at farm level or at regional scale and it also could be used to 48
identify low-CH4-emitting cows. 49
Keywords: methane, mid-infrared, milk, spectra, cows 50
51
IMPLICATIONS
52
Potential use of milk mid-infrared spectra to predict the individual methane
53
emission of dairy cows
By Dehareng et al. The disadvantages of existing methods
54for CH4 measurement are the financial and human costs and/or the practical 55
difficulties of these methods when they are used directly on field. The mid-infrared 56
spectrometry used for milk analysis corrects this inconvenient. Therefore, the aim of 57
this study was to develop an accurate and robust tool to predict the individual CH4 58
emission of dairy cows by using mid-infrared spectrometry. 59
INTRODUCTION 60
Livestock farming is right at the forefront of climate change issues. Agriculture is 61
regarded as the biggest producer of anthropogenic methane (CH4), mainly through
62
ruminant gas emissions (FAO, 2010). Enteric CH4 is produced by ruminants during 63
the microbial digestion of feed in the rumen. Methane contributes widely to global 64
warming, accounting for about 52 percent of the green house gases (GHG) 65
emissions in both developing and developed countries (FAO, 2010). Methane 66
absorbs 25 times as much infrared radiation than CO2 enlarging global warming 67
problems (Fuglestvedt, 2009). In addition to those environmental concerns, the 68
eructed CH4 induces a significant loss of gross energy intake for the animal. This gas 69
loss corresponds between 3 and 10% of gross energy intake (Johnson and Johnson, 70
1995, Jouany, 2008, Beauchemin et al., 2009). These losses are mainly explained by 71
the animal (age and species), the diet (intake level, composition) and the level of milk 72
production (Vermorel, 1995). However, individual variations between animals of the 73
same breed were reported in the range of 30-60% in production of CH4 /unit of feed 74
ingested when these animals received the same diet at equivalent ingestion and 75
production levels (Lassey et al., 1997). They are related to different rumen microbial 76
populations, coming from different ruminal kinetics salivation; rumination (Demeyer 77
and Fievez, 2000) and different feeding behaviors indicating interaction between 78
animals and their microbiota. Recent results suggest therefore a genetic component 79
in variation of individual CH4 production (Martin et al., 2010). However, most studies 80
showed that ruminants that are genetically different for feed efficiency (e.g., Hegarty 81
et al., 2007) and productivity showed reduced daily CH4 production (e.g., Bell et al., 82
2010). Given the complexity of this variation, large scale studies should be 83
conducted, but no in vivo method to measure CH4 emissions in ruminants is 84
sufficiently accurate to be applied on a large number of animals (Clark, 2010). Indeed 85
the available methods such as calorimeter or methane chambers, the tunnel system 86
and the sulfur hexafluoride (SF6) tracer technique, are not easy to use on farm and
87
are laborious to estimate individual methane production of many cows in a short 88
period. Therefore, a simpler and appropriate method is required to predict individual 89
CH4 emissions. For this, the method investigated here was based on the fact that 90
CH4 synthesis depends on the kind of rumen fermentation which also influences 91
many other parameters such as milk composition (Ørskov et al., 1969). 92
Carbohydrates are the most important source of energy and the primary precursors 93
of fat and lactose in cow’s milk.The end products of carbohydrates degradation are 94
the volatile fatty acids (VFA), CO2, CH4 and H2. Demeyer and Fievez (2000) have 95
developed an equation that shows clearly the relationship between VFA and CH4. 96
During the fermentation process acetate and butyrate promote CH4 production while 97
propionate maintains a competitive role for the use of hydrogen. According to 98
Miettinen and Huhtanen (1996), an increased ratio butyrate/propionate decreases the 99
lactose content and increases the fat content in milk and the rumen CH4 synthesis. 100
Thus, a relationship among CH4, lactose, and fat contents could be assumed as 101
suggested by Vlaeminck and Fievez (2005). In addition, the rumen VFA composition 102
also influences milk fat composition. In ruminants, the milk fatty acids (FA) come from 103
two sources, uptake from circulation and de novo synthesis within the mammary 104
gland. About one-half of the milk FA (molar percent) is derived from de novo 105
synthesis, based on acetate and butyrate (Bauman and Griinari, 2003). Short and 106
medium-chains FA (4 to 14 carbons) arise totally from de novo synthesis. Long-chain 107
FA (>16 carbons) are collected in the circulating lipids, and FA of 16 carbons depend 108
on these two sources (Bauman and Griinari, 2003). Thus, the proportions of different 109
FA reflect the ruminal fermentation via VFA and then CH4 production (Weill et al., 110
2008, 2009). Moreover, several authors have already reported, for different diets, 111
relationships between milk FA (measured by gas chromatography) and CH4 emission 112
of dairy cows (Chilliard et al., 2009; Dijkstra et al., 2010; Delfosse et al., 2010). These 113
results suggest that in general, CH4 emissions are linked to milk composition. As the 114
Mid-Infrared (MIR) spectrum reflects the milk composition (Soyeurt et al., 2006, 115
2011), it is logical to postulate that the MIR spectrum could predict directly the 116
individual emission of CH4. Therefore, the aim of this study was to have a first 117
evaluation of the potential use of milk spectra obtained by Fourier Transform 118
InfraRed analysis (FTIR) apparatus directly to predict the quantities of CH4 eructated 119
by individual dairy cows. The development of a MIR CH4 equation will permit to 120
predict and therefore to study at large scale the methane emission of dairy cows 121
because the MIR technology is already implemented in milk labs to quantify the major 122
milk components used for the milk payment and the routine milk recording. 123
MATERIALS AND METHODS
124
Animals and Diets 125
Two experiments were carried out with different experimental conditions in 126
order to maximize the variability of individual CH4 emission needed to establish a 127
robust calibration model. 128
In the first experiment, 2 primiparous and 6 multiparous (3 of 2nd lactation and 129
3 of 3rd lactation) lactating Holstein cows were divided into two groups of four cows 130
each. At the beginning of the trial, the groups were similar in terms of lactation stage 131
(180 days in milk) and of average milk production (17.4 ± 3.9 kg/d). Two isoenergetic 132
experimental diets (17 kVEM) were offered according to a 2x2 cross-over design. 133
Experimental diets were fed twice daily at 0900 and 1600 as total mixed rations 134
(TMR). The diets were fed at an intake level of 18.5 kg/d and aimed at producing 20 135
kg/d of milk. Diet 1 consisted of: fresh-cut pasture grass (third cutting, Holcus 136
lanatus), 550 g/kg DM; dried beet pulp, 200 g/kg DM; soybean meal, 150 g/kg DM; 137
and soybean hulls, 100 g/kg DM. Diet 2 consisted of: corn silage, 400 g/kg DM; 138
meadow hay, 200 g/kg DM; cracked corn, 130 g/kg DM; rapeseed meal, 150 g/kg 139
DM; palm meal, 55 g/kg DM; soybean meal, 55 g/kg DM; a 50:50 mix of coconut and 140
flaxseed oil, 10 g/kg DM. Both diets contained a mixture of vitamins and minerals. 141
In the second experiment, 3 multiparous (2 of 2nd lactation and 1 of 4th 142
lactation) lactating Holstein cows with a similar milk production (26.2 ± 1.9 kg/d) were 143
fed with a same basal diet, with an intake level of 20.3 kg/d. This diet (TMR) 144
consisted of grass silage, 520 g/kg DM; corn silage; 130 g/kg DM; cracked corn, 130 145
g/kg DM; soybean meal, 110 g/kg DM; and dried beet pulp 110 g/kg DM. 146
For both experiments, the adaptation period was 21 days and milk and CH4 147
samples were then collected from day 22 to day 28. Fresh water was available at all 148
times. 149
All the procedures used involving the animals were approved by the regional 150
ethics committee in animal experimentation (protocol CRAW09/01). 151
Sampling and Analyses 153
Milk yield was recorded daily at each sampling period at 0730 and at 1630. A 154
50 mL aliquot of milk, containing sodium azide (0.32 g/L), was stored at 4°C until 155
infrared analyses. The sample stored at 4°C was analyzed by a FTIR Lactoscope 156
spectrometer (Delta Instruments, Drachten, the Netherlands). The Lactoscope works 157
within 925 to 3000 cm-1 and uses an interferometer. This instrument gave the 158
spectral data as well as the direct measurement of milk components such as lactose, 159
protein, fat, non protein nitrogen (NPN; considered to be essentially urea). Fatty acid 160
composition predictions were also obtained based on equations specific to this 161
machine. Table 1 presents the statistical parameters of these equations. For each FA 162
equations, the standard error of cross-validation (SECV) given by the FTIR 163
Lactoscope equations are included between those given by Soyeurt et al. (2006) and 164
those of Soyeurt et al. (2011). A total of 154 samples were collected and analyzed 165
(spectra were in triplicate). 166
Quantification of CH4
167
During the 7-day period, the SF6 gas tracer technique was used according to 168
the method described by Martin et al. (2008) to measure the individual production of 169
enteric CH4 by the studied cows. Briefly, a calibrated permeable tube containing ultra 170
pure SF6 was placed in the rumen of each cow before the experimental period. The 171
average release rate of SF6 from the tubes was 1189.5 ± 168.6 ng/min. 172
A representative of breath gas sample, containing respired and eructated gas, 173
was collected through a capillary tube situated between the nostril and the mouth of 174
each animal thanks to an halter. This gas sample was stored in a canister located 175
near the animal (more or less one meter) in a way that the animal could not touch it. 176
The canister was changed daily after morning feeding and the CH4 and SF6 177
concentrations were analyzed using gas chromatography (GC) (Martin et al., 2008). 178
A GC (Varian-Chrompack, CP-9003, Les Ulis, France) fitted with an electron 179
capture detector (ECD) (Perkin Elmer instruments; Autosystem XL, Courtaboeuf, 180
France) and with a flame ionisation detector (FID) was used to determine the 181
concentrations of SF6 and CH4, respectively. The samples were run on GCs 182
equipped either with a Molecular Sieve 0.5 nm column (3 m × 3.2 mm i.d) maintained 183
at 50°C for the SF6, or with a Porapak N 80-100 mesh column (3 m × 3.2 mm i.d.) 184
maintained at 40°C for the CH4. The flow rate of the carrier gas was 30 mL/min of N2 185
for the SF6 and 40 mL/min of He for CH4. Chromatographic analyses were performed 186
after calibration with standard gases (Air Liquide, Mitry-Mory, France) for SF6 (55 and 187
195 ppt) and CH4 (100 ppm). 188
To determine the released amount of CH4 (QCH4), the concentration of SF6 and 189
CH4 (CCH4 and CSF6) in the canister and the pre-determined released rate of SF6 190
(QSF6) were used. In parallel to each daily measurement, the concentration of the
191
atmospheric air (CbCH4 and CbSF6) determined with another canister was subtracted
192 (Johnson et al., 1994): 193
where MWCH4 and MWSF6 are the molecular weight of CH4 and SF6, 194
respectively. 195
The CH4 emission was therefore expressed in g of CH4/day and re-expressed 196
later in g of CH4/kg of milk thanks to the recorded milk yield because the global daily 197
CH4 production is linked to productivity. 198
199
Spectral Data Treatment 200
Each cow was milked twice daily providing two individual samples, which were 201
analyzed by MIR, thus 2 spectra, whereas individual CH4 emission was measured 202
once daily. Therefore, to build the calibration model, the recorded spectral data were 203
transformed to represent one daily spectrum related to one daily CH4 record. The 204
methodology used to create the average milk spectra (AMS) was tested by 205
comparing MIR predictions obtained from AMS and the real spectral data obtained 206
from the infrared analysis of a representative daily milk sample (i.e., 50% of morning 207
and 50% of evening milks). This ratio was chosen because it corresponds to the 208
averaging used during the majority of milk recording process. Alternatively, the 209
weighted average was also tested. It corresponded to the average of the two milk 210
spectra of the day in proportion to the amount of milk produced by the cow in each 211
respective milking (AM and PM). The reason for this was that a weighted average 212
represented better the biological background of the process. 213
A dynamic relationship between milk composition (and, therefore, spectral 214
data) and CH4 was considered by assuming that there is a delay between the 215
production of fermentation products and their use to produce milk components. 216
Consequently, different ways exist to define the AMS. Indeed, the spectral data used 217
to create the average milk spectra can be generated by the milk analysis of samples 218
collected at different times compared to the time of CH4 measurement. The average 219
milk spectra were calculated from five methods averaging always two samples which 220
are illustrated in Figure 1: 221
- the same day of CH4 measurement (day 0), 222
- evening of the same day and morning next day (day 0.5), 223
- next day (day 1), 224
- evening next day and morning 2 days later (day 1.5), 225
- and 2 days later (day 2). 226
Always two samples were averaged to reflect a whole test-day in the milk as whole 227
day was also represented in the CH4 measurements. 228
Given the stability of diets and the high degree of auto-correlation that can be 229
therefore assumed across values for the five methods, the objective of this was not 230
infer a definitive response what the delay between the production of fermentation 231
products and their use to produce milk components, but to find retrospectively which 232
definition of the AMS gives the best predictions under the condition of this study. 233
Calibration Model 234
As mentioned previously, a calibration set with a large spectral variability is 235
required to develop robust calibration models. Therefore, a principal component 236
analysis (PCA) was carried out on available spectra at day 0 in order to illustrate the 237
spectral variation observed from the collected milk samples. 238
The calibration models were developed by Foss WINISI 4 software from the 239
recorded spectral and CH4 data using Partial Least Squares regressions (PLS). The 240
spectral regions used for that were: 972-1,589 cm-1, 1,720-1,782 cm-1, and 2,746-241
2,970 cm-1. No additional pre-treatment was applied on spectral data because with a 242
derivative, results were not significantly better probably due to the fact that only one 243
spectrometer was used in this experiment. The number of factors used was 244
determined by a full cross-validation (with N observations, create N models by 245
removing N time one sample which is predicted by the others N-1), which was also 246
used to estimate its robustness. The accuracy of the resulting calibration models was 247
evaluated by calculating the calibration coefficient of determination (R²c), cross-248
validation coefficient of determination (R²cv), standard error of calibration (SEC), and 249
the standard error of cross-validation (SECV). The predictability of the calibration was 250
evaluated through the ratio of performance to deviation (RPD; SD/SECV where SD 251
was the standard deviation of the CH4 measures). The RPD should be as high as 252
possible; values between 5 and 10 are adequate for quality control, and values > 2.5 253
are satisfactory for screening breeding programs (Williams and Sobering, 1993). 254
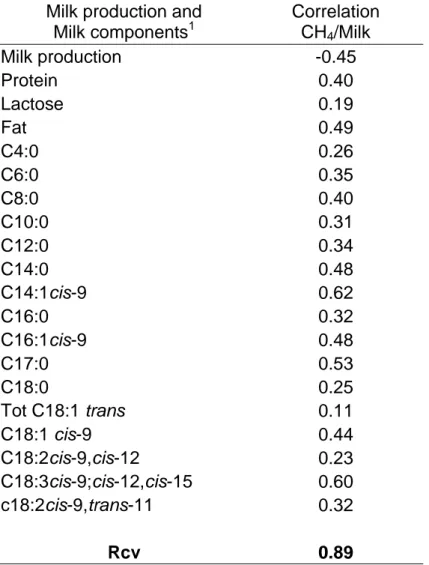
Correlations with Milk Components 255
To show the interest of using a new direct MIR equation to quantify the CH4 256
emissions, the best correlation between milk components already predicted by MIR 257
and CH4 was calculated. In this way, it was possible to verify whether the predicted 258
CH4 production data obtained by the developed calibration equation were due to new 259
recombination of global spectral information or just to specific milk components 260
already predicted by MIR and whose the equations are available. If the cross-261
validation correlation is higher than the correlation between CH4 and specific MIR 262
milk component, it can be assumed that the developed equation provides additional 263
information than the simple correlation between CH4 and the already predicted milk 264
components. 265
RESULTS AND DISCUSSION
266
Spectral Variation 267
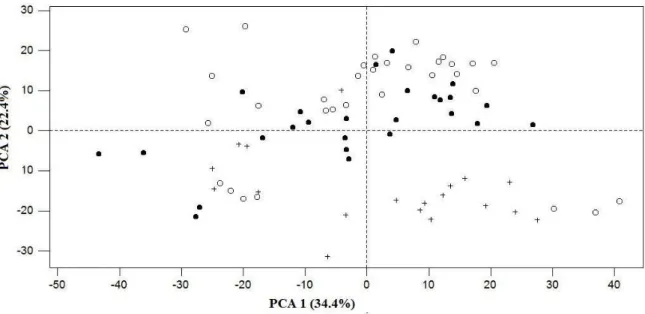
The first two principal components described 56.8% of the total variation 268
observed in the studied data set (N = 77). These principal components (Figure 2) 269
were used to illustrate the spectral differences of studied milk samples. Spectra from 270
cows feeding with different diets (i.e., grass silage, corn silage and fresh pasture) are 271
separated (Figure 2). Based upon the literature (Collomb et al., 2002), this suggests 272
that the use of different diets involved a change in milk composition and therefore in 273
the milk spectral data. Moreover, Table 2, with descriptive statistics, also shows high 274
variations of milk composition primarily fat, protein, lactose, and saturated fatty acids 275
(SAT). This variability of spectral data is needed to develop a robust calibration 276
equation. 277
Table 2 also shows the variability of CH4 expressed in g/day and g/kg of milk. 278
The coefficients of variation were 29.84% and 33.33%, respectively. This large 279
variation could be explained partly by the use of three different diets. A slightly larger 280
variation was observed for the CH4 emission expressed in g of CH4/kg of milk 281
because the definition of this trait took into account simultaneously the variability of 282
CH4 and milk yield. 283
284
Spectral Data Treatment 285
As mentioned previously, for each cow, two spectra measurements and one 286
CH4 measurement were available. In order to have one spectrum for one measure of 287
CH4, the collected spectral data from morning and evening milk samples were 288
averaged. To validate the methodology, the contents of major milk components (i.e., 289
fat, protein, lactose, true protein, and NPE) predicted from AMS derived from 50% 290
morning and 50% evening spectral data and from the spectral data obtained from the 291
infrared analysis of a representative 24h milk sample were compared. Table 3 shows 292
no significant difference (P > 0.005) in milk components predicted by AMS and by the 293
24h spectral data. Therefore, AMS was considered similar to the spectrum of the 294
representative 24h milk sample showing the pertinence of the method used to create 295
the AMS. 296
Calibration Model 297
Different equations were built to predict the quantity of CH4 produced per day 298
in function of the five different possibilities used to create AMS as shown in Figure 1. 299
Erreur ! Source du renvoi introuvable. presents the statistical parameters obtained for
300
the 20 developed calibration equations. The prediction of CH4 by MIR, based on 301
R²cv, was better by considering g of CH4/kg of milk instead of g of CH4/day 302
(R²cv=0.79 vs. R²cv=0.73). This could be explained by the fact that the expression 303
unit g of CH4/kg of milk compared to g of CH4/day takes into account the milk 304
production, which is directly related to the release of CH4 by cow (Vermorel, 1995) 305
and, therefore, reflected in the spectral data thanks to the dilution effect known for 306
the majority of milk components. For instance, the literature shows that the contents 307
of major milk components such as fat, protein, and fatty acids (Soyeurt et al., 2009) 308
are negatively correlated with the milk yield. Table 4 shows also that the use of a 309
ratio taking into account the milk produced during the evening and morning milkings 310
for the calculation of AMS compared to the ratio 50% of morning and 50% of evening 311
spectral data gave better results. This could be explained by the relationship between 312
the milk production and the CH4 emission by dairy cows (Vermorel, 1995). Therefore, 313
the equations using the CH4 content expressed in g/kg of milk and the morning and 314
evening milk AMS gave the best results. 315
The interval between the measurement of CH4 by the SF6 tracer method and 316
the spectral data used (Figure 1) gave different results (Table 4). By observing the 317
last 5 lines of Table 4, the day 1.5 gave the best result for the internal validation (i.e., 318
R²cv=0.79). The best equation seems to be the one built from the AMS created from 319
the weighted average taking into account the milk produced, the CH4 content 320
expressed in g/kg of milk, and an interval between the measurement of CH4 and the 321
spectral data equal to 1.5 day. This equation also seemed to be the most robust 322
because the difference between R²c and R²cv was the lowest (0.08). These results 323
are only first indications of the delayed response of milk composition to rumen 324
fermentation. More research is needed in other experimental conditions; for instance 325
by inducing the inhibition of the rumen methanogenesis and observing the milk 326
spectra modifications in the next few days.. 327
Even if this study must be validated on a larger data set, the obtained results 328
suggest a clear indirect link between the CH4 emission and the milk composition 329
through the direct use of the MIR spectral data. Chilliard et al. (2009) also showed 330
this relation through the link between the contents of milk FA analyzed by GC and the 331
production of CH4 by dairy cows fed with diets supplemented or not with linseeds. 332
The present study also shows the feasibility of the MIR prediction of CH4 produced by 333
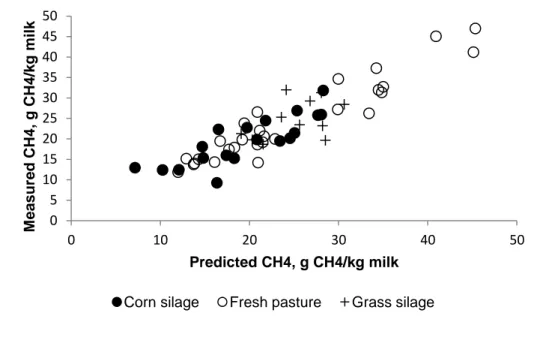
dairy cows and a relative robustness of the developed equation. Indeed, despite of 334
the large variation observed for g of CH4/kg of milk produced per cow and per diet 335
over the study period and the observed variability of milk composition (Table 2), the 336
MIR CH4 predictions were good and R²c and R²cv were never below to 0.77 and 337
0.68, respectively. Moreover, CH4 prediction did not seem to be affected (Figure 3) 338
by the different kind of diets used during the experiments (one consisting of corn 339
silage, another of pasture grass and other of grass silage). However, it seems that 340
the pasture grass diet contributes mainly to the large variation in CH4 emissions. This 341
variation between animals for this diet could be due to the season and therefore a 342
higher lignification of grass at the end of the experimentation. Also individual, e.g. 343
genetic, differences among the animals could be the reason for these results. In 344
order to be able to make a generalisation of the prediction, it is important to continue 345
to collect data on different diets. Finally, The RPD, which relates the standard error of 346
prediction to the standard deviation of the original reference data, was equal to 2.19 347
suggesting a good robustness of the prediction. Indeed, Williams and Sobering 348
(1993) show that a value of 2.5 and over are satisfactory for screening. Therefore, 349
using this equation, it is currently feasible to classify the dairy cows in two groups: 350
low and high CH4 producers. More variability in the available data can improve the 351
ability of the equation to predict CH4 emission. Potential use of data obtained from 352
genetically diverse animals, fed on different diets and producing in diverse 353
management, should allow improving the equations. 354
Correlations with Milk Components 355
Due to the strong indirect link existing between CH4 emissions and the overall 356
milk composition, it was expected that CH4 emissions would correlate strongly with 357
milk production and milk components already predicted by MIR and whose equations 358
are available (Table 5). Despite what was expected (Miettinen and Huhtanen, 1996) 359
a low correlation was observed between lactose and CH4 emissions. This is probably 360
because the lactose concentration is less and milk yield is more responding to 361
variation in propionate supply. Nevertheless Rcv for the best equation is always 362
superior to the correlation obtained from milk production and MIR milk components 363
suggesting that the developed equation provides additional information. 364
A multiple correlation (Table 6) was built starting from the parameters 365
appearing in Table 5 to predict CH4 production/kg of milk for the day +1.5. The 366
square root of the R² (R = 0.87) was lower than the square root of the R²c value (Rc 367
= 0.93) obtain by the equation for this parameter in Table 4. In addition, the results 368
presented in Table 6 suggest the existence of a close relationship between FA 369
profiles and CH4 emission, as previously reported by Chilliard et al. (2009). However, 370
our first results showed that the use of the full spectral data gave more information. In 371
the future, the use of more precise equations for the prediction of the FA, could help 372
us to understand more in detail the role of each FA and infirm or confirm these 373
observation. In fact, the precision (SECV) of our FA equations could be upgraded 374
and met at least the precision obtain by Soyeurt et al. (2011). This underlines the 375
practical interest to use MIR spectra to predict individual CH4 emission of dairy cows. 376
CONCLUSION
377
The results of our study tended to show that the prediction of CH4 emissions 378
prediction from milk spectra is feasible. This is partially explained, by the fact, that the 379
milk spectrum reflects the milk composition which is considered linked to CH4, due 380
the relationship of both phenomena to ruminal fermentation. Results from this study 381
showed that CH4 is better predicted, based on R²cv, with the weighted AMS built 382
from spectral data collected at the day 1.5 compared to the moment of CH4 383
measurement. Additional studies providing data from genetically diverse animals and 384
different breeds, fed on different diets and producing in diverse managements are 385
needed to improve the obtained RPD and therefore clarify and potentially confirm the 386
initial relationship which is reported in this study. 387
The calibration results indicated that the best equation could be used for 388
screening purposes, differentiating high and low methane producers, even if addition 389
research is still required to make it more reliable and potentially implementable on 390
other spectrometers. Once this being achieved, as the existing methods for CH4 391
measurement are difficult to apply on a large scale, this alternative method has the 392
potential to be very useful to predict CH4 emission for dairy herds at individual cow 393
level from milk MIR spectra. These required data are already taken and used for the 394
milk recording and the milk payment. Through the large scale generation of predicted 395
CH4 emission data, the method could help improve the knowledge about the sources 396
of CH4 variation (genetic or not) and about its link to other traits of interest. 397
398
ACKNOWLEDGEMENTS
399
The authors gratefully acknowledge the financial support of the Ministry of 400
Agriculture of the Walloon Region of Belgium [Service Public Wallon, Direction 401
générale opérationnelle "Agriculture, Ressources naturelles et Environnement" 402
(DGO3), Direction de la Recherche; Namur, Belgium] and Delta Instruments who 403
provided gracefully a FTIR Spectrometer. The authors thank to M. Didelez and the 404
bovine group for their technical assistance, Y. Rochette for the laboratory gas 405
analysis and M. Doreau for his help in the elaboration of the first experiment protocol. 406
Hélène Soyeurt and Nicolas Gengler, who are Post-doctoral Researcher and Senior 407
Research Associate of the National Fund for Scientific Research (Brussels, Belgium), 408
acknowledge their support. 409
REFERENCES
410
Beauchemin KA, McAllister TA and McGinn SM 2009. Dietary mitigation of enteric methane
411
from cattle. CAB Reviews: Perspectives in Agriculture, Veterinary Science, Nutrition and
412
Natural Resources, 4, 035, 1-18.
413
Bauman DE and Griinari JM 2003. Nutritional regulation of milk fat synthesis. Annual Review
414
of Nutrition 23, 203-227.
415
Bell MJ, Wall E, Russell G, Morgan C and Simm G 2010. Effect of breeding for milk yield,
416
diet and management on enteric methane emissions from dairy cows. Animal Production
417
Science 50, 817-826.
Chilliard Y, Martin C, Rouel J,and Doreau M 2009. Milk fatty acids in dairy cows fed whole
419
crude linseed, extruded linseed, or linseed oil, and their relationship with CH4 output. Journal
420
of Dairy Science 92, 5199-5211.
421
Clark H 2010. Animal vs. Measurement technique variability in enteric methane production –
422
is the measurement resolution sufficient ? In Proceedings of the 4th International Conference
423
on Greenhouse Gases and Animal Agriculture (eds EJ Mc Geough and SM McGinn), pp. 48.
424
Banff, CA.
425
Collomb M and Buhler T 2000. Analyse de la composition en acides gras de la graisse de
426
lait. I. Optimisation et validation d’une méthode générale à haute résolution. Mitteilungen aus
427
Lebensmitteluntersuchung und Hygiene 91, 306-332.
428
Collomb M, Bütikofer U, Sieber R, Jeangros B and Bosset J-O 2002. Correlation between
429
fatty acids in cows’ milk fat produced in the Lowlands, Mountains and Highlands of
430
Switzerland and botanical composition of the fodder. International Dairy Journal 12, 661-666.
431
Delfosse C, Froidmont E, Fernandez Pierna JA, Martin C and Dehareng F 2010. Estimation
432
of methane emission by dairy cows on the basis of milk composition. In Proceedings of the
433
4th International Conference on Greenhouse Gases and Animal Agriculture (eds EJ Mc
434
Geough and SM McGinn), pp. 168. Banff, CA.
435
Demeyer D and Fievez V 2000. Ruminants et environnement : la méthanogenèse. Annales
436
de Zootechie 49, 95-112.
437
Dijkstra J, Apajalahti JA, Bannink A., Gerrits WJJ, Newbold JR, Perdok HB, van Zijderveld
438
SM and Berends H 2010. Relationship of milk fatty acid profile with methane production in
439
dairy cattle. In Proceedings of the 4th International Conference on Greenhouse Gases and
440
Animal Agriculture (eds EJ Mc Geough and SM McGinn), pp. 169. Banff, CA.
FAO. 2010. New FAO report assesses dairy greenhouse gas emissions. Retrieved
442
November, 2011, from http://www.fao.org/news/story/en/item/41348/icode/
443
Fuglestvedt J 2009. Impacts of Metric Choice on Analyzing the Climate Effects of Emissions.
444
In IPCC Expert Meeting on the Science of Alternative Metrics, pp. 40-47. Oslo, Norway.
445
Hegarty RS, Goopy JP, Herd RM and McCorkell B 2007. Cattle selected for lower residual
446
feed intake have reduced daily methane production. Journal of Animal Science 85,
1479-447
1486.
448
ISO, 2001. Milk and milk products. Extraction methods for lipids and liposoluble compounds.
449
Int. Stand. ISO 14156, IDF 172 Int. Dairy Fed. Brussels, Belgium.
450
ISO, 2002. Milk fat. Preparation of fatty acid methyl esters. Int. Stand. ISO 15884, IDF 182
451
Int. Dairy Fed. Brussels, Belgium.
452
Johnson KA, Huyler M, Westberg H, Lamb B and Zimmerman P 1994. Measurement of CH4
453
emissions from ruminant livestock using a sulphur hexafluoride tracer technique.
454
Environmental Science & Technology 28, 359-362.
455
Johnson KA and Johnson DE 1995. Methane emissions from cattle. Journal of Animal
456
Science 73, 2483-2492.
457
Jouany JP 2008. Enteric CH4 production by ruminants and its control. In Gut efficiency; the
458
key ingredient in ruminant production. Elevating animal performance and health (eds S
459
AndrieuandD Wilde), pp. 35-59. Wageningen Academic Publishers, NL.
460
Lassey KR, Uylatt MJ, Martin RJ, Walker CF and Shelton ID 1997. Methane emissions
461
measured directly from grazing livestock in New Zealand. Atmospheric Environment 31,
462
2905-2914.
Martin C, Rouel J, Jouany JP, Doreau M and Chilliard Y 2008. Methane output and diet
464
digestibility in response to feeding dairy cows crude linseed, extruded linseed, or linseed oil.
465
Journal of Animal Science 86, 2642-2650.
466
Martin C, Doreau M, Morgavi DP 2010. Methane mitigation in ruminants: from microbe to the
467
farm scale. Animal 4, 351-365.
468
Miettinen H and Huhtanen P 1996. Effects of the ration of ruminal propionate to butyrate on
469
milk yield and blood metabolites in dairy cows. Journal of Dairy Science 79, 851-861.
470
Soyeurt H, Dardenne P, Dehareng F, Lognay G, Veselko D, Marlier M, Bertozzi C, Mayeres
471
P and Gengler N 2006. Estimating Fatty Acid Content in Cow Milk Using Mid-Infrared
472
Spectrometry. Journal of Dairy Science 89, 3690-3695.
473
Soyeurt H, Dardenne P, Dehareng F, Bastin C and Gengler N 2009. Genetic Parameters of
474
Saturated and Monounsaturated fatty acid content and the ratio of saturated to unsaturated
475
fatty acids in bovine milk. Journal of Dairy Science 91, 3611-3626.
476
Soyeurt H, Dehareng F, Gengler N, McParland S, Wall E, Berry DP, Coffey M and Dardenne
477
P 2011. Mid-Infrared Prediction of Bovine Milk Fatty Acids across Multiple Breeds,
478
Production Systems and Countries. Journal of Dairy Science 94,1957-1667
479
Vermorel M 1995. Emissions annuelles de méthane d’origine digestive par les bovins en
480
France : Variation selon le type d’animal et le niveau de production. INRA Productions
481
Animales 8, 265-272.
482
Vermorel M 1997. Emissions annuelles de méthane d’origine digestive par les ovins, les
483
caprins et les équins en France. INRA Productions Animales 10, 153-161.
Vlaeminck B and Fievez V 2005. Milk odd and branched-chain fatty acids to predict ruminal
485
methanogenesis in dairy cows. Communications in Agricultural and Applied Biological
486
Sciences 70, 43-7.
487
Weill P, Kerhoas N, Chesneau G, Schmitt B, Legrand P and Rennaud JP 2008. Existe t-il un
488
lien entre production de méthane par les vaches laitières et profil en acides gras des
489
laits ? Nutrition clinique et métabolisme 22, 71-72.
490
Weill W, Chesneau G, Chilliard Y, Doreau M and Martin C 2009 June 24, Method for
491
evaluating the amount of CH4 produced by a dairy ruminant and method for decreasing and
492
controlling this amount. World Patent WO/2009/156453.
493
Williams PC and Sobering DC 1993. Comparison of commercial near infrared transmittance
494
and reflectance instruments for the analysis of whole grains and seeds. Journal of Near
495
Infrared Spectroscopy 1, 25-33.
496 497
498 499
Table 1 Estimated statistical parameters for each calibration equation that
500
estimated the concentrations of fatty acid in milk (g / dl milk) used in this study 501
Fatty acids (g/dL of milk) N Mean SD SEC R²C SECV R²CV RPD
C4:0 137 0.11 0.03 0.01 0.82 0.01 0.73 1.93 C6:0 138 0.08 0.02 0.01 0.86 0.01 0.82 2.32 C8:0 131 0.05 0.01 0.00 0.86 0.01 0.81 2.33 C10:0 137 0.11 0.04 0.01 0.9 0.02 0.84 2.52 C12:0 138 0.13 0.05 0.02 0.88 0.02 0.84 2.48 C14:0 136 0.45 0.12 0.03 0.93 0.04 0.88 2.9 C14:1 138 0.04 0.02 0.01 0.66 0.01 0.58 1.52 C16:0 139 1.19 0.35 0.09 0.93 0.11 0.89 3.06 C16:1 143 0.08 0.04 0.02 0.82 0.02 0.77 2.06 C17:0 138 0.03 0.01 0.00 0.84 0.01 0.72 1.89 C18:0 138 0.39 0.15 0.07 0.79 0.07 0.76 2.05 C18:1 trans 138 0.10 0.04 0.02 0.67 0.03 0.55 1.49 C18:1 cis-9 138 0.80 0.42 0.08 0.97 0.09 0.95 4.5 Total C18:1 cis 138 0.87 0.43 0.07 0.98 0.08 0.97 5.38 Total C18:2 143 0.09 0.03 0.01 0.7 0.02 0.6 1.58 C18:2 cis-9,cis-12 142 0.06 0.02 0.01 0.77 0.01 0.7 1.83 C18:3 cis-9,cis-12,cis-15 138 0.02 0.01 0.01 0.52 0.01 0.4 1.29 C18:2 cis-9,trans-11 139 0.03 0.02 0.01 0.5 0.01 0.36 1.24 Saturated FA 132 2.72 0.72 0.06 0.99 0.07 0.99 10.57 Monounsaturated FA 135 1.12 0.46 0.06 0.98 0.07 0.98 6.45
SD : Standard deviation; SEC: Standard error of calibration; R²C : Calibration coefficient of determination;
502
SECV: Standard error of cross-validation; R²CV : Cross-validation coefficient of determination;RPD : Ratio of
503
standard error of cross validation to standard deviation 504
505 506
Table 2 Means and range of CH4 emissions, production and composition of
507
the milk, saturated fatty acid composition of the milk fat for the two experiments (day 508
0) 509
Components N Mean Minimum Maximum Std dev
CH4, g/d 77 429 218 653 128 g/kg milk 77 21.9 10.2 47.1 7.3 Milk, kg/d 77 19.7 12.5 30 5.1 Milk Composition, g/kg Fat 77 4.11 2.86 5.63 0.61 Protein 77 3.40 2.39 4.82 0.42 Lactose 77 4.67 3.69 5.21 0.27
Milk Fat composition, g/kg
SAT 77 66.1 55.4 76.9 5.2
510
511
Table 3 Comparison between components prediction for average milk spectra
512
(AMS) and spectra of average milk in a ratio 50-50 for 37 milk sample during the 513
second experiment 514
Components N AMS Average milk P<
Fat milkpredicted,g/kg 37 4.33 4.37 NS2
Proteinpredicted,g/kg 37 3.28 3.28 NS
Lactosepredicted, g/kg 37 0.037 0.034 NS
True proteinpredicted, g/kg 37 3.31 3.33 NS
NPN1predicted,mg/100g milk 37 21.75 20.69 NS 1 Non Protein Nitrogen
515
2 NS: P>0.05 516
Table 4 Evolution of accuracy of the resulting calibration with the different kind
517
of average milk spectra (AMS) with a ratio 50-50 and a weighted average for the two 518
experiments. The number of available data depends on the chosen day 519
Ratio Day N R²c R²cv SEC SECV RPD
Ratio 50-50 g of CH4 Day 0 77 0.84 0.71 73.00 98.30 1.84 Day 0.5 71 0.81 0.68 79.39 105.19 1.77 Day 1 65 0.84 0.72 71.73 98.29 1.88 Day 1.5 60 0.77 0.70 87.77 100.65 1.83 Day 2 59 0.77 0.72 86.19 95.23 1.89 g of CH4/kg of milk Day 0 77 0.80 0.72 4.81 5.69 1.91 Day 0.5 71 0.83 0.77 4.39 5.69 2.06 Day 1 65 0.86 0.69 4.16 6.13 1.81 Day 1.5 60 0.85 0.75 4.25 5.61 2.01 Day 2 59 0.93 0.72 3.06 6.05 1.89 Ratio defined from morning and evening milk yields produced g of CH4 Day 0 77 0.85 0.72 68.97 95.93 1.90 Day 0.5 71 0.83 0.73 74.82 95.45 1.92 Day 1 65 0.85 0.69 71.55 102.21 1.80 Day 1.5 60 0.78 0.71 86.89 99.20 1.85 Day 2 59 0.77 0.72 85.81 83.81 1.89 g of CH4/kg of milk Day 0 77 0.89 0.75 3.52 5.42 2.00 Day 0.5 71 0.86 0.78 3.96 5.00 2.12 Day 1 65 0.84 0.69 4.35 6.22 1.78 Day 1.5 60 0.87 0.79 4.06 5.14 2.19 Day 2 59 0.90 0.73 3.59 5.94 1.93
SEC: Standard error of calibration; SECV: Standard error of cross-validation; RPD: ratio of performance to 520
deviation 521
523
Table 5 Individual correlations between different milk parameters and the
524
CH4/kg of milkproduced for the day1.5. Rcv = square root of the R²cv value
525
Milk production and Milk components1 Correlation CH4/Milk Milk production -0.45 Protein 0.40 Lactose 0.19 Fat 0.49 C4:0 0.26 C6:0 0.35 C8:0 0.40 C10:0 0.31 C12:0 0.34 C14:0 0.48 C14:1cis-9 0.62 C16:0 0.32 C16:1cis-9 0.48 C17:0 0.53 C18:0 0.25 Tot C18:1 trans 0.11 C18:1 cis-9 0.44 C18:2cis-9,cis-12 0.23 C18:3cis-9;cis-12,cis-15 0.60 c18:2cis-9,trans-11 0.32 Rcv 0.89
1 Milk components were predicted by FTIR spectrometer
527
Table 6 Multiple correlations from the parameters appearing in table 5 to
528
predict the CH4/kg of milkproduced for the day1.5. R = square root of the R² value
529
Correlation CH4/Milk Name F test
R : 0.87 1. C18:3 n-3 121.83 2. C4:0 61.87 3. C12:0 49.48 4. C6:0 30.57 5. C8:0 12.42 530
531
Figure 1 Possibility to average the spectra milk in function of CH4 day collect. 532
Vertical lines corresponds to milking time; surface shaded to milk production. 533
535
Figure 2 Plot of the principal component analysis of milk spectra for individual cows
536
fed three differing diets: corn silage (•), fresh pasture (o) and grass silage (+). 537
539
Figure 3 Infrared CH4 prediction on basis of milk spectra of the day1.5 for the 540
different diets: corn silage (•), fresh pasture (o) and grass silage (+). 541 0 5 10 15 20 25 30 35 40 45 50 0 10 20 30 40 50 M ea sure d CH4, g CH4/k g milk Predicted CH4, g CH4/kg milk