Université de Montréal
ELECTROSPINNING AND CHARACTERIZATION
OF SELF-ASSEMBLED INCLUSION COMPLEXES
par Yang Liu
Département de chimie Faculté des arts et des sciences
Thèse présentée à la Faculté des études supérieures et postdoctorales en vue de l’obtention du grade de Philosophiae Doctor (Ph.D)
en chimie
Août 2009
Cette thèse intitulée :
ELECTROSPINNING AND CHARACTERIZATION
OF SELF-ASSEMBLED INCLUSION COMPLEXES
présentée par : Yang Liu
a été évaluée par un jury composé des personnes suivantes :
Professeur Robert E. Prud'homme président-rapporteur, Université de Montréal Professeur Christian Pellerin directeur de recherche, Université de Montréal Professeur Françoise Winnik membre du jury, Université de Montréal Professeur Abdellah Ajji examinateur externe, École Polytechnique de
Montréal
Professeur Patrice Hildgen représentant du doyen de la FES, Faculté de
Résumé
L’électrofilage est une technique permettant de fabriquer des fibres polymériques dont le diamètre varie entre quelques nanomètres et quelques microns. Ces fibres ont donc un rapport surface/volume très élevé. Les fibres électrofilées pourraient trouver des applications dans le relargage de médicaments et le génie tissulaire, comme membranes et capteurs chimiques, ou dans les nanocomposites et dispositifs électroniques. L’électrofilage était initialement utilisé pour préparer des toiles de fibres désordonnées, mais il est maintenant possible d’aligner les fibres par l’usage de collecteurs spéciaux. Cependant, il est important de contrôler non seulement l’alignement macroscopique des fibres mais aussi leur orientation au niveau moléculaire puisque l’orientation influence les propriétés mécaniques, optiques et électriques des polymères. Les complexes moléculaires apparaissent comme une cible de choix pour produire des nanofibres fortement orientées.
Dans les complexes d’inclusion d’urée, les chaînes polymères sont empilées dans des canaux unidimensionnels construits à partir d’un réseau tridimensionnel de molécules d’urée liées par des ponts hydrogène. Ainsi, les chaînes polymère sonts très allongées à l’échelle moléculaire. Des nanofibres du complexe PEO-urée ont été préparées pour la première fois par électrofilage de suspensions et de solutions. Tel qu’attendu, une orientation moléculaire inhabituellement élevée a été observée dans ces fibres. De tels complexes orientés pourraient être utilisés à la fois dans des études fondamentales et dans la préparation de matériaux hiérarchiquement structurés.
La méthode d’électrofilage peut parfois aussi être utilisée pour préparer des matériaux polymériques métastables qui ne peuvent pas être préparés par des méthodes conventionnelles. Ici, l’électrofilage a été utilisé pour préparer des fibres des complexes stables (α) et "métastables" (β) entre le PEO et l’urée. La caractérisation du complexe β, qui était mal connu, révèle un rapport PEO:urée de 12:8 appartenant au système orthorhombique avec a = 1.907 nm, b = 0.862 nm et c = 0.773 nm. Les chaînes de PEO sont orientées selon l’axe de la fibre. Leur conformation est significativement affectée
par les ponts hydrogène. Une structure en couches a été suggérée pour la forme β, plutôt que la structure conventionnelle en canaux adoptée par la forme α.
Nos résultats indiquent que le complexe β est thermodynamiquement stable avant sa fonte et peut se transformer en forme α et en PEO liquide par un processus de fonte et recristallisation à 89 ºC. Ceci va dans le sens contraire aux observations faites avec le complexe β obtenu par trempe du complexe α fondu. En effet, le complexe β ainsi obtenu est métastable et contient des cristaux d’urée. Il peut subir une transition de phases cinétique solide-solide pour produire du complexe α dans une vaste gamme de températures. Cette transition est induite par un changement de conformation du PEO et par la formation de ponts hydrogène intermoléculaires entre l’urée et le PEO. Le diagramme de phases du système PEO-urée a été tracé sur toute la gamme de compositions, ce qui a permis d’interpréter la formation de plusieurs mélanges qui ne sont pas à l’équilibre mais qui sont été observés expérimentalement.
La structure et le diagramme de phases du complexe PEO-thiourée, qui est aussi un complexe très mal connu, ont été étudiés en détail. Un rapport molaire PEO :thiourée de 3:2 a été déduit pour le complexe, et une cellule monoclinique avec a = 0.915 nm, b = 1.888 nm, c = 0.825 nm et β = 92.35º a été déterminée. Comme pour le complexe urée de forme β, une structure en couches a été suggérée pour le complexe PEO-thiourée, dans laquelle les molécules de thiourée seraient disposées en rubans intercalés entre deux couches de PEO. Cette structure en couches pourrait expliquer la température de fusion beaucoup plus faible des complexes PEO-thiourée (110 ºC) et PEO-urée de forme β (89 ºC) en comparaison aux structures en canaux du complexe PEO-urée de forme α (143 ºC).
Mots clés : Electrofilage, nanofibres, auto-assemblage, orientation, complexes, structure
Abstract
Electrospinning is a technique that allows production of polymeric fibers with diameters ranging from nanometers to a few microns, and thus with an inherent high surface-to-volume ratio. Electrospun fibers are finding potential applications in drug delivery and tissue engineering, as membranes and chemical sensors, and in nanocomposites and electronic devices. Electrospinning was initially used to prepare disordered, non-woven mats, but it is now possible to produce highly aligned fibers by using different target collectors. However, it is of great interest to not only control the macroscopic alignment of the fibers but also their orientation at the molecular level since it influences the mechanical, optical and electrical properties of polymers. Molecular complexes were targeted as a means of increasing molecular orientation in electrospun fibers.
In the host-guest urea inclusion complexes (ICs), polymer chains are packed in one-dimensional channels constructed from an essentially infinite three-dimensional network of hydrogen-bonded urea molecules. The polymer chains are thus highly extended at the molecular scale. PEO-urea complex nanofibers have been prepared for the first time by electrospinning of suspension and solutions. As predicted, an unusually large molecular orientation in the fibers was achieved. Such highly ordered IC fibers could find use both for fundamental studies of the inclusion complexes and for the preparation of hierarchically structured materials.
Electrospinning can also sometimes be used to prepare metastable polymeric materials that cannot be prepared by the conventional methods. Here, solution electrospinning was used to prepare fibers of both the stable (α) and "metastable" (β) complexes between PEO and urea. Detailed characterization of the ill-studied β complex reveals that it possesses a 12:8 PEO:urea stoichiometry and belongs to the orthorhombic system with a = 1.907 nm, b = 0.862 nm, and c = 0.773 nm. The PEO chains are oriented along the fiber axis and present a conformation significantly affected by strong
hydrogen bonding with urea as compared to the pure polymer and the stable α complex. A layered structure, rather than the conventional channel structure, is suggested.
In contrast with previous suggestions based on melt-quenched PEO-urea α complex, our results further indicate that the β complex is thermodynamically stable before melting and can phase-transfer to the α complex and liquid PEO through a thermodynamic melt-recrystallization process at 89 ºC. In contrast, the β complex obtained by melt-quenching the α complex is mixed with urea crystal and is metastable. It can experience a kinetic solid-solid phase transition process to produce α complex within a large temperature range. This transition is induced by a PEO conformation change and by the formation of intermolecular hydrogen bonds between urea and PEO. The phase diagram of the PEO/urea system was drawn over the complete composition range, which allowed interpreting the formation of various out-of-equilibrium mixtures observed experimentally.
The structure and phase diagram of the PEO/thiourea complex, another poorly understood system, was also studied in detail. An EO:thiourea molar ratio of 3:2 was deduced for the complex, and a monoclinic unit cell with a = 0.915 nm, b = 1.888 nm, c = 0.825 nm and β = 92.35º was determined. Just as for the PEO-urea β complex, a layered structure was suggested for the PEO-thiourea complex, in which the thiourea molecules would be arranged into a ribbon-like structure intercalated between two PEO layers. This layered structure could explain the much lower melting temperature of the PEO-thiourea (110 ºC) and PEO-urea β complexes (89 ºC) as compared to the well known channel-structured PEO-urea α complex (143 ºC).
Keywords : Electrospinning, nanofibers, self-assembly, orientation, complexes,
Table of Contents
Résumé... I Abstract ...III Table of contents...V List of tables...X List of schemes... XI List of figures ... XII List of abbreviations...XVIII Acknowledgements ... XXIChapter 1: Introduction
1.1 Inclusion compound
...11.1.1 Urea and thiourea inclusion compounds ...1
1.1.2 Cyclodextrin inclusion compounds...7
1.1.3 Application of urea, thiourea and cyclodextrin Ics ...10
1.1.4 PEO inclusion compound...11
1.2 Electrospinning
...191.2.1 History and set up ...19
1.2.2 Parameters influencing electrospinning process ...23
1.2.2.1 Applied voltage ...23
1.2.2.2 Viscosity, concentration and molecular weight ...25
1.2.3 Alignment of electrospinning nanofibers...30
1.2.4 Orientation and structure in electrospun fibers ...32
1.4 References
...35Chapter 2: Experimental and characterization methods
2.1 Sample preparation
...442.1.1 Preparation of PEO urea and thiourea complexes...44
2.1.2 Preparation of electrospun fibers ...44
2.1.2.1 Working and counter electrodes ...44
2.1.2.2 Electrospinning of PEO and urea/thiourea solutions...46
2.1.2.3 Electrospinning of PEO and urea/thiourea precipitate...46
2.1.3 Preparation of PEG-thiourea complexes...47
2.1.4 Preparation of PEO-cyclodextrin complexes ...47
2.2 Characterization methods
...482.2.1 Wide angle X-ray diffraction (WAXD) ...48
2.2.1.1 Unit cell determination by powder diffraction...49
2.2.1.2 Orientation measurement...54
2.2.2 Fourier transform infrared (FT-IR) ...58
2.2.2.1 Orientation measurement...59
2.2.2.2 Conformation analysis ...61
2.2.2.3 PEO and urea/thiourea chain orientation direction in complexes ..63
2.2.3 Microscopy...64
2.2.4 Thermal analysis ...66
2.3 References
...70Chapter 3: Highly oriented electrospun fibers of self-assembled
inclusion complexes of poly(ethylene oxide) and urea
3.1 Résumé
...723.3 Introduction
...733.4 Results and discussion
...743.5 Acknowledgement
...803.6 Supporting information
...80 3.6.1 Sample preparation...80 3.6.2 Characterization ...81 3.6.3 Thermogravimetric analysis...82 3.6.4 Infrared spectroscopy...833.7 References
...84Chapter 4: Characterization of the stable and metastable
poly(ethylene oxide)-urea complexes in electrospun fibers
4.1 Résumé
...864.2 Abstract
...874.3 Introduction
...874.4 Experimental section
...894.5 Results and discussion
...904.5.1 Solution electrospinning of the PEO-urea complexes ...90
4.5.2 Structure of the form β PEO-urea complex ...99
4.6 Conclusions
...1074.7 Acknowledgement
...1084.8 References
...109Chapter 5: Stability and phase behavior of the poly(ethylene
oxide)-urea complexes prepared by electrospinning
5.1 Résumé
...1115.2 Abstract
...1125.3 Introduction
...1125.4 Experimental section
...114 5.4.1 Sample preparation...114 5.4.2 Sample characterization ...1155.5 Results and discussion
...1155.5.1 Phase transitions of the α and melt-quenched complexes...115
5.5.2 Phase transitions of the pure β complex...119
5.5.3 β – α transition and stability of the pure β complex...121
5.5.4 Phase diagram of the PEO-urea system ...125
5.6 Conclusions
...1285.7 Acknowledgement
...1295.8 References
...129Chapter 6: Structure and phase behavior of the poly(ethylene
oxide)-thiourea complex prepared by electrospinning
6.1 Résumé
...1326.2 Abstract
...1336.3 Introduction
...1336.4 Experimental section
...1356.5 Results and discussion
...1366.5.1 Composition and phase diagram of the PEO-thiourea complex ...136
6.5.2 Structure of the PEO-thiourea complex ...142
6.6 Conclusions
...1496.8 References
...151Chapter 7: Conclusions and perspectives
7.1 Conclusions...153 7.2 Perspectives of the future ...158 7.3 References...165
List of Tables
Table 1.1 The crystal structures and lattice parameters of the complexes
formed with urea and thiourea host molecules ...5 Table 1.2 The conformation of PEO chains and the crystalline structures of
host-guest complexes formed between PEO and some small molecules ...16 Table 2.1 Unit cells of the seven crystal systems and the fourteen space
lattices ...49 Table 2.2 Absorption frequencies and assignment of the main bands of
electrospun PEO and PEO-urea form α complex. The type of
dominant dichroism for the crystalline samples is also indicated...60 Table 3.1 WAXD characterization of the degree of orientation for PEO-urea
inclusion complex electrospun fibers...79 Table 4.1 Assignment and dichroism of the main infrared absorption bands
for pure PEO and the form α and β PEO-urea complexes ...94 Table 4.2 Crystal plane attribution for the form β PEO-urea complex based on
an orthorhombic unit cell with a = 1.907 nm, b = 0.862 nm and c = 0.773 nm. σ is the calculated angle between the normal of an hkl plane and the c axis, while φmax is the measured maximum of the
azimuthal angle ...101 Table 6.1 Crystal plane attribution for the PEO-thiourea complex based on a
monoclinic unit cell with a = 9.15 Å, b = 18.88 Å, c = 8.25 Å and
β=92.4º ...144 Table 7.1 Infrared absorption frequencies of PEO, the assignments of each
peak and the type of dominant conformation or dichroism in
List of Schemes
Scheme 4.1 Two possible structural models for the orthorhombic PEO-urea β
List of Figures
Figure 1.1 Friedrich Wöhler (1800-1882) and Wöhler synthesis of urea ...2 Figure 1.2 Representation with van der Waals radii showing nine complete
tunnels of the host structure in (a) conventional urea and (b) conventional thiourea inclusion compounds, viewed along the tunnel axis. Note that, in the real inclusion compounds, the tunnels of these host structure are filled with a dense packing of guest
molecules (not shown). ...3 Figure 1.3 The layer-structured supramolecular compound of A)
NC(CH2)5CN with urea60 and B) 1,4-diazabicyclo[2.2.2] octane
with thiourea ...7 Figure 1.4 Schematic drawing of cyclodextrins (CDs). ...8 Figure 1.5 An isolated chain containing (a)10 oxyethylene units (PEG10) and
(b)polyrotaxanes containing 10 oxyethylene units and 4 -cyclodextrins (represented by toruses) oriented head-to-tail or (c)head-to-head and tail-to-tail. All PEG are end-capped by
2,4-dinitrophenylamine groups ...10 Figure 1.6 Structure of the poly (ethylene oxide)-urea inclusion complex: (a)
the channel structure formed by the hydrogen bonded urea molecules and (b) the association of PEO and urea molecules
inside the channel...13 Figure 1.7 Side and top view of the structures of the four model systems. On
the side of the polymeric chains, a line indicates the dimension of the repeating units of each conformation along the chain length
direction ...18 Figure 1.8 William Gilbert (left), Georg Matthias Bose (middle) and Lord
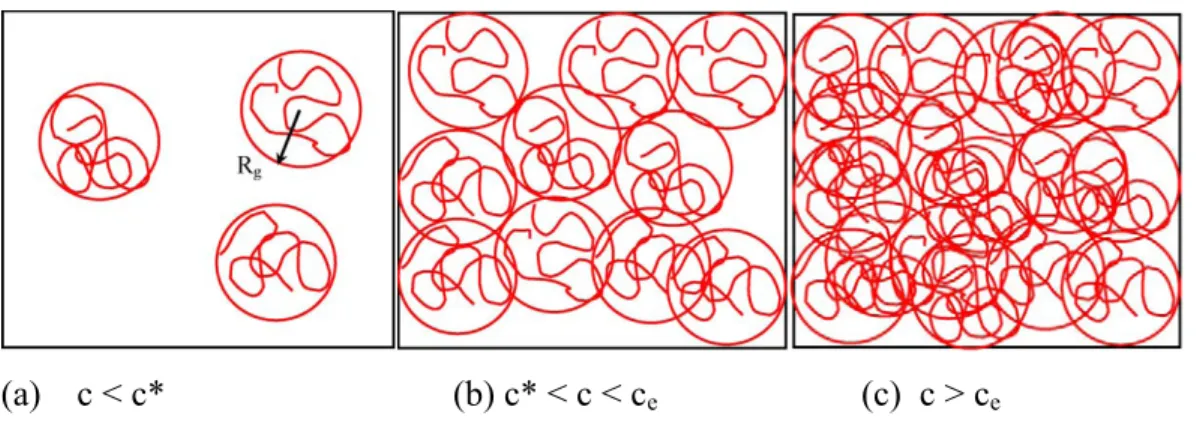
Figure 1.9 Basic setup of electrospinning (left) and real-time image of electrospinning process (right)...22 Figure 1.10 Physical representation of the three solution regimes, (a) dilute, (b)
semidilute unentangled and (c) semidilute entangled. Rg is the
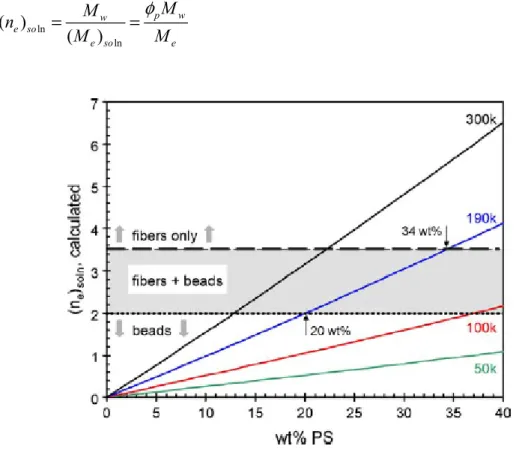
radius of gyration ...26 Figure 1.11 Plot of the calculated entanglement number (ne)soln as a function of
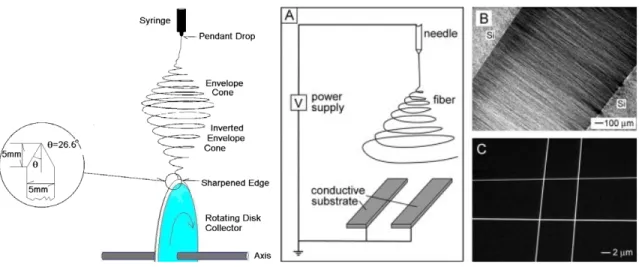
concentration for PS/THF system ...28 Figure 1.12 Schematic setup of the knife-edged rotating disk (left) and two
separated conductive substrates (right) used for obtaining aligned
fibers...30 Figure 2.1 Photographs of two types of counter electrodes: rotating cylinder
collector with a metal disk in the middle (left) and two separate
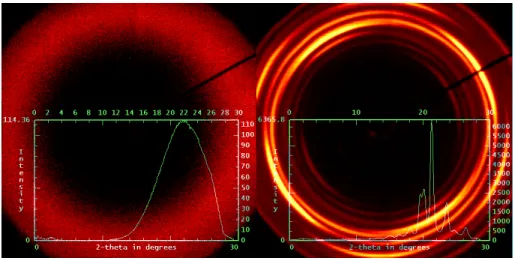
electrodes (right). ...46 Figure 2.2 Two-dimensional X-ray patterns of PEO-urea α complex melt at
160 ºC (left) and the melt-quenched sample at 25 ºC (right) ...48 Figure 2.3 Diagram of a plane having the Miller indices of (211)...51 Figure 2.4 WAXD results for PEO, PEO-urea α and β complexes and the
melting-cooling of β complexes...54 Figure 2.5 Definition of the coordinate system OXYZ with the unit cell
system Oxyz and Euler angles θ, φ, and ψ...55 Figure 2.6 Polarized infrared spectra of PEO fibers prepared by
electrospinning. Solid and broken lines represent the spectra measured with the radiation polarized parallel and perpendicular to
the fiber direction, respectively...59 Figure 2.7 FT-IR spectra of bulk PEO and electrospun PEO nanofibers (NFs) ...62 Figure 2.8 SEM image of PEO-urea IC α form (top) and cross-polarized
Figure 2.9 Spin-coated PEO-urea α complex (left), PEO-urea β complex
(middle), and β complex after melting and cooling to 25 ºC (right)...66 Figure 2.10 Thermogravimetric analysis plots of pure PEO, α-CD, urea,
PEO-urea complex form α and PEO-α-CD complexes with various mass
ratios...67 Figure 2.11 Temperature-composition phase diagram of PEO/urea system...69 Figure 3.1 Crossed-polarized optical micrograph of electrospun fibers of the
PEO-urea inclusion complex...74 Figure 3.2 DSC thermograms of the bulk PEO, urea and inclusion complex
(IC), as well as those of the pure PEO and PEO-urea IC electrospun
fibers...75 Figure 3.3 a) Wide-angle X-ray diffraction 2θ diagrams for the bulk and
electrospun fibers of the PEO-urea inclusion complex (IC) and two-dimensional diffraction patterns of bulk IC (left inset) and electrospun fibers (right inset). b) Azimuthal profile of the WAXD
pattern for electrospun PEO-urea IC at 2θ=21.6º. ...77 Figure S3.1 Thermogravimetric analysis plots of pure PEO and urea, and of the
bulk and fibers of the PEO-urea inclusion complex (IC)...82 Figure S3.2 Infrared spectra of pure PEO and urea, and of the bulk and fibers of
the PEO-urea inclusion complex (IC)...83 Figure 4.1 Representative crossed-polarized optical micrographs of fibers
prepared by electrospinning solutions with A) 4:9 and B) 3:2
PEO:urea molar ratios...91 Figure 4.2 Wide-angle X-ray diffraction patterns of electrospun fibers with
different PEO:urea mass ratios...92 Figure 4.3 Infrared spectra of electrospun fibers with different PEO:urea mass
Figure 4.4 DSC thermograms recorded for pure PEO and urea, and for the
electrospun fibers of the form β and form α PEO-urea complexes...95 Figure 4.5 Infrared spectra of the form β PEO-urea complex recorded at 25
and 90 ºC, and of pure PEO in the melt state...96 Figure 4.6 Two-dimensional WAXD patterns of the A) form α and B) form β
PEO-urea complexes, and C) azimuthal profiles recorded for the form α (2 θ = 21.2º) and form β (2 θ = 21.6º) fibers prepared by
electrospinning of suspensions and solutions. ...98 Figure 4.7 Higher resolution WAXD pattern of the form β PEO-urea complex. ...100 Figure 4.8 Polarized infrared spectra of the form α and form β PEO-urea
complex fibers in the N-H stretching region. Solid and broken lines represent spectra measured with the radiation polarized parallel and
perpendicular to the fiber direction, respectively...103 Figure 4.9 Polarized infrared spectra of the form β PEO-urea complex fibers
prepared by electrospinning. Solid and broken lines represent the spectra measured with the radiation polarized parallel and perpendicular to the fiber direction, respectively...104 Figure 5.1 DSC thermograms recorded for the PEO-urea α complex...116 Figure 5.2 WAXD patterns of the PEO-urea α complex recorded at 25 °C (top
curve), after heating to the liquid state (160 °C), cooling to 75, 65, 50 and 25 °C, and finally after a second heating to 95 °C (bottom
trace)...117 Figure 5.3 FT-IR spectra of the PEO-urea α complex recorded at 25 °C (top
curve), after heating to the liquid state (160 °C), cooling to 90, 75, 65 and 25 °C, and finally after a second heating to 95 °C (bottom
trace)...118 Figure 5.4 DSC thermograms recorded for the pure PEO-urea β complex...120
Figure 5.5 WAXD patterns of the pure PEO-urea β complex recorded at 25 °C (top curve), after heating slightly above the phase transition temperature (90 °C) and in the melt state (160 °C), after cooling to 75 and 25 °C (middle curves), and finally after a second heating
scan to 70 °C (bottom trace) ...121 Figure 5.6 A) FT-IR spectra and B) WAXD profiles of the melt-quenched β
mixture recorded as a function of time during an annealing at 60 °C ...122 Figure 5.7 A) FT-IR spectra of the pure β complex recorded as a function of
time during an annealing at 60 °C; B) Time evolution of the normalized absorbance of the 1308 cm-1 β complex band during annealings at 70, 75 and 80 °C for the pure β complex and at 60 °C
for the melt-quenched β mixture...124 Figure 5.8 Phase diagram of PEO-urea binary system. The open symbols
represent the melting events due to kinetic products and the dashed
lines the expected behavior under thermodynamic conditions ...126 Figure 6.1 DSC thermograms recorded for cocrystallized PEO-thiourea
complexes with PEO Mw of 400, 1000 and 400,000 g/mol ...137 Figure 6.2 WAXD profiles of the PEO-thiourea complex at 25, 125, 170 ºC
compared with those of pure PEO and thiourea at 25 ºC...138 Figure 6.3 A) DSC thermograms and B) melting enthalpy of the PEO-thiourea
complex as a function of the thiourea molar fraction ...140 Figure 6.4 WAXD profiles of electrospun fibers prepared with various
thiourea molar fractions ...141 Figure 6.5 Phase diagram of the PEO-thiourea binary system...142 Figure 6.6 High resolution WAXD pattern of the PEO-thiourea complex ...143 Figure 6.7 Two-dimensional WAXD pattern of the electrospun PEO-thiourea
complex fibers (inset) and azimuthal profiles for the peaks at 2θ =
Figure 6.8 Infrared spectra of pure PEO and thiourea, and of the PEO-thiourea
and PEO-urea β complexes. ...146 Figure 6.9 Polarized Raman spectra of the PEO-thiourea complex fibers
prepared by electrospinning. The spectra with solid and broken lines were measured with the incident and scattered radiation polarized parallel and perpendicular to the fiber direction, respectively ...148 Figure 7.1 Scheme of block-complexes composed of PEO chains and CD and
List of Abbreviations
2MB: 2-methoxybenzamide 2MRES: 2-methylresorcinol
A//: Absorbance parallel to the reference direction
A┴: Absorbance perpendicular to the reference direction ATR: Attenuated total reflection
c: Concentration
Be: Berry number
c*: Critical overlap concentration ce: Entanglement concentration CD(s): Cyclodextrin(s)
D: Dichroic ratio
DABCO: 1,4-diazabicyclo[2.2.2] octane
DCM: dichloromethane
DMF: dimethylformamide
EO : Ethylene oxide repeat unit FT-IR: Fourier transform infrared FWHH: Full width at half height
G(g): Gauche
θ: Half of the angle of the diffracted rays from the incident x-rays
η: Viscosity of the solution
r
η : Relative viscosity
s
η : Viscosity of the solvent
sp
η : Specific viscosity
[ ]
η : Intrinsic viscosityH: Distance between the capillary end and the target (hkl): Miller indices of a crystal plane
IC(s): Inclusion compound(s) or inclusion complex(es) Kf : Force constant of a bond
H
k : Huggins coefficient
L: Length of the capillary
λ: Wavelength Δn : ij Birefringence
Me: Entanglement molecular weight
Mi: Mass of the atom
Mw: Molecular weight
MWNT: Multiwalled nanotubes
n: Refractive index
Nb: Bond order
ne: Number of entanglement per chain (ne)solution: Solution entanglement number ν: Wavenumbers
NMR: Nuclear magnetic resonance ODF: The orientation distribution function OM: Optical microscopy
<P2(cosφ)> : Second order moment of the orientation distribution function
〈 〉P :2 c Second order moment of the orientation distribution function along the c axis
Plmn: Associated Legendre polynomials PAN: Polyacrylonitrile
PCL: Poly(ε-caprolactone)
PDX: P-dihalogenobenzenes
PDLA: Poly(D-lactic acid)
PE: Polyethylene
PEG: Poly(ethylene glycol) PEO: Poly(ethylene oxide)
PHTP: Perhydrotriphenylene PLLA: Poly(L-lactic acid)
PMMA: Poly(methyl methacrylate)
PNP: P-nitrophenol
PP: Polypropylene
PPO: Poly(propylene oxide)
PS: Polystyrene
PTA: Poly(trimethylene adipate) PTG: Poly(trimethylene glutarate) PTHF: Poly(tetrahydrofuran)
PVAc: Poly(vinyl acetate) PVC: Poly(vinyl chloride) PVME: Poly(vinyl methyl ether) R: Radius
Rg: Radius of gyration
γ: Surface tension
RES: Resorcinol
SEM: Scanning electron microscopy
σ: Angle between the normal to the (hkl) plane and the c axis T: Trans
TGA: Thermogravimetric analysis Vc: Critical voltage
wa: Weight of samples measured in air WAXD: Wide angle X-ray diffraction
ws: Weight of samples measured in solvent
φ: Azimuthal angle
X,Y,Z: Laboratory frame coordinate axes x,y,z: Sample frame coordinate axes Xi: Electronegativity of atoms i XRD: X-ray diffraction
Acknowledgment
I would like to express my sincere thanks and gratitude to my supervisor, Prof. Christian Pellerin for his support, advice and encouragement in the course of my Ph. D studies. Prof. Pellerin always provided me with motivation and guidance in my research. His broad knowledge and creative ideas were crucial for the completeness of this dissertation. Without his patience and guidance, I could not complete this dissertation. My appreciation is also extended to the other jury members.
I am grateful to Dr. Thierry Maris, Dr Damien Maillard and Dr. Thierry Lefèvre for their help with the high resolution XRD experiments, the polarized optical microscopy measurements and the Raman spectra measurements, respectively. I would like to thank Ms. Huguette Dinel for her help in the density measurements.
Many thanks to my current and previous colleagues and friends in University of Montreal, a special acknowledgement belongs to Dr. Yongri Liang for extensive discussions about my research project and Mr. Damien Mauran for his help in taking the FT-IR spectra. Next I would like to thank Ms. Hélène Antaya for her help in preparing some specimens and the translation of the French abstract. I also acknowledge the dedication of the technicians, Mr. Sylvain Essiembre, Ms. Julie Boivin, Mr. Julien Del Testa, Mr. Martin Lambert, Mr. Louis Beaumount and Mr. Yves Teasdale, who were always available to help with my experiments and with the building up of the equipments.
I would like to thank all the other Chinese graduate students and all the other labmates in the Pavillon J. A. Bombardier for sharing the great lunch time, playing badminton, table tennis and basketball in the spare time.
Finally, I would like to express my very deep gratitude to my parents and my spouse for their support and love.
Chapter 1 : Introduction
1.1 Inclusion
Compounds
Inclusion compounds (IC), or inclusion complexes, can be defined as systems in which one species (the “guest”) is spatially confined within another species (the “host”).1,2 It is convenient to subdivide inclusion compounds into two classes based on the difference of host molecules. In one class, the host molecules possess an appropriate cavity or binding site for inclusion of guest molecules. For such molecular hosts, the host-guest complexes can exist in either solid or dispersed state (e.g. in solution), and the host structure can remain stable when the guest components are removed. Examples of this type of hosts are crown ethers, cyclodextrins, cryptands, rotaxanes and catenanes.1-5 In the second class of inclusion compounds, guest molecules are located within the architecture or crystalline framework of solid host materials. For such molecular hosts, the host-guest association is a solid state phenomenon and the host structure undergoes substantial reorganization when the guest molecules are removed. Such solid hosts include a wide range of inorganic materials, for example, inorganic salts (e.g. HgCl2,6,7 LiCF3SO3,8,9 LiI,10 NaSCN,11 LiV3O8,12 CdPS3 preintercalated with hydrated alkali cations13), aluminosilicates (including zeolitic and clay minerals), aluminophosphates, graphite, layered metal chalcogenides and layered metal phosphonates,1,2,14 as well as crystalline organic hosts, such as urea,14-16 thiourea, 14,17,18 p-dihalogenobenzenes (PDX), 19,20 perhydrotriphenylene (PHTP),21 p-nitrophenol (PNP),22,23 resorcinol (RES),24 2-methylresorcinol (2MRES),25 and hydroquinone (HYD).26,27 In this thesis, we researched both types of host molecules, focusing on the crystalline organic hosts, especially on urea, thiourea and cyclodextrin (CD) inclusion compounds.
Urea, also known as carbamide, was first isolated from urine by Rouelle in 1773. Then in 1828, it was synthesized by Wöhler and became the first organic substance synthesized from inorganic compounds in the laboratory.28 Wohler's historic preparation of "artificial" urea demonstrated to the scientific world that an organic compound could be synthesized, not only by a living organism, but by the chemist. For many, then, Wöhler is considered the father of organic chemistry. In 1940, while studying the effects of urea on proteins in pasteurized milk, Bengen accidentally found that 1-octanol forms crystalline adducts with urea.29 Following that, it was reported that other linear aliphatic compounds, including carboxylic acids, higher alcohols and paraffins with six or more carbon atoms, could also form adducts with urea molecules in which the ratio of urea to guest molecules was nonstoichiometric.14,30 Smith conducted an investigation of the crystalline structure of the hexadecane-urea inclusion compound and provided the structure found for most urea ICs.31 In this structure, the urea molecules are connected by hydrogen bonds to form a hexagonal array of linear channels that contain the guest molecules. The Van der Waals diameters of urea channels are 5.5-5.8 Å.1,2,14 Within this range, only linear n-alkane chains or analogous guest molecules with minimal branching, such as α,ω-dihalogenoalkanes, could be fitted in.
Figure 1.1. Friedrich Wöhler (1800-1882) and the synthesis of urea.28
In addition to urea ICs, another adduct host, thiourea, has been found independently by Angla and Fetterly32,33 to form crystalline inclusion compounds with
Pb(NCO)2+ 2NH3+ 2H2O → Pb(OH)2+ 2NH4NCO
→ R
guests that are somewhat larger and differently shaped than those included within the channels of urea. Lenne and Schlenk et al. demonstrated that the thiourea and urea tunnels have similar structures, but that the thiourea tunnel has a larger cross-section.34-36 As shown in Figure 1.2, George and Harris37 calculated the tunnel diameter of urea and thiourea inclusion compounds, which fluctuates between ca. 5.5 and 5.8 Å for the conventional urea inclusion compounds (a = b = 8.23 Å, c = 11.02 Å) and ranges from 5.8 to 7.1 Å for the conventional thiourea inclusion compounds (a = b = 15.97 Å, c = 12.48 Å). Consequently, the types of guest molecules that form inclusion compounds with urea and thiourea are generally different, and thiourea accommodates a greater diversity of guest molecules than urea.
Figure 1.2. Representation with Van der Waals radii showing nine complete tunnels
of the host structure in (a) conventional urea and (b) conventional thiourea inclusion compounds, viewed along the tunnel axis. Note that, in the real inclusion compounds, the tunnels of these host structures are filled with a dense packing of guest molecules (not shown).37
Brown and White screened over 175 compounds for adduct formation and found that thiourea complexes can be grouped into five classes: 1) polymethylated, polychlorinated, or polybrominated alkanes and their derivatives; 2) derivatives of cyclopentane or its heterocyclic analogs; 3) derivatives of cyclohexane or its heterocyclic analogs; 4) miscellaneous cyclic and bicyclic compounds; 5) small flat molecules.38 Later, it was found that thiourea channel structures can also include ferrocene, organometallics and compounds containing aromatic rings.14 Schiessler and Flitter made the generalization that most molecules which are capable of complex formation with thiourea have cross-sectional areas of approximately 5.8 x 6.8 Å.39 The exception are the small flat molecules in the last group, which are not lined up end to end in the channel as the other classes of compounds, but are packed in some sort of overlapping arrangement as in stacks of coins.38
In addition to the short chain molecules, polymers have been found to form inclusion compounds with urea and thiourea by co-crystallization (see Table 1.1). 14-18,40-47 The conformational properties of alkane guest molecules within urea ICs have been widely investigated and many authors propose that the main portion of the alkane molecules exists essentially in the all-trans conformation. Therefore, it was proposed that the alkane-urea inclusion compounds could be used as model systems for the characterization of alkanes in all-trans conformation.14,48 As for the long chain polymers, molecular modeling has shown that polyethylene (PE), poly(trimethylene adipate) (PTA), poly(trimethylene glutarate (PTG) and poly(tetrahydrofuran) (PTHF) assume an all-trans, planar zigzag conformation.40,41,49 Poly(ε-caprolactone) (PCL), poly(L-lactic acid) (PLLA) and nylon-6 prefer extended, nearly planar zigzag all-trans and kink (g±tg±) conformations.49-51 On the whole, the guest molecules within the urea channels are more extended and exist essentially in the all-trans conformations.
The narrow channels which exist in urea and thioura inclusion compounds have been chosen as templates to carry out polymerization reactions. Presumably, monomers polymerizing in urea or thiourea channels are subjected to a spatial control that may produce long, regular, unbranched, and even stereospecific polymer molecules. The
reactions studied were the polymerization of various olefins, dienes and epoxides. For example, poly(vinyl chloride) (PVC) thus obtained was found to be more syndiotactic than usual, polyacrylonitrile (PAN) was more stereoregular, and the polymerization of butadiene, 2,3-dichlorobutadiene and 2,3-dimethylbutadiene were reported to produce extremely regular 1,4-trans polymers.38,52-56
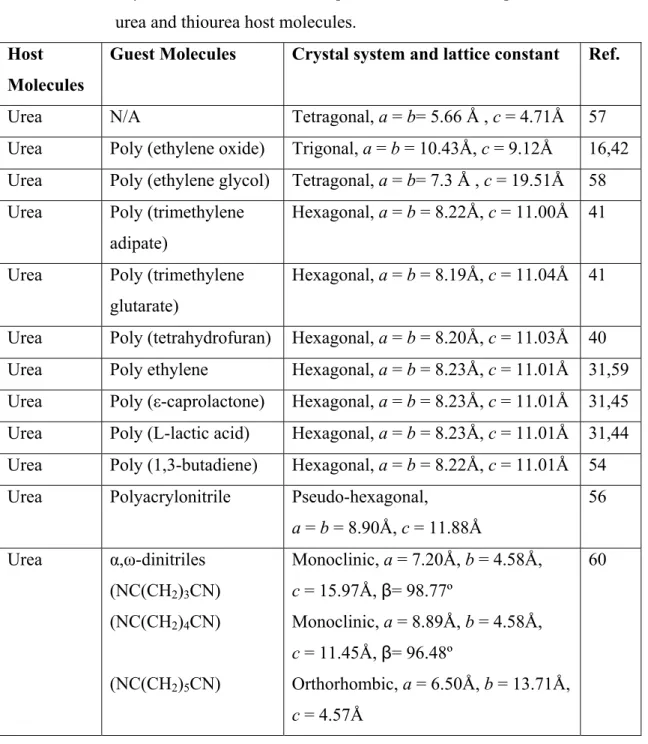
Table 1.1. Crystal structures and lattice parameters of the complexes formed with urea and thiourea host molecules.
Host Molecules
Guest Molecules Crystal system and lattice constant Ref.
Urea N/A Tetragonal, a = b= 5.66 Å , c = 4.71Å 57
Urea Poly (ethylene oxide) Trigonal, a = b = 10.43Å, c = 9.12Å 16,42 Urea Poly (ethylene glycol) Tetragonal, a = b= 7.3 Å , c = 19.51Å 58
Urea Poly (trimethylene
adipate)
Hexagonal, a = b = 8.22Å, c = 11.00Å 41 Urea Poly (trimethylene
glutarate)
Hexagonal, a = b = 8.19Å, c = 11.04Å 41 Urea Poly (tetrahydrofuran) Hexagonal, a = b = 8.20Å, c = 11.03Å 40 Urea Poly ethylene Hexagonal, a = b = 8.23Å, c = 11.01Å 31,59
Urea Poly (ε-caprolactone) Hexagonal, a = b = 8.23Å, c = 11.01Å 31,45
Urea Poly (L-lactic acid) Hexagonal, a = b = 8.23Å, c = 11.01Å 31,44 Urea Poly (1,3-butadiene) Hexagonal, a = b = 8.22Å, c = 11.01Å 54
Urea Polyacrylonitrile Pseudo-hexagonal,
a = b = 8.90Å, c = 11.88Å 56 Urea α,ω-dinitriles (NC(CH2)3CN) (NC(CH2)4CN) (NC(CH2)5CN) Monoclinic, a = 7.20Å, b = 4.58Å, c = 15.97Å, β= 98.77º Monoclinic, a = 8.89Å, b = 4.58Å, c = 11.45Å, β= 96.48º Orthorhombic, a = 6.50Å, b = 13.71Å, c = 4.57Å 60
Thiourea N/A Orthorhombic, a = 7.66Å, b = 8.56Å, c = 5.49Å
61-63
Thiourea Cycloheptane Hexagonal, a = b = 16.01Å, c =
12.45Å
64 Thiourea Cyclohexane Phase I: Hexagonal, a = b = 15.84Å,
c = 12.46Å
Phase II: Monoclinic, a = 9.99Å,
b = 15.58Å, c = 12.43Å, β= 114.64º
Phase III: Monoclinic, a = 10.21Å,
b = 14.98Å, c = 12.41Å, β= 115.18º
63
Thiourea 1,5-cyclooctadiene Monoclinic, a = 12.24Å, b = 16.05Å, c = 9.63Å, β= 110.73º
65 Thiourea Carbon tetrachloride Trigonal, a = b = 15.54Å, c = 12.53Å 66 Thiourea Adamantane Trigonal, a = b = 16.19Å, c = 12.58Å 67 Thiourea 2,6-diethylnaphthalene Monoclinic, a = 12.57Å, b = 9.28Å,
c = 14.63Å, β= 92.1º
68
Thiourea 2-methoxybenzamide Orthorhombic, a = 10.04Å, b =
10.88Å, c = 20.40Å
69
Thiourea Ethenzamide Orthorhombic, a = 10.66Å, b =
10.99Å, c = 20.68Å 70 Thiourea 1,4-diazabicyclo octane Monoclinic, a = 9.68Å, b = 7.87Å, c = 18.25Å, β= 95.27º 71 Thiourea Poly(2,3-dichlorobutadiene) Monoclinic, a = 9.87Å, b = 15.83Å, c = 12.53Å, β=114.1º 53 Thiourea Poly(2,3-dimethylbutadiene) Monoclinic, a = 9.52Å, b = 15.4Å, c = 12.55Å, β=114º 53,72
Urea and thiourea inclusion complexes with such channel structure are usually prepared by cocrystallization from a solution in which the host and guest molecules are dissolved. The urea and thiourea inclusion complexes show either commensurate or
incommensurate structural properties and temperature-dependent phase properties. For example, the thiourea - cyclohexane inclusion complex is known to exist in three phases (phases I, II and III). The stable phase I experiences a second-order phase transition to phase II at ca. 148 K, and phase II undergoes a first-order transition to phase III at ca. 127 K.63
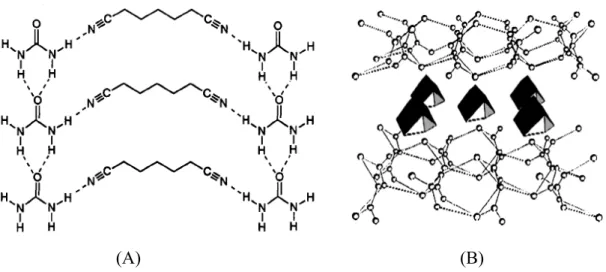
(A) (B)
Figure 1.3. The layer-structured supramolecular compound of A) NC(CH2)5CN with urea60 and B) 1,4-diazabicyclo octane with thiourea.71
In addition to the conventional channel-structured inclusion complexes, both urea and thiourea have been found to form layer-structured complexes and most of these complexes are commensurate.59,20,60,68-71 For instance, NC(CH2)nCN-urea crystals with n = 6, 8, 10 are conventional channel inclusion compounds, while the others, with n = 3, 4, 5 are novel layered complexes that consist of sheets of hydrogen-bonded molecules in which linear arrays of urea molecules similar to the packing in tetragonal urea are separated by dinitriles and the adjacent layers are held together by dipolar and van der Waals forces (Figure 1.3A).60 As illustrated in Figure 1.3B, the 1,4-diazabicyclo[2.2.2] octane (DABCO)-thiourea complex may be described as a pillar structure, in which the thiourea molecules are forming solid layers among which the DABCO molecules are
interacting and the thiourea networks are held together by DABCO bridges through hydrogen bonds.71
1.1.2 Cyclodextrin inclusion compounds
Cyclodextrins (CDs), sometimes called cycloamyloses, are α-1,4-linked cyclic oligomers of anhydroglucopyranose. The CDs consisting of six, seven, or eight glucose entities are called α-, β- and γ-CDs, respectively. Villiers discovered α- and β-CDs by digesting starch with bacillus amylobacter in 1891.73 More than fifty years later, γ-CD had been discovered and the structures of α, β, and γ CDs were elucidated by Schardinger, Pringsheim and Szejtli.74,75 As shown in Figure 1.4, CDs assume a toroidal shape with the primary hydroxyl groups at the narrow side (tail) and the secondary hydroxyl groups at the wide side (head).5 Therefore, the two rims (head and tail) made of hydroxyl groups are hydrophilic and the cavity of the toroid tunnel is hydrophobic.
Figure 1.4. Schematic drawing of cyclodextrins (CDs). 5
One of the most remarkable features of CDs is their ability to form inclusion complexes with small molecules and polymers. Since the appearance of the first inclusion complex formed between CDs and organic compound in 1928, a large number of inclusion compounds with low molecular weight compounds have been prepared and characterized.5 The inclusion complex formation of CDs with polymers was not reported until Harada et al. prepared crystalline complexes with poly(ethylene oxide) in 1990.76-78
Since then, a lot of polymers, such as poly(propylene oxide) (PPO), polyolefins, polyamides, polyurethanes, polyamines, poly(vinyl methyl ether) (PVME), poly(ethylene terephthalate) (PET), poly(ε-caprolactone) (PCL), poly(L-lactic acid) (PLLA), poly(vinyl acetate) (PVAc), poly(methyl methacrylate) (PMMA), and polystyrene (PS) have been found to form ICs with CDs.5,79
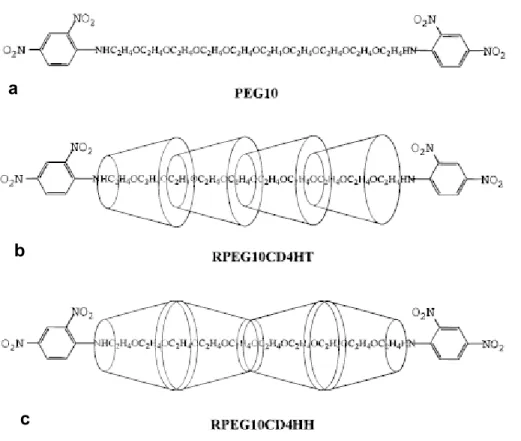
The inclusion of a polymer chain into the CDs cavity is entropically unfavorable, but this threading process is promoted by intermolecular hydrogen bonds between neighboring CDs and noncovalent attractive interactions, such as Van der Waals and hydrophobic interactions, between polymer chains and CDs. Since a CD has two different hydroxyl groups on the two ends of its cavity, a primary (tail) and two secondary hydroxyl groups (head) (Figure 1.5), CD can have three assemblies, namely, head-to-head (secondary-to-secondary), tail-to-tail (primary-to-primary) and head-to-tail (secondary-to-primary). Pozuelo et al. simulated the hydrogen bonds interactions of the CDs in the ICs, and found that the strength of the intermolecular hydrogen bonds (per CD unit) is almost the same for the head to head or head to tail arrangements, but there are more intermolecular hydrogen bonds between CDs with head to head arrangement than head to tail ones. (Figure 1.4)80 This simulation is consistent with the observation made by Harada’s group and it indicates that the CDs assemble in a head-to-head, tail-to-tail sequence rather than head-tail-to-tail one.77
Figure 1.5. An isolated chain containing (a) 10 oxyethylene units (PEG10) and (b)
polyrotaxanes containing 10 oxyethylene units and 4 α-cyclodextrins (represented by toruses) oriented head-to-tail or (c)head-to-head and tail-to-tail. All PEG are end-capped by 2,4-dinitrophenylamine groups.80
The threading process of ICs formed with CDs and polymer is more complex than the formation of urea or thiourea ICs, which could be divided into five different steps: 1) diffusion of the two reactants in the solvent, 2) initial threading of polymer chain ends into CD cavities, 3) sliding of CD over the polymer chain, 4) dethreading of CD from the polymer chain, 5) precipitation of the final aggregate. 81 Urea or thiourea ICs are commonly prepared by the co-crystallization method and can only exist in the solid state. Once dissolved they will separate into host (urea, thiourea) and guest molecules. In contrast, cyclodextrin ICs are not only stable in the solid state but can also easily dissolve in water and maintain a dynamic equilibrium in solution (threading and
a
b
dethreading). Moreover, the columnar cavity structure of CDs can be maintained without the involvement of guest molecules.82
The formation of ICs with α-, β-, or γ-CDs is mainly governed by the size of the guest molecules compared with the internal diameter of the CDs. The tail/head diameters of the cavity are 4.7/5.3, 6.0/6.5, 7.5/8.3 Å for α-, β-, and γ-CDs respectively.74 Thus, the diameter of urea channel is close to that of α-CD and thiourea is close to that of β-CD. The γ –CD cavity is larger than the others. As a result, we can hypothesize that the guest polymers that can form ICs with urea could also form ICs with α-CD, and that the ones that can form ICs with thiourea could also form ICs with β-CD, while γ-CD could only include larger guest molecules.
As in urea and thiourea ICs, polymer chains included in CD ICs are both highly extended and isolated from neighboring polymer chains. Because of the head-to-head, tail-to-tail arrangement of CD channels, the ICs channels and polymer chains are found to be oriented by themselves.82 Tonelli suggested that polymer chains that coalesce from CD ICs might be significantly different from those normally produced from solutions or melts.79 For example, PET coalesces from γ-CD ICs crystallized quickly, achieves ca. 40% crystallinity and shows no glass transition or cold crystallization in the differential scanning colorimetry (DSC) scans. This is completely different from the conventional PET and is attributed to the different kink conformations of the non-crystalline regions, as existed in the initial γ-CD ICs.83
1.1.3 Application of urea, thiourea and cyclodextrin ICs
Due to the capability of urea, thiourea and CDs to isolate guest molecules inside their stacked channels, the ICs provide unique solid state environments for guest molecules, and can yield information regarding the dynamics of guest motions and other properties originating from the inherent behavior of individual guest chains. Among those properties, the conformation and orientation of guest chains inside the urea, thiourea or cyclodextrin channels are the main research contents. These two properties
are associated with the one-dimensional channel structure, which will orient and isolate guest molecules and limit their conformations so that they might be widely used.
The practical applications of urea, thiourea and cyclodextrin ICs include inclusion polymerization to prepare less-branched and stereoselective polymers, 38,52-55,84-86 molecular separation to isolate linear compounds from multi-branched ones or to separate low molecular weight compounds from high molecular weight ones,14,87-90 and the separation of enantiomers by chiral recognition.91-95 Finally, they can allow the preparation of new materials with unusual properties, such as the urea, thiourea ICs containing appropriate organic or organometallic guests that exhibit second harmonic generation (SHG) (doubling of the frequency of light as it passes through a material), 96-98 which originates from molecular orientation and dipole moment alignment of guest molecules within the inclusion compound channels.14,98
1.1.4 PEO inclusion compounds
Linear polymers are usually found to form ICs with urea and α-CD. In contrast, polymers with multiple side chains or substituted functional groups are found to form ICs with thiourea, β-, or γ- CD. For example, PEO was the first polymer found to form an IC with urea and α-CD, and it is also able to form a stable complex with γ-CD, but not with β-CD in aqueous solution.76,77 On the other hand PPO is able to form ICs with β- and γ-CD, but not with α-CD. This is consistent with the host diameters of α-, β- and γ- CD, which are around 4.7-5.3, 6.0-6.5 and 7.5-8.3 Å, respectively. The diameters of the α-CD and γ-CD channels are large enough to include one and two PEO chains, respectively, while β- CD is large enough for PPO chains but is too large to form a stable IC with PEO. Just as for CDs, the polymers that can form ICs with urea and thiourea are generally different. Linear polymers, such as polyethylene, PCL and PLLA will form ICs with urea, while substituted polymers, such as PVC and poly(2,3-dimethylbutadiene), prefer forming ICs with thiourea.
A B
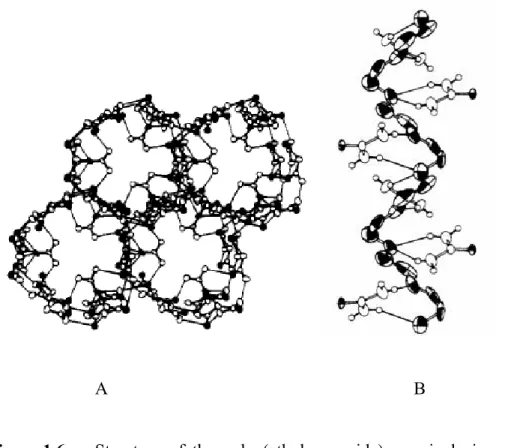
Figure 1.6. Structure of the poly (ethylene oxide)-urea inclusion complex: (a) the
channel structure formed by the hydrogen bonded urea molecules and (b) the association of PEO and urea molecules inside the channel.16
Perhaps the most interesting of the polymer-urea ICs is that with PEO. Barker and Ranauto first achieved complex formation of PEO and its derivatives with urea.15,99 The crystalline structure of the PEO-urea complex was determined to be trigonal (a = b = 10.43 Å, c = 9.12 Å) with a stoichiometry of (EO)4(urea)9 by Tadokoro et al. and by Chenite and Brisse.16,42 This structure is different from that of conventional urea ICs (hexagonal, a = b = 8.23 Å, c = 11.01 Å).31 In this unusual inclusion complex structure, the PEO chains form an approximate 41 helix in which each pair of adjacent ether oxygen is hydrogen bonded to a urea molecule that is located inside the channels formed by urea molecules. Therefore, two types of urea molecules exist within the unit cell: two thirds of the urea molecules (6 urea) form the channels (Figure 1.6A) and one third (3 urea) are embedded inside the channels and associate with PEO chains (Figure 1.6B). As a result, the channel diameter of the PEO-urea IC is larger and the repeat length of the channel is less than in the ordinary urea channels. For polyethers [(CH2)mO]n with m>3,
the urea ICs are the same as those formed with n-alkanes, and the polymers take trans (zig-zag) conformations.16,40,41 Tonelli simulated the PEO conformations assuming the conventional hexagonal channel structure, and results showed that the all-trans (TTT) (O-C-C-O) conformation could be included but that the most common TGT (O-C-C-O) 72 helical conformation of PEO cannot be included inside the urea channels.49 This could be further confirmed by the complex formed between PEO and α-CD, in which PEO chains are thought to take all-trans conformation to thread through the α-CD channels.
In addition to the trigonal PEO-urea IC, named Form α here on, two other modifications are reported for low molecular weight PEG (Mw = 400) and for samples resulting from the melt-quenching of Form α. The low molecular weight PEG-urea complex was reported to be tetragonal (a = 7.3 Å, b = 19.51 Å) with a 1:1 EO:urea composition.58 After melt-quenching of Form α, a mixture of tetragonal urea and a second complex of PEO-urea, named Form β here on, is formed. This β complex was reported to be metastable and to phase transfer to Form α after annealing at 90 ºC.100-104 As to the crystalline structure of Form β, it is assigned to either the hexagonal structure by Tonelli et al.105 or to the low molecular weight PEG-urea complex by Bogdanov. 100-104 and Ye et al. 104,106 However, Form β does not seem to fit completely with either, indicating that a new unknown crystalline structure exists. As shown in Table 1.2, the formation of two different crystalline structures between PEO and some small host molecules is not uncommon. For instance, both resorcinol and 2-methyl resorcinol (MRES) can form two different complexes with urea. The Form β is generally metastable and will undergo a transformation to the stable Form α within a few minutes at room temperature.107 Because of the metastability of these β forms, the composition and crystalline structure of these β complexes have not been obtained yet.
Compared with the complex formed with urea, the PEO-thiourea complex is less well researched. In fact, its composition as well as its crystal structure are not well determined yet. PEO-thiourea complex was first obtained by Parrod and Kohler,15,108 then further researched by Bailey,17,109 Tarnrutskii110 and more recently by Campo et
al.18 The PEO:thiourea molar ratio is considered as 1:2, 1:0.7 and 1:4 by these three groups, respectively. As mentioned above, the diameter of thiourea channels is close to that of β-CD, therefore, a single PEO chain seems too small and two PEO chains seem too large to fit in one thiourea channel. In other words, the channel-structured PEO-thiourea complex might be as unstable as PEO with β-CD and should collapse into uncomplexed thiourea rather than forming the channel structure18 Therefore, it is worth further studies to confirm the composition and crystalline structure of the PEO-thiourea complex and the “metastable” PEO-urea β complex.
In addition to the complexes formed with urea and thiourea, PEG/PEO has also been found to form complexes with other organic molecules, such as p-nitrophenol(PNP), resorcinol, 2-methyl resorcinol (MRES), hydroquinone (HYD) and some inorganic salts, such as mercuric chloride, sodium thiocyanate (NaSCN) and sodium iodide (NaI) (Table 1.2). Different conformations have been observed for the bond sequence O-C-C-O in PEO chains, and the most popular ones are TTT, TGT, TGG(TG-G-) and TGG-. The dihedral angle is 180º for trans and 60º and 270º (-60 º) for G and G-, respectively. The most commonly observed PEO form is the 72 helical conformation with trans-gauche-trans TGT sequences.111 Another less observed form is the triclinic planar zigzag conformation with all-trans (TTT) sequences that can be obtained by stretching to two folds112 or by freeze-drying dilute solutions.113
The introduction of small host molecules in the PEO unit cell has different effects on the conformation and the crystal structure of PEO chains. For weak Van der Waals interactions, such as PEO-p-dihalogenobenzene complexes, the conformation of PEO molecules is nearly identical to that found for pure PEO.19 However, stronger electrostatic interactions, such as in the PEO-HgCl2 complex, induce dramatic modification of the chain conformation. Two more models of PEO chain with HgCl2 complex were proposed by Tadokoro et al.6,7 One is the zigzag form I with a TTTTGT conformation and the other is the zigzag form II with a TGGTG-G- conformation (Figure 1.7). The population of TGT and TGG conformation of PEO was observed to increase and that of the TTT, TGG- conformations to decrease upon complexation with LiI.10 The
zigzag form I TTTTGT has been considered as the main conformation of PEO in the complex with LiV3O812 and CdPS3 preintercalated with hydrated alkali cations.13 As to the complex with LiCF3SO3, 8,9 PEO may still take a TGT conformation but the gauche torsional angle of the C-C bond decreases from 79º in bulk PEO to 47º in the complex. When hydrogen bonds are formed between the oxygen ether of PEO chains and theO-H or N-H group of guest molecules, such as with PEO-p-nitrophenol, the PEO chains adopt a glide-type conformation TGTTGTTTT stabilized by hydrogen bonds and this conformation is not helical as in pure PEO.114
Table 1.2. The conformation of PEO chains and the crystalline structures of host-guest complexes formed between PEO and some small molecules.
Host molecules PEO
conformations
Crystalline structrue Ref.
Pure PEO 72 helix, TGT Monoclinic, a = 8.05Å, b = 13.04Å, c = 19.48Å, β= 125.4º 111,115 Urea 72 helix, TGT 41 helix (assumption) Trigonal, a = b = 10.43Å, c = 9.12Å Tetragonal, a = b= 7.3 Å , c = 19.51Å 16,42 58 p-nitrophenol (PNP) TGTTGTTTT α form: Triclinic, a = 11.72Å, b = 5.55Å, c = 15.57Å, α = 90.7º, β = 87.1º, γ = 104.0º β form:metastable 22
Resorcinol 72 helix, TGT α form: Orthorhombic, a = 10.5Å,
b = 10.13Å, c = 9.776Å
β form:metastable
24
2-methyl resorcinol (MRES)
72 helix, TGT α form: orthorhombic, a = 10.4Å,
b = 15.9Å, c = 18.5Å;
β form: orthorhombic, a = 11.1Å,
41 helical b = 18.6Å, c = 10.6Å Hydroquinone (HYD) 72 helical, TGT Triclinic, a = 11.7Å, b = 12.0Å, c = 10.6Å, α = 78º, β = 64º, γ = 115º 26 Mercuric chloride TTTTGT TGGTG-G
-Zigzag form I: Orthorhombic,
a = 13.55Å, b = 8.58Å, c = 11.75Å,
Zigzag form II: Orthorhombic, a = 7.75Å, b = 12.09Å, c = 5.88Å, 6,7 sodium thiocyanate (NaSCN) 21 helix, TGTTGTTG-T TGGTG-G -Form I: Monoclinic, a = 16.83Å, b = 10.64Å, c = 7.19Å, β = 125.5º
Form II: Monoclinic, a = 7.55Å,
b = 12.10Å, c = 5.83Å, β = 97.5º
11
Sodium iodide (NaI) 21 helix, TGTTGTTG-T
Monoclinic, a = 18.15Å, b = 8.41Å,
c = 7.98Å, β = 122.3º
116
Lithium Iodide (LiI) TGT,TGG N/A 10
p-C6H4Cl2 p-C6H4Br2 72 helix, TGT 72 helix, TGT Orthorhombic, a = 16.48Å, b = 9.51Å, c = 27.86Å Orthorhombic, a = 16.74Å, b = 9.68Å, c = 27.98Å 19,20 LiV3O8 TTT, TGT N/A 12 LiCF3SO3 TGT N/A 8,9
Figure 1.7. Side and top view of the structures of the four model conformations of PEO. On the side of the polymeric chains, a line indicates the dimension of the repeating units of each conformation along the chain length direction.6,7,111,115,117
It is reported118 that the TTT conformation is the lowest in energy, while the TGT and TGG conformers are only 0.1- 0.2 kcal/mol higher in energy in the model compound 1,2-dimethoxyethane (DME). Of the three conformers, TGG is more popular in the gas state with strong 1,5 CH---O hydrogen-bond interactions119 and TGT is stabilized by polar interactions in the liquid or solid states,118 while the nonpolar TTT conformer is most stable in an argon matrix at 34K.120 In the melt state or in an aqueous solution, the molecular dynamics simulations121-127 have revealed that the conformation of DME and PEO depends strongly upon temperature and solution composition. In general, the conformations of TGT and TGG are more favorable than TTT and TGG -when the solution is more dilute, thus Smith et al. classified the former as hydrophilic and the later as hydrophobic.123 The solution stabilization energy is about 1.7 kcal/mol. Therefore, the population of TGT and TGG conformation is much more than TTT and
TGG- in aqueous solution. Simulation also showed that PEO chains in the melt are more extended than the phantom chains which represent the unperturbed chains in θ solution and TGT, TTT conformations are more favorable in the totally amorphous state.
1.2 Electrospinning
1.2.1 History and set-up
In the urea, thiourea and cyclodextrin inclusion complexes, guest polymers are packed in one-dimensional, narrow channels or tubular structures constructed from either an essentially infinite three-dimensional hydrogen-bonded network of urea molecules or from covalent-bonded oligomers of anhydroglucopyranose. The guest polymer chains are thus highly extended and oriented at the molecular scale inside the channel. However, the polymer and the inclusion complexes themselves are not aligned at the larger macroscopic level. To optimize the orientation of channel-structured urea, thiourea and cyclodextrin complexes, it is necessary to find a way to align the channels at the macroscopic level. Here we use the electrospinning method.
Electrospinning, also known as electrostatic spinning, is a highly versatile method to produce continuous fibers with diameters ranging from several nanometers to several micrometers. It is applicable to most soluble or fusible polymers, polymer blends, nanoparticles or drug-impregnated polymers and ceramic precursors. The simplicity of the setup and the possibility of large scale productions make this technique attractive for academic research and industry as well. Electrospinning relies on theoretical principles developed in the early studies on the application of electric potentials to liquid drops. In 1600, Gilbert first demonstrated that a drop of water on a smooth surface can be extended into a cone if a piece of rubbed amber is held at a suitable distance from it.128 In 1745, Bose described the process of applying a high electric field on liquid drops to produce electrohydrodynamic spraying of fluids.129 In 1882, Lord Rayleigh researched the electric field needed to overcome the surface tension of a liquid drop and the stability criterion of thin liquid jets in electric field.130 The most
important patent describing the electrospinning of polymers was issued to Formhals131 in 1934. He successfully electrospun cellulose acetate fibers in an acetone/alcohol solution and used a movable thread-collecting device to collect aligned and stretched fibers. In several following patents, Formhals achieved simultaneous electrospinning of a number of fibers by using multiple nozzles from the same polymer solution to increase the productivity and generate composite fibers on a moving base.132-135 Following the work of Formhals, Taylor researched the jet forming process and found that the pendant droplet developed into a cone (now called Taylor cone) when the surface tension was balanced by electrostatic forces and the fiber jet was emitted from the apex of the cone, which is one of the reasons why electrospinning can generate small diameter fibers.136
(1544-1603) (1710-1761) (1842-1919)
Figure 1.8. William Gilbert (left), Georg Matthias Bose (center) and Lord Rayleigh
(John William Strutt) (right).
Baumgarten studied the relationships between the processing parameters, such as solution viscosity, flow rate and applied voltage, and the structural properties of electrospun fibers by using a high-speed camera. He discovered that fiber diameters decreased with decreasing solution viscosity but did not have a proportional decrease with increased applied voltage.137 Then Larrondo and St. John Manley demonstrated that continuous filaments of rapidly crystallizing polymers, such as polyethylene (PE) and polypropylene (PP), can be electrospun from the melt using an electric field as the only
driving force. The electrospun fibers prepared from a melt had relatively larger diameters than fibers spun from a solution, but these diameters are still much smaller than those of textile fibers prepared by conventional melt-spinning or solution- spinning.138-140
Despite these early discoveries and research, electrospinning did not attract much attention until several research groups, especially Reneker,141,142 revived interest in this technique in the 1990s to prepare nano or micro fibers from a wide range of polymers. One reason for this fascination is the interest in the field of nanoscience and nanotechnology. Another reason is its combination of fundamental and applied research from different science and engineering disciplines. There are several methods of producing nanofibers, such as nanolithography,143 melt-blowing,144 island-in-sea,145 gas jet technique146 and self-assembly of multicomponents.144,147,148 But these methods are limited by their restricted material ranges, cost and production rate. Electrospinning is a technique that allows the production of continuous polymeric fibers with diameters ranging from nanometers to a few microns, and thus with an inherent high surface-to-volume ratio. This method can be applied on a wide range of soluble or molten polymers with sufficiently high moleclular weight, including bulk polymers, polymer blends and polymers loaded with nanoparticles, metals and ceramics. It also allows making fibers with complex architectures, such as porous, beaded, ribbon, core-shell, or hollow fibers.149-158
To produce electrospun nanofibers, a concentrated polymer solution is forced through a syringe and subjected to a large electric field applied between a metallic needle and a collection target. When the potential difference is large enough, charge repulsion overcomes the surface tension of the viscous solution and a charged jet is expulsed at high speed towards the grounded (or oppositely charged) target (Figure 1.9). This jet travels with a whipping motion while the solvent rapidly evaporates, leading to the formation of a highly extended polymer fiber with a much reduced diameter. The behavior of electrically driven jets, the shape of the jet originating surface and the jet instability are three important areas that need to be understood for controlling the
electrospinning process. Taylor showed that a conical shaped surface with an angle of 49.3º is formed when a critical potential is reached to disturb the equilibrium of the droplet, which will initiate the electrospinning process by jetting when the potential further increases.136 The jet ejected from the apex of the cone continues to narrow down along the path to the collector and undergoes a chaotic motion or bending instability.159 The bending instability was originally thought to be occurring by a single jet splitting into multiple thin fibers due to the repulsive forces of the charged ions within the electrospinning jet, resulting in smaller diameter fibers.141 However, viewed with high-speed photography by decreasing exposure times down to 1 ms, it was confirmed that the unstable region of the jet is in reality a single rapidly whipping jet and that it was the whipping instability that causes the stretching and bending of the jet into a smaller fiber. The whipping instability is dominant with high charge density in the jet and can occur through either: (1) small lateral fluctuations in the centerline of the jet, resulting in the induction of a dipolar charge distribution which will interact with the external electric field to further bend the jet, or (2) the mutual repulsion of surface charges carried by the jet, causing the centerline to bend.160,161 Reneker et al. have contributed significantly to understanding the instability behavior and have mathematically modeled the jet path, trajectory, velocity of jet, area reduction ratio and the longitudinal strain of the jets.161
Figure 1.9. Basic setup of electrospinning (left) and real-time images of the
1.2.2 Parameters influencing electrospinning process
For the formation of electrospun fibers, a high voltage is applied to the polymer solution or molten polymer to provide a stretching force. When a sufficiently high voltage is generated to overcome the surface tension of the polymer fluid, a jet of polymer fluid erupts. If the molecular weight and concentration of polymer is high enough to form polymer chain entanglements and to prevent the electrospinning jet from breaking up, an electrospun fiber is formed when the solvent evaporates. In principle, nearly all soluble or fusible polymers can be processed to get electrospun fibers, provided that both intrinsic properties of polymer molecules (such as viscosity, concentration, molecular weight, surface tension, electrical conductivity and entanglement) and the process parameters (such as applied electric field, capillary-collector distance, polymer flow rate, and capillary diameter) are correctly adjusted. Grouped in order of relative impact on the electrospinning process, these parameters will be discussed separately.
1.2.2.1 Applied voltage
As shown in Figure 1.9, a spherical droplet is formed on the polymer solution pumped at the end of the needle. To eject fibers out of the droplet, a critical voltage is needed to overcome the surface tension of the droplet. Surface tension is a property of the surface of a liquid. It results from an imbalance of molecular forces in a liquid. In the bulk of the liquid each molecule is pulled equally in all directions, resulting in a net force of zero. At the surface of the liquid, such as in the air, the molecules are pulled inward by other molecules inside the liquid and are not attracted as intensely as by the molecules in the neighboring medium. As a result, a net force inwards is produced on the surface, which will diminish the surface area until it has the lowest surface area possible. In 1969, Taylor163 derived the equation (equation 1.1) for the critical electric potential needed to transform a droplet of liquid into a cone (thereafter named Taylor cone).