Publisher’s version / Version de l'éditeur:
Vous avez des questions? Nous pouvons vous aider. Pour communiquer directement avec un auteur, consultez la
première page de la revue dans laquelle son article a été publié afin de trouver ses coordonnées. Si vous n’arrivez pas à les repérer, communiquez avec nous à [email protected].
Questions? Contact the NRC Publications Archive team at
[email protected]. If you wish to email the authors directly, please see the first page of the publication for their contact information.
https://publications-cnrc.canada.ca/fra/droits
L’accès à ce site Web et l’utilisation de son contenu sont assujettis aux conditions présentées dans le site LISEZ CES CONDITIONS ATTENTIVEMENT AVANT D’UTILISER CE SITE WEB.
RTO-TR-AVT-080 - Vortex Breakdown over Slender Delta Wings, pp. 1-1-1-20,
2009-10
READ THESE TERMS AND CONDITIONS CAREFULLY BEFORE USING THIS WEBSITE.
https://nrc-publications.canada.ca/eng/copyright
NRC Publications Archive Record / Notice des Archives des publications du CNRC :
https://nrc-publications.canada.ca/eng/view/object/?id=dd9ec9d3-e2d9-45f9-b658-a69481cc91e9 https://publications-cnrc.canada.ca/fra/voir/objet/?id=dd9ec9d3-e2d9-45f9-b658-a69481cc91e9
NRC Publications Archive
Archives des publications du CNRC
Access and use of this website and the material on it are subject to the Terms and Conditions set forth at
Introduction and highlights
Chapter 1 – INTRODUCTION AND HIGHLIGHTS
X.Z. HuangInstitute for Aerospace Research National Research Council
M10, 1200 Montreal Rd. Ottawa, Ont. Canada K1A 0R6
[email protected] N.G. Verhaagen
Delft University of Technology Department of Aerospace Engineering P.O. Box 5058, 2600 GB, Delft, the Netherlands
ABSTRACT
This chapter highlights the goals and achievements of NATO/RTO/AVT Task Group AVT-080: Leading-edge Vortex Breakdown over Slender Wings. After a survey and assessment of current experimental data sets in NATO and PfP countries, eight reliable experimental data sets have been collected and compiled. These data sets include time-average results at static model conditions, ensemble-average results at dynamic model conditions and unsteady results at static/dynamic model conditions. Ten state-of-the-art numerical solutions have been obtained on an ONERA 70° delta wing test caseusing different numerical methods, codes and grids For other wing configurations and test the effects of tunnel wall interference and of interactions between vortices are calculated. In addition to the experimental data and computational solutions, three advanced analytical solutions are included.
1.1
INTRODUCTION AND BACKGROUND
The tactical advantage of high manoeuvrability and agility of military air vehicles has been an incentive to continually expand their flight envelope. For such vehicles, delta-type wings are often used since the formation of leading-edge vortices generates more lift than straight wings and their compact structure has a weight advantage. A disadvantage, however, is that the leading-edge vortices may break down under certain conditions. This results in severe discontinuities and a loss of lift, which deteriorates the aircraft performance, stability and control. The traditional linear or local-linear aerodynamic models are not valid under these conditions. This makes the development of adequate prediction methods more complex and difficult. As a consequence, hitherto predictive capabilities have largely lagged behind operational requirements. A fundamental obstacle is the lack of sufficient understanding of the flow physics associated with vortex breakdown.
The flow over a delta wing at high angle of attack is characterized by the formation of strong leading-edge vortices. For simplicity, the basic cross flow structure of such a three-dimensional vortex is given in Fig. 1. The free shear layer rolls up in a spiral fashion to the rotational or outer core. The smaller viscous sub-core or inner sub-core region in the center of the vortex is dominated by viscous forces and characterized by large gradients of velocity and pressure (Verhaagen and Ransbeeck [1]). A key feature of three-dimensional vortex cores is the strong interaction between the swirl and the axial velocities, and the low pressures in the sub-core region. The core induces strong swirl velocities and associated with this a strong negative pressure (suction) on the leeward surface of the wing. Due to the interaction between the core and
the boundary layer on this surface, a secondary vortex and at certain conditions even a tertiary vortex is formed near the leading edge.
Non-intrusive velocity measurements and numerical simulations have revealed the existence of vortical sub-structures in the free shear layer. Gursul [3], [4] gives an in-depth discussion of these sub-structures. Observations by Lowson [5], and Gad-el-Hak and Blackwelder [6] learn that the free shear layer rolls up periodically into discrete vortical substructures. This is thought to be a consequence of a Kelvin-Helmholtz (K-H) type of instability of the shear layer. The frequencies of the sub-structures correspond to those predicted from linear stability analysis of the cross-flow shear layer. Gursul also discusses the correlation between the presence of the K-H instability and random displacements of the vortex core (“vortex wandering”). Apart for the unsteady K-H instability, steady sub-structures formed by the stationery small-scale vortices are observed in the free shear layer. These spatially fixed sub-structures are evident in time-average measurements. The sub-structures follow a helical trajectory around the core and the spacing (frequency) between the sub-structures remain relatively constant. Measurements by Mitchell [9] show these structures, which can even persist after vortex breakdown (Fig. 5). The sub-structures tend to diffuse with increasing turbulence [1]. Numerical simulations of the time-average flow solution by Visbal and Gordnier [6] confirm the existence of these sub-structures. They also give the instantaneous flow solutions and show the transition process with increasing Reynolds number (Fig. 3). At certain conditions, e.g. at high incidence, the primary vortex core will break down. Lambourne & Bryer [6] visualized two types of breakdown in a water tunnel (Fig. 4a); a bubble- and spiral-type of breakdown. The latter type is most frequently observed in delta wing experiments. In that case, downstream from the breakdown point the core filament abruptly kinks and starts to spiral around at a certain frequency and eventually disintegrates into a “wake-like” turbulent flow (Fig. 4b). Nevertheless, this breakdown process gives the flow in the vicinity of the spiral a spatial and temporal periodicity that has an affect on the the wing pressure distribution. The unsteady flow downstream of the vortex breakdown point induces an oscillating pressure distribution on the wing causes a loss of lift, wing buffeting and an unstable pitching and rolling behavior.. Interaction of burst vortices with tail surfaces is the cause of structural vibrations and fatigue problems occurring in tail fins of modern fighter aircraft (Fig. 6). All these unwanted phenomena limit the performance and manoeuvrability of military aircraft. Since the breakdown of leading-edge vortices has a large impact on the aerodynamic behavior and flight mechanics of current and future military aircraft, understanding of the flow physics and the parameters that affect the onset of vortex breakdown is essential.
Different theories were developed to explain the onset of vortex breakdown: from a quasi-cylindrical approach [8], positive feedback of negative azimuthal vorticity [9], critical state or wave theory [10], to weakly non-linear wave theory [11]. A number of review articles have been published on vortex breakdown aspects [12-18]. Nevertheless, it is still difficult to predict the onset of vortex breakdown and its response to motion variables in real applications. Thus, it is important to collect and to clarify existing experimental results in order to develop a sound theory and to validate numerical solutions.
The behavior of vortex breakdown has been the subject of a large number of experimental studies since Werlé [19] first observed this phenomenon over a delta wing in 1954. A problem is that the correlation between the data is often poor. For example, Fig. 7 [20] shows that there is a significant scatter in the vortex breakdown location over simple delta wings measured in different wind tunnels. This complicates the understanding of the vortex flow physics. The rapid progress in computer hardware and Computational Fluid Dynamics (CFD) codes has made it possible to numerically simulate the complex flow associated with vortex breakdown. However, before a specific code can be used with confidence, it is crucial to validate its correctness in predicting the flow physics and to verify its accuracy against valid experimental data. Thus, to first assess and clarify existing experimental data is a prerequisite.
In view of these requirements, a proposal titled “Vortex Breakdown over Slender Wings” was approved by the Applied Vehicle Technology (AVT, Research and Technology Organization (RTO) as the Task
INTRODUCTION AND HIGHLIGHTS
Group, AVT-080. This Task Group was formed in the autumn of 2000 and has since met twice a year till summer 2003 when the activities of the various participants was presented at an AIAA summer conference. The participants represent ten NATO and PfP countries and are active in the corresponding experimental, CFD and theoretical fields. The objective and working strategy of the AVT-080 are described below.
1.2
OBJECTIVES AND CRITERIA OF AVT-080
1.2.1 OBJECTIVES
In general, an AVT Task Group’s activity aims at allowing researchers from different nations to work together in order to solve a particular research and technology problem of relevance to NATO’s interests. The objectives of AVT-080 are briefly as follows:
(1) To collect reliable experimental data sets on the leading-edge vortex behavior over delta wing configurations.
(2) To generate different CFD solutions for the flow over a delta wing at high angle of attack and to validate these solutions against a reliable experimental data base.
(3) To develop analytical solutions at flow conditions where vortex breakdown occurs.
In order to fulfil these objectives, the AVT-080 has been subdivided into three sub-groups: The Experimental, CFD and Analytical sub-group. The following working steps were decided upon for these sub-groups:
(1) To conduct a survey and collect reliable candidate experimental databases on vortex breakdown over delta wings with well described test conditions. These include time-average results in static model conditions, ensemble-average results in dynamic model conditions and unsteady results in static/dynamic model conditions
(2) To compile, compare and clarify the results of the candidate data sets with the aim of fulfilling current and future requirements of CFD validation and verification on military applications.
(3) To generate CFD solutions with different grid configurations, turbulence models, etc. for the test conditions of the selected experimental data set and to compare these solutions with the selected data set.
(4) To obtain solutions with a validated CFD code for the case of the wing in free flight conditions. Corrections should be derived for the presence of wind tunnel walls and supports.
(5) To develop and validate analytical solutions that help to understand and predict the aerodynamics when vortices and their breakdown are involved.
1.2.2 REQUIREMENTS FOR CANDIDATE OF EXPERIMENTAL CASES
The following criteria were guidelines for choosing candidate experimental cases:
(1) The geometry of the model configuration should be closely related to high-performance military aerial vehicle and yet be as simple as possible.
(2) The experimental test conditions should be clearly defined and the measured data should be sufficiently accurate and detailed.
(3) Those cases should be either fulfill the current requirement of CFD validation and verification or be ahead of current status of CFD capability so that the CFD researcher can use these as a staircase for
INTRODUCTION AND HIGHLIGHTS
future applications.
Specifically, the experimental test case should provide the following information: (1) Accurately measured model shape and surface finish.
(2) The actual position and motion of the model, including both static and dynamic deformations if it occurs.
(3) The behavior of the boundary layer on the model. (4) The tunnel wall geometry and boundary layer behavior. (5) Specification of model support and tunnel wall interference
(6) Specification of the measurement methods and the accuracy of the measured data.
Since the delta wing configuration is widely used for military air vehicles and is simple in geometry, this configuration was chosen for the considered benchmark.
Even for a simple delta wing due to the complexity of vortical flow at high incidence, traditionally conducted experiments tend to produce qualitative rather than the accurate quantitative results that are needed for validating CFD solutions. Moreover, experimental results obtained on one and the same delta wing geometry seldom reproduce when tested in different facilities. Significant discrepancies, especially in the vortex breakdown location, are present in the data obtained at different institutes. Small geometric variations, model deformations due to aerodynamic loads as well as differences in the test conditions, and measuring techniques significantly affect the measured vortex breakdown position and thus degrade the accuracy of the results. A reliable assessment of the accuracy of the data generated in ground tests is a first requirement [Chapter-2]. Thus, an evaluation of the data sets is imperative, so that accurate data can be selected that can be properly used for the development of state-of-the-art theoretical or computational flow models. These models will aid in the improvement of the performance of existing highly manoeuvrable military aircraft and help design the configuration of future combat aircraft. The objective hence is to extract as much useful and quantitative information as possible after a critical examination and comparison of existing data sets of the flow over delta wings with special attention to vortex behavior and vortex breakdown.
After a thorough screening of the available candidate experimental test cases, the cases of delta wings with a 65° and 70° leading-edge sweep back angle were found to be best suited to fulfil our requirements.
1.3 PROGRESS OF EXPERIMENTAL SUB-GROUP
1.3.1 TEST CASE CATEGORIES
Leading-edge vortex flow and, especially, breakdown are characterized by the occurrence of unsteady flow phenomena. In order to avoid neglecting important information about these flow phenomena, the Experimental Sub-group has considered the following three test case categories:
(1) Time-averaged results obtained at static model conditions, (2) Ensemble-averaged results obtained at dynamic model conditions (3) Unsteady results obtained at static/dynamic model conditions.
The first category includes the measured time-averaged vortex breakdown location, air loads, surface pressure distributions measured by pressure taps and Pressure Sensitive Paint (PSP), three-dimensional velocity vector field measured by Laser Doppler Velocimetry (LDV) or Particle Image Velocimetry (PIV) and surface flow topology at static model conditions.
The second category consists of ensemble-average air loads, surface pressure distribution (measured with unsteady pressure transducers), smoke/laser-light-sheet flow visualization, as well as free and forced
INTRODUCTION AND HIGHLIGHTS
motion history at dynamic model conditions.
The third one includes the results of instantaneous azimuthal vorticity, RMS swirl velocity, spectra and fluctuation of breakdown locations, pressure fluctuations on wing and tail fin, etc. at static or dynamic model conditions.
The three categories cover relatively simple to more complicated test cases. In the following overview examples are given of test cases belonging to these three categories. It should be noted that this overview is not complete; many good test cases could not be included due to limited time and resources.
1.3.2 OVERVIEW OF PUBLISHED EXPERIMENTAL DATA SETS
1) ONERA 70° delta wing data set
Mitchell [9] reports on ONERA data sets in Chapter 3. Provided are profound time-average and quantitative data for the surface pressures and the on- and off-the-surface flow over a delta wing at static conditions. The model was a simple 70° delta wing with a flat upper surface and sharp leading-edges (Fig. 8). The lower surface edges were bevelled at 15°. In contrast to most delta wings tested in other experiments, the trailing edge was not sharp but blunt. The root chord was 0.95 m. The model was supported by a sting/support assembly on the lower surface that kept the wing at about the center axis of the test section with changing α. (Fig. 9). The tests were conducted in the ONERA F2 wind tunnel with a test section 1.4-m wide, 1.8-m high and 5.0-m long. Most data were acquired at α = 27o and an air speed of 24 m/s (M = 0.069), yielding a Rec = 1.56x10⁶. The characteristics of the vortices and their breakdown
locations were determined from qualitative and quantitative surface and flow field visualization and measurement techniques. Laser sheet visualization and 3-D LDV results were analyzed in order to provide details on the flow field and on the vortex breakdown phenomena. Surface oil flow visualization and steady surface pressure measurements were examined to identify the influence of vortex breakdown on the leeward surface of the delta wing. At abovementioned conditions the breakdown location was identified at x/c = 0.65. Transition of the upper-surface boundary layer from laminar to turbulent was evident from a kink in the secondary-separation line at x/c = 0.40. It is worthwhile to mention that the support interference and blockage caused by the sting/support assembly was estimated to cause an upwash of by 2~3o. This upwash may have promoted the vortex breakdown location upstream and have an effect on the level of the surface pressures and flow field data.
2) NASA Langley Research Center 65° delta wing data sets
Chu and Luckring [23] report on a NASA LaRC test case in [Chapter-4]. The test case is characterized by profound pressure data at high Reynolds and Mach numbers (Re up to 120(?) 36x106 and M up to 0.9). The model was a 65° delta wing and is depicted in Fig. 10. It had a length of 0.654 m (25.734 in). The central part of the model was flat with a sting fairing at the rear. A bent sting assembly supported the model. Four interchangeable leading-edge sets were available with sharp, small, medium and large radii. Normalized by the mean aerodynamic chord, the radii had values of 0, 0.05, 0.15 and 0.30 percent, respectively. The wing and sting surfaces are represented by fully analytical functions. The model had a total of 183 pressure taps distributed over the upper and lower surface of the wing. In addition, normal force and pitching-moment coefficients were also presented for the above Reynolds and Mach number ranges. The tests were conducted in the National Transonic Facility at NASA Langley which has test section 8.2 ft high by 8.2 ft wide by 25 ft long with a slotted ceiling and floor. This data set gathered for a wide range of Reynolds and Mach numbers and different leading-edge shapes could help to investigate the effect of boundary conditions, compressibility and viscosity on the characteristics of the vortex flow. 3) IAR/USAF-AFRL static and dynamic test cases
The IAR/AFRL database collected and reported by Huang [24] in Chapter 5 has information for all three
INTRODUCTION AND HIGHLIGHTS
categories of test cases, from time-averaged results at static model conditions to unsteady results at static/dynamic model conditions. Many different kinds of model have been tested; from diamond to delta wing with leading-edge sweep angles from 55° to 75°. Moreover, individual parts of the models, such as the leading edge, center body and fairing, etc., were designed to be interchangeable, with one example shown in Fig. 11. The contributions of individual parts on aerodynamics can thus be investigated. The data were acquired at both static and dynamic test conditions. The dynamic tests were conducted at high angular rate in roll, pitch and non-planar coning motions. The waveforms of the motion include sinusoid, ramp-and-hold and free-to-roll motion. The database consists of surface oil-flow visualization results, off-surface laser-smoke sheet and PIV measurements, off-surface pressures (acquired through 57 pressure taps, unsteady pressure transducers and PSP), aerodynamic loads and motion histories. Most of the tests were conducted either in the IAR 6ft by 9ft low-speed wind tunnel or in the AFRL 7ft by 10ft wind tunnel. The coning test was conducted in the IAR 15in by 20in water tunnel. The angle of attack, roll angle and coning angle ranges from 0° to 90°, -90° to +90° and –360° to +360°, respectively with maximum non-dimensional angular rate of 0.2 in pitch and roll (in wind tunnel) and 0.6 in coning (in water tunnel). Most of the tests were carried out at a Mach number M = 0.3 and a Reynolds number Re between 2 and 3 x 10⁶ based on mean aerodynamic chord.
4) Bath’s University unsteady flow behavior test cases
Gursul’s experimental data [5], [6] reported in Chapter 6 are helpful for the validation of solutions of the unsteady characteristics of burst and unburst vortices. His data has been obtained on delta wings with sweep angles of 60°, 65°, 70°, 75°, 76° and 80°. The models had a flat upper surface and were beveled at 45° on the windward side. The experiments were carried out in an open-circuit wind tunnel with a 0.30 m wide and 0.30 m high cross section. The models were sting mounted and the measurements conducted at Reynolds numbers ranging from 2.5 to 10 x 104. The data set includes information about the fluctuations in the velocity, pressure and vortex breakdown locations. Large amplitude velocity fluctuations including the variation of RMS swirl velocity, time-averaged swirl velocity and their characteristic value of probability density function were measured. Moreover the effect of Re on the maximum RMS swirl velocity and the effect of vortex breakdown on pressure fluctuation of the helical mode instability were investigated. A dimensional circulation was introduced to study the helical mode instability and the dominant dimensionless frequency. In addition, the time history of axial breakdown location and its spectra as well as the dominant frequencies in the wake of breakdown were reported in its data set. These data will be very valuable if for the validation and verification of CFD solutions of the unsteady behavior of the vortex and its breakdown.
5) Notre Dame University pitch and roll test case
Nelson [2][20] discusses the Notre-Dame University test case in Chapter 7. This case is one of the earliest experiments presented in this RTO report. It has information for static and dynamic test conditions. Both pitching and rolling oscillations with large amplitudes were carried out. Moreover, wing rock experiments were conducted and investigated. Delta wings and double-delta wings with different sweep back angles were tested. The experiments were performed in the 2 ft by 2 ft test section low-speed wind tunnel at the University of Notre Dame Aerospace Engineering Laboratory. The maximum velocity is approximately 52.5 ft/s with a corresponding Re of 3 x 10⁵ per ft root chord. Results include smoke and laser-sheet flow visualization, surface pressure, velocity, vorticity vector field measured by hot wire probe and balance data. A typical laser light sheet illumination of the vortical flow over an 85° swept delta wing at α = 10° is shown in Fig. 3. The Kelvin-Helmholtz instability of the free shear layer and its sub-structures can be clearly observed from that figure.
6) Delft University and IAR 65o Delta Wing Surface flow topology studies
The topology of the wing surface skin-friction lines determined with surface oil–streak techniques
INTRODUCTION AND HIGHLIGHTS
provides important information about the time-averaged effect of the vortex flow on the surface boundary layer. Several investigators of the Experimental Sub-group have performed detailed studies of the topology on delta wings. Verhaagen and Jobe [22] studied the flow over a 65o delta wing at sideslip in a low-speed wind tunnel at the Delft University of Technology. The model had a chord length of 0.665 m, a flat upper surface and bevelling on the bottom surface. The model was tested at a constant α = 30o and at angles of sideslip ranging from –20 to +20o. Special attention was paid to the flow on the apex, the boundary-layer transition and tip regions. The topologies for the flow on the apex give insight in the origin of the vortices over the delta wing and may help the numerical modelling of the flow in this region. Huang [23] studied the topology evolution, or bifurcation, and different flow topology patterns as a function of various flow parameters e.g. roll angle, angle of attack, flow speed, etc. Tests were conducted in the IAR and USAF/AFRL low speed wind tunnels mainly on a 65o delta wing at different sting angles and wide range of roll angles. Special attention was paid to the critical states in the airloads. High resolution results clearly show the evolution in time-averaged flow patterns, the vortex whorl at the end of secondary and tertiary vortices and possible correlation between flow topology changes and the airload critical states under certain conditions.
Owning to large time scale existing in the response of vortex breakdown to motion variables, the behavior of the vortex and its breakdown in dynamic model conditions is quite different from static conditions for the same attitude. The dynamic case will also be of high interest for military applications. To meet this demand the Subgroup selected the following test cases.
7) TsAGI static and dynamic test case
In Chapter 9 Khrabrov and Greenwell summarizes the results of 70° and 65° delta wings tested in the TsAGI low-subsonic wind tunnel T-103 []. The 70° delta wing has two different sizes and leading-edge shapes. To verify TsAGI’s dynamic data an identical 70° delta was manufactured and tested at DERA, Bedford, UK. For the 65° delta wing, there were also two models, one of which has the same shape as the IAR/USAF 65° delta wing. Static and pitch oscillation dynamic tests were conducted in the T-103 wind tunnel, which has an open working section with elliptical cross section 2.33 m x 4.0 m. As shown in Fig. 12, two different dynamic rigs (large and small amplitude pitch oscillation) were constructed and used in the tests. A five-component internal balance was used to measure the airloads during tests. Leading-edge shape and center body effects in static and dynamic tests with large and small amplitude were also studied using a mean angle of attack in the range of –10° to 36°, an amplitude of 5° to 26° and an oscillation frequency of 0.2 to 1.5 Hz.
8) TPI Test Case
De Luca et al. tested a 65° delta wing in the low-speed wind tunnel of Politecnico di Torino (T.P.I.) both in static and dynamic conditions [25] and [Chapter-10]. The model had a flat upper surface and a sting connected to the lower surface covered by a center body. The internal balance measured the static coefficients. The static tests included flow visualizations, force and pressure measurements. Steady pressure coefficients were measured on the model’s upper surface to estimate the effect of vortex breakdown on the surface steady pressure distribution. The dynamic test consisted of flow visualizations and force measurements under small amplitude forced oscillations in roll and pitch. Damping derivatives in pitch and roll were measured by the direct forced oscillation technique. Boundary-layer transition was analyzed by means of infra-red thermography (the upper model surface was artificially heated). The tests were conducted at free stream velocities from 10 to 40 m/s and α ranging from 5 to 45° with amplitude ∆α = 5°. This data set provides information on the transition of the boundary layer on a delta wing.
INTRODUCTION AND HIGHLIGHTS
1.3.3 BENCHMARK FOR THE CFD EXERCISE
Although three categories of test cases have been collected by the Experimental Sub-group, considering, the limited time, manpower and CFD capability available, the AVT-080 has decided to limit the benchmark for this current CFD exercise to the first category, i.e. a study of the time-averaged vortex behavior at static model conditions. In addition, the following conditions were taken into consideration for the CFD exercise:
A straight leading-edge delta-wing configuration was selected as being a simple but sufficient representation of wings applied to high-performance military air vehicles.
Sharp leading edges were chosen in order to fix boundary-layer separation.
The test data should contain accurate global information, such as surface pressure and/or vortex flow field vorticity or velocity distributions.
To reduce the number of CFD solutions, the test conditions were limited to a certain angle of attack and a speed range of interest to military aircraft in high–α flight conditions.
After having compared and evaluated the data sets mentioned in the former section and, considering the limited capabilities available for the CFD exercise, the ONERA 70° swept delta wing data set reported by Mitchell [7] and [Chapter-3] has been taken as a benchmark for the validation and verification of the CFD solutions.
1.4
OVERVIEW OF CFD SOLUTIONS
A part of the overview of the computations conducted by members of the CFD-Subgroup is given below. If not stated otherwise, the solutions were obtained for the steady conditions of the ONERA delta wing experiment (α=27°, U∞=24 m/s and Re=1.5x10⁶).
1) NASA LaRC solutions
Pirzadeh in his publications [26] and [Chapter-11] emphasis the effectiveness of an adaptive grid procedure in “capturing” concentrated vortices generated at sharp edges or flow separation lines of lifting surfaces flying at high angles of attack. His method is based on a tetrahedral unstructured grid technology developed at he NASA Langley Research Center. Two steady-state, subsonic, inviscid and Navier-Stokes flow test cases are presented to demonstrate the applicability of the method for solving vortical flow problems. The first test case concerns vortex flow over a simple 65° delta wing with different values of leading-edge radius. Although the geometry is quite simple, it poses a challenging problem for computing vortices originating from blunt leading edges. The second case is that of a more complex fighter configuration. The superiority of the adapted solutions in capturing the vortex flow structure over the conventional unadapted results is demonstrated by comparisons with the wind-tunnel experimental data. The study shows that numerical prediction of vortical flows is highly sensitive to the local grid resolution and that the implementation of grid adaptation is essential when applying CFD methods to such complicated flow problems.
2) USAF WPAFB solutions
Visbal and Gordnier conducted study of the substructures of the leading-edge vortices [28] and [Chapter-12]. They applied a very high-order (6th-order) spatial discretization capable of capturing finer scales of the flow field on a given mesh resolution. Computations are performed for a 75º semi-infinite swept leading-edge at an angle of attack of 25º and Reynolds number Rec=1.8x10⁴, 2.5x10⁴ and 5x10⁴
INTRODUCTION AND HIGHLIGHTS
respectively. This configuration is selected in order to isolate the shear layer dynamics from disturbance associated with vortex breakdown or trailing-edge separation, which can be present in a finite wing. It has found that in contrast to previous numerical efforts, beyond a critical value of Re number, unsteady substructures appear in the shear layer above the wing, and their origin moves closer to the apex. The unset of this unsteady phenomenon is associated with unsteady separation of the wing upper surface boundary layer. The unsteady substructures, which are initially very coherent, exhibit secondary instabilities along their axes further downstream. This process results in the formation of concentrations of vorticity which are stretched and convected in helical paths around the leading-edge vortex. A time-v\averaged representation of the highly unsteady computed flow field is characterized by the existence of helical substructures which co-rotate with the primary vortex similar to those observed in high Reyniold number mean experimental data. This finding suggests that the so-called stationary helical pattern, seen in the time-averaged experimental measurements, is created by the secondary instability of the unsteady substructure as they breakup and convect into the helical velocity field of the primary vortex. It is therefore postulated that, in unsteady delta wing flows, the so-called unsteady and stationary substructures are not two different physical phenomena but rather different representations of the same complex shear transition process.
3) KTH solutions
Görtz, Le Moigne and Rizzi of KTH performed time-accurate Euler and Detached-Eddy Simulations (DES) of the vortex breakdown over the full-span ONERA delta wing at α =27, 30 and 35o [29]-[31], [Chapter-13] and [Chapter-14]. The blunt trailing edge of the ONERA wing was modeled as a sharp one. The unsteady, three-dimensional Euler equations were solved using second-order accurate Runge-Kutta and dual time-stepping, respectively. The simulations capture the mutual interaction between the port and starboard vortices. This interaction is more intense at higher incidences. Spiral-type vortex breakdown was observed to be predominant. The spiral breakdown structure showed good qualitative agreement with the spiral-type breakdown observed in experiments. Spectral analysis of the temporal variation of the aerodynamic coefficients showed that high-frequency oscillations were due to the interaction of the spiral windings with the upper surface of the wing. Periodically, a transformation from spiral- to bubble-type of breakdown occured (Fig. 13). It alternated between the port and starboard side. Its appearance was associated with a significant upstream movement of the breakdown location, resulting in asymmetry between the port and starboard breakdown locations. The breakdown location fluctuations and the asymmetry were responsible for low frequency oscillations of the aerodynamic load coefficients.
In addition, a time-step study was performed for the implicit DES calculations. It demonstrated the demanding nature of vortex breakdown with a time-step size of the order of 10-4 s required for time accuracy. Furthermore, a grid sensitivity study was carried out. Patched grid refinement over the wing by a factor of two in all directions had little influence on the surface pressure distribution. However, the vortex core was better resolved on the refined grid, leading to a significantly better agreement between the computed and experimental breakdown location. These first results showed that DES is capable of predicating the fluctuating vortex breakdown location quite accurately (with reservation for grid influences, which may be greater than the effect of viscosity). The surface pressure distribution, however, was underestimated (with reservation for the wall interference effects in the experiment). This work on DES is only beginning, and more needs to be done to draw firm conclusions.
4) USAF Academy solutions
Morton from the USAF Academy computed the flow around the ONERA delta wing in free flight using a commercial CFD code, COBALT [30] and [Chapter-15]. This package solved the unsteady, three-dimensional, compressible N-S equations on a hybrid unstructured grid. DES simulation was applied to simulate three-dimensional eddies which occur in the unsteady, massive separated (locally reversed) flow of the burst vortex core. Unsteady simulations were run for 10,000 time steps with an iteration plus three
INTRODUCTION AND HIGHLIGHTS
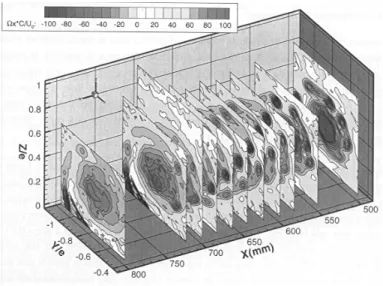
sub-iterations per time step. Average quantities were based on the latter 8,000 iterations. A study was made of the time accuracy and grid insensitivity effects on the solutions. These are important parameters when computing unsteady flow phenomenon such as vortex breakdown. An appropriate time step, non-dimensionalized by freestream velocity and root chord, of 0.0025 with three sub-iterations per time step was determined. The grid sensitivity was investigated by comparing a baseline grid with 2.7 million cells with a 3.2 million grid. For the latter grid an Adaptive Mesh Refinement (AMR) technique was used to increase the number of points in vorticity containing regions such as the free shear layer and the core. The baseline-grid solution shows a vortex breakdown structure that corresponds to that of the experiment, a secondary vortex and also alternating pairs of spanwise coherent vortices flowing off the (blunt) trailing edge. The AMR-grid solution (Fig. 14) displays some additional features such as the stationary sub-structures in the free shear layer that were observed in the experiment. The computed breakdown point is found to lie within the scatter of the experimental data. The trailing edge vortices are evident in the flow behind the trailing edge. These vortices as predicted give rise to a strong peak at a Strouhal number of 8 in a power spectral density analysis of the unsteady normal force.
5) ONERA solutions
LeRoy and Rodriguez from the ONERA Lille Center computed the flow using ELSA, a software package that solves the compressible, three-dimensional, Reynolds-Averaged Navier-Stokes (RANS) equations in a cell-centered finite-volume formulation [31] and [Chapter-16]. The computations on a semi-span representation of the ONERA delta wing were performed on a H-H topology structured mesh. Two turbulence models were used; the Spalart-Allmaras-Rotation-Correction (SARC) and Shear-Stress-Transport (SST). Calculations were stopped after 4000 and 5000 iterations for SARC and SST, respectively, because the residues stopped decreasing and the vortex breakdown point stopped moving. The latter point was predicted to be located at x/c=0.76 with the SST model, and at x/c=0.93 with the SARC model (in the experiment, burst is at x/c=0.65). The computed spiral structure of the burst is in agreement with the experiment, however, the surface pressure distributions and turbulent kinetic energy were less well predicted.
6) University of Glasgow solutions
Allan, Badcock, Barakos and Richards studied the wind tunnel wall effects on the vortex breakdown over a steady and pitching semi-span WEAG-TA15 delta wing that had a leading-edge sweep of 65o and cropped wing tips [32] and a 70o delta wing [Chapter-17]. A cell-centered finite volume technique was used to solve the Euler and RANS equations. The diffusive terms were discretized using a central differencing scheme and the convective terms used a Roe’s scheme. Flow simulations were initially run on an explicit scheme to smooth out the flow and then switched to an implicit algorithm to accelerate convergence. Computations were performed on the delta wing in free flight and in a wind tunnel with three different cross sections. The flow in the wind tunnel was modeled using an H-H topology structured mesh. The steady computations were performed at α = 21o and M=0.4, and were compared with experimental data generated by Löser [33]. The solutions show that the presence of sidewalls moves the breakdown point upstream towards the apex of the delta wing. The roof and floor have a small influence on the burst location. Tunnel blockage does not have a large effect on vortex breakdown. Results for the flow over a pitching delta wing were also presented.
7) NLR solutions
Soemarwoto of NLR Netherlands employed the time-dependent RANS equations as provided in NLR’s CFD system ENFLOW [34] and [Chapter-18]. A variant of the Wilcox k−ω turbulence model was used, with free-stream dependency and the singular behaviour of ω near solid walls resolved. Excessive production of the eddy viscosity inside vortex cores, (typical with RANS-based vortical flow simulation), was avoided by limiting the production of the turbulence kinetic energy through a promoted production of
INTRODUCTION AND HIGHLIGHTS
the dissipation rate. The ratio of the vorticity and strain-rate magnitudes was used to detect vortex cores. The spatial discretization employed a cell-centered finite volume scheme, using Jameson-type artificial dissipation fluxes with matrix coefficients to increase the accuracy. For the time-accurate calculation, a second-order dual-time stepping scheme was applied, using a five-stage explicit Runge-Kutta scheme for each physical time step Low Mach number pre-conditioning was applied. A semi-span delta-wing/sting representation of the ONERA wing was considered with the flow assumed to be symmetric. The flow domain was divided into 3,694,080 structured grid cells in 50 blocks. A non-dimensional time step of 0.0025 was used. After the transient had decayed, a self-sustained unsteady flow solution was evident. A Fourier analysis gave a dominant frequency corresponding to a Strouhal number St≈9. The instantaneous flow solutions indicated a variation of non-dimensional vortex breakdown location in the range of 67-75%, noting that the calculation had not yet covered the period of the lowest frequency.
8) University of Braunschweig solution
Hummel and Estorf [35] and [Chapter-19] applied unsteady Euler equations to a cropped delta wing at a large angle of attack. Compare with most of the other computational solutions, which have been carried out on half wings using a symmetry condition in the centre section of the wing, Hummel and Estort did the calculations both for with or without a symmetry condition in the centre section of the wing. The computations have been obtained using the CFD code FlOWer, which was compiled for the NEC-SX5 architecture in sequential mode. The software has been developed by the Institute of Design Aerodynamics at the DLR Braunschweig, Germany. The conservation laws of mass, momentum and energy in integral form has been solve on a structured mesh. A second order cell-vertex scheme and central differences are used for discretization. For the damping of numerical oscillations, artificial second and fourth order dissipative terms are added to the governing equations. The forth order term, which is dominant in the absence of shocks, is controlled by the user-defined damping coefficient k(4). Integration with respect to tme utilizes a five stage Runge-Kutta scheme to converge the solution. For the unsteady calculations, a global time stepping procedure without implicit residual smoothing is used. Spiral-type vortex breakdown has been calculated for both sides of the wing. Using a symmetry condition the flow field turns out artificially symmetrical. Without such a symmetry condition,even for symmetrical free stream conditions the flow field tirned out to be unsymmetrical: Different vortex breakdown positions, frequencies and phase differences in the rotation of the spiral vortex axes and modifications of the vortex axes have been found for both sides of the wing. After a long running time of the calculations a rather irregular behaviour of the flow quantities turned out.
9) IAR solutions
Benmeddours deployed numerical method to study the geometry effect [36] and [Chapter-20]. The vortex behaviour over a 55° diamond wing and a 65° wing model with or without centerbody were investigated. The inviscid vortex flows over the wings were simulated using a 3D unstructured tetrahedral grids generated via the Octree based Tetra module of ICEM CFD and an in-house Euler flow solver, FJ3SOLV developed at IAR. FJ3SOLV is a cell-centered code based on the finite volume formulation. The convective fluxes were discretized using Jameson’s central difference scheme where second and fourth order dissipation terms were added explicitly for stability. Time integration to steady state wais achieved by means of an explicit 4-stage multi-step scheme and convergence wais accelerated using a combination of local time stepping, implicit residual smoothing, and enthalpy damping techniques. Boundary conditions were imposed using fictitious cells outside the boundaries. Appropriate flow properties were set in these cells to satisfy the slip conditions on the solid boundaries, where the normal velocity was set to zero. At the far-field boundaries a characteristic approach based on Riemann invariants subject to one-dimensional analysis was used. Only sharp-edged models of the wings were considered. The respective mesh sizes (grid cells) used for the different configurations of the two wings were 0.37 million and 0.5 million for 55° diamond wing and 65° delta wing respectively. The effects of the centerbody were
INTRODUCTION AND HIGHLIGHTS
investigated for one flow condition for each wing.
In general, there are no global differences in these comparisons for both wing models. The vortex core location at x/c=0.4 is a little outboard with the centerbody than that without the centerbody. Moreover, it appears that the wing without the centerbody has slightly more suction in the forward portion and less suction in the aft portion. There is little bump in the pressure distribution at where the centerbody edge locates. The local flow acceleration on the centerbody shoulder may cause this local suction bump. Nevertheless, the comparisons show that centerbody may not cause global effects on the pressure distribution at the present conditions.
1.5
OVERVIEW OF ANALYTICAL SOLUTIONS
1) Greenwell’s method
Greenwell [37] and [Chapter-21] presented an engineering model for the structure and behavior of the vortex in its burst state. He used a model for the burst process that consists of four regions, viz. a straight vortex core, followed by an inner core deceleration region, a transition region downstream of the bursting point and finally a semi-infinite helical vortex. The breakdown process was modelled as a symmetry-breaking sub critical bifurcation from an axisymmetrical unburst vortex to a helically symmetric translating spiral burst form. Applying continuity and rotational velocity constraints to the motion of a semi-infinite helix resulted in a critical swirl ratio similar to that given by conventional stability analyses. In order to apply his model to experimental data obtained on delta wings, Greenwell treated the dynamics of the inner and outer core regions separately. This was based on the fact that most of the vorticity is contained in the outer core and critical swirl values are reached there first. It is the inner core, however, that conventional flow visualization techniques tend to mark. Model predictions agreed reasonable well with measured helix pitch, inclination, radius, induced and convection velocity, and frequency content. To predict the impact of vortex breakdown on the delta wing characteristics, a simple lift-loss model is developed. Predictions for the magnitude and the rate of onset of burst-induced lift loss agree with experimental data.
2) Huang’s method
Huang [38] and [Chapter-22] proposed a modified Non-linear Indicial Response theory based upon Tobak [39] in conjunction with Internal State-Space representation method (NIRISS). It was determined that the leading-edge vortex behavior has a dominant effect on the aerodynamics of delta wing and therefore the time-averaged vortex breakdown location was chosen as an internal variable to approximately describe the state of separated and vortex flow over the delta wing. The response of this internal variable to arbitrary motion was estimated by a modified non-linear indicial response functional. By means of a vortex filament method, this vortex breakdown location offers the additional information required at a given instantaneous attitude for calculating the outputs - surface pressure and air loads. The flight equations and trajectories of a 65° wing under a free-to-roll condition were then solved. The method was applied to estimate time-averaged vortex breakdown locations, normal force over delta wings with different sweep back angles, surface pressures and free-to-roll motion histories on a 65° delta wing. The comparisons between measured and estimated data showed that within the framework of the proposed mathematical model, it is possible to apply this NIRISS method to predict quantities in the non-linear flight regime. 3) Nangia’s method
Nangia [40] and [Chapter-23] discussed an empirical method which can be used to predict the forces and moments on delta-wing/body (and other) configurations in symmetric and asymmetric flights, including Mach and Reynolds number effects. His method used subsonic lifting surface theory, semi-empirical
INTRODUCTION AND HIGHLIGHTS
“attained” thrust and vortex effects This method was coupled with a model to predict vortex breakdown. Empirical criteria were developed for wings with low sweep. A trailing-edge separation model was included. The vortex breakdown model was based on a model by Lan & Hsu [41] that determined the onset of vortex breakdown from the local maximum in the unattained leading-edge suction distribution. The upstream movement of the burst point was also estimated. Predictions for the forces and moments of 53 o and 58o swept trapezium wings, with and without sideslip, for various Mach and Reynolds numbers were presented. The predictions showed a promising correlation with available experimental data.
1.6
CONCLUSIONS AND RECOMMENDATIONS
[Chapter 24]Plentiful and substantial results for experimental, computational and analytical cases have been obtained. After careful assessment, eight experimental cases, ten computational results and three analytical methods have been published indicating the great success obtained by this Task Group.
However, there is still an imminent demand for comprehensive experimental data set with both force-moment and flowfield measurements. Unsteady surface and flowfield data are needed along with the steady data to establish a complete dataset. It is imperative that the experimental configuration be closed to advanced military vehicles, clearly define and include model, sting and wind tunnel test section geometries. Computational results demonstrate the importance of the turbulence and treatment in modelling the leading-edge, especially the rounded leading-edge, vortices. The location of transition from laminar flow to turbulent flow and the location of the primary vortex separation have remarkable impact on the vortex breakdown and the character of the phenomena. Additionally, the geometries of the wind tunnel walls and sting have a measurable influence on the results.
1.7 ACKNOWLEDGMENTS
Funding for this work was provided by the Research and Technology Organization (RTO), the different nations and organizations. Their contributions make members of this group be able to work together and make these achievements and thus gratefully acknowledged.
The authors would like to thank all Task Group members and all contributors for their collaboration, dedication and tremendous effort, which achieve this excellent work.
The Chapters related to experimental cases and computational cases were reviewed by Dr. J. Luckring and by Dr. M. Visbal respectively. Their experience and knowledge in the field contributed very much to the publications.
1.8 REFERENCES
[1] Verhaagen, N.G. and VanRansbeeck, P., “ Experimental and Numerical Investigation of the Flow in the Core of a Leading-Edge Vortex”, AIAA 90-0384, January 1990.
[2] Nelson, R., “Unsteady Aerodynamics of Slender Wings,” Aircraft Dynamics at High Angles of
Attack: Experiments and Modeling, AGARD R776. March 1990.
[3] Gursul, I., “Review of Unsteady Vortex Flows over Delta Wings,” AIAA 2003-3942, June 2003. [4] Menke, M. and Gursul, I., “Unsteady Nature of Leading-Edge Vortices,” Physics of Fluids, Vol. 9,
No. 10, 1997, pp. 2960-2966.
INTRODUCTION AND HIGHLIGHTS
[5] Lowson, M.V., “Visualization Measurements of Vortex Flows,” AIAA-89-0191, January 1989 [6] Gad-el-Hak, M. and Blackwelder, R.F., “ The Discrete Vortices from a Delta Wing,” AIAA Journal,
Vol. 23, No. 6, 1985.
[7] Visbal, M. and Gordnier, R., “On the Structure of the Shear Layer emanating from a Swept Leading Edge at Angle of Attack,” AIAA 2003-4016, June 2003.
[8] Lambourne, N.C. and Bryer, D.W., “The bursting of Leading-Edge Vortices – Some Observations and Discussion of the Phenomenon. Aeronautical Research Council R. & M. 3282, April 1961. [9] Mitchell, A., “Experimental Data Base selected for RTO/AVT Numerical and Analytical Validation
and Verification: ONERA 70-deg Delta Wing,” AIAA 2003-3941, June 2003.
[10] Délery, J.M., “Aspects of Vortex Breakdown,” Progress in Aerospace Sciences, Vol. 3, 1994, pp. 1-59.
[11] Brown, G. L. and Lopez, J. M., “Axisymmetric Vortex Breakdown,” J. Fluid Mech. (1990) Vol. 221, pp. 553-576.
[12] Squire, H. B., “Analysis of the Vortex Breakdown Phenomenon,” Part 1. Imperial College of Science and Technology, Aeronautics Dept. Report No. 102, 1960.
[13] Hall, M.G., “Vortex Breakdown,” Annual Review of Fluid Mechanics, Vol. 4, 1972.
[14] Leibnovich, S., “The Structure of Vortex Breakdown,” Annual Review of Fluid Mechanics, Vol. 10, 1978.
[15] Leibnovich, S. and Ma, H. Y., “Soliton Propagation on Vortex Cores and the Hasimoto Solution,” Phys. Fluids 26(11), 3173-3179., 1983.
[16] Escudier, M., “Vortex Breakdown: Observations and Explanations,” Prog. In Aerospace Sci. Vol. 25 189-229, 1988.
[17] Leibovich, S., “Vortex Stability and Breakdown: Survey and Extension,” AIAA Journal, Vol. 22, No. 9, 1983.
[18] Delery, J., “Physics of Vortical Flows,” Journal of Aircraft, Vol. 29, No. 5, 1992, pp. 856-876. [19] Delery, J., “Aspect of Vortex Breakdown,” Prog. Aerospace Sci. Vol. 30, pp. 1-59, 1994.
[20] Nelson, R.C. and Pelletier, A., “The Unsteady Aerodynamics of Slender Wings and Aircraft undergoing Large Amplitude Maneuvers,” Progress in Aerospace Sciences, Vol. 39, 2003, pp. 185-248.
[21] Werlé, H., “Quelques Resultats Expérimentaux sur les Ailes en Flèche, aux faibles Vitesses, obtenues en Tunnel Hydrodynamique”, La Recherche Aéronautique, no. 41, Sept.-Oct. 1954, pp. 15– 21.
[22] Huang, X.Z. , Jobe C. and Hanff, E., “A Critical Assessment and Requirement for Ground testing on Vortex Breakdown Locations over Delta Wings,” Symposium on Advanced Flow Management Part A - Vortex Flows and High Angle of Attack for Military Vehicles, RTO-MP-069.
INTRODUCTION AND HIGHLIGHTS
[23] Chu, J. and Luckring, J., ”Experimental Surface Pressure Data obtained on 65o Delta Wing across Reynolds Number and Mach number Ranges,” NASA Technical Memorandum 4645, February 1996.
[24] Verhaagen, N.G. and Jobe, C.E., “Effects of Sideslip on the Characteristics of a 65-deg Delta Wing”, AIAA 2003-0736, January 2003.
[25] Huang, X. and Hanff, E., “Surface Flow Topology on a Delta Wing Rolling at High Incidence,” AIAA/NPU AFM Conf., June, 1996
[26] Huang, X.Z., "Comprehensive Experimental Research on Vortex Behavior over Military Wing Configurations," AIAA 2003-3940, June 2003.
[27] DeLuca, L., Guglieri, G., Cardone, G. and Carlomagno, G.M., “Experimental Analysis of Surface Flow on a Delta Wing by Infrared Thermography, AIAA Journal, Vol. 33, No. 8, 1995.
[28] Pirzadeh, S.Z., “A Solution-Adaptive Unstructured Grid Method by Grid Subdivision and Local Remeshing,” Journal of Aircraft, Vol. 37, No. 5, pp. 818-824, 2000.
[29] Visbal, M. and Gordnier, R., “On the Structure of the Sgear Layer Emanating from a Swept Leading Edge at High Angle of Attack,” AIAA 2003-4016, 2003.
[30] Görtz, S., “Time-Accurate Euler Simulations of a Full-Span Delta Wing at High Incidence,” AIAA 2003-4304, June 2003
[31] Görtz, S., “Detached-Eddy Simulations of a Full-Span Delta Wing at High Incidence,” AIAA 2003-4215, June 2003.
[32] Morton, S., “High Reynolds Number DES Simulations of Vortex Breakdown over a 70 Degree Delta
Wing,” AIAA 2003-4216, June 2003 [33] LeRoy, J. and Rodriguez, O., “RANS for ONERA 70-deg Delta Wing Steady Flows,” AIAA
2003-4219, June 2003
[34] Allan, M., Badcock, K., Barakos, G. and Richards, B., “A RANS Investigation of Wind Tunnel Interference Effects on Delta Wing Aerodynamics,” AIAA 2003-4214, June 2003
[35] Löser, T., “Dynamic Force and Pressure Measurements on an Oscillating Delta Wing at Low Speeds”, Report IB 129-96/9 DLR Braunschweig, 1997.
[36] Soewarmoto, B., “Numerical Investigation of Vortical Flows Using RANS Equations,” AIAA 2003-4215, June 2003
[37] Müller, J. and Hummel, D, “Numerical Analysis of the Unsteady Flow above a Slender Delta Wing at Large Angles of Attack,” ICAS Proceedings 2000, Paper ICA 0252, 2000.
[38] Benmeddour, A., Mebarki, Y., and Huang, X.Z., “ Euler/RANS Simulations of Steady Flow over the IAR 65 degree Delta Wing,” IAR CPR-AL-2004-0007, 2004.
[39] Greenwell, D., “A simple Engineering Model for Vortex Breakdown,” AIAA 2003-3943, June 2003. [40] Huang, X.Z., “Non Linear Indicial Response and Internal State-Space Representation,” AIAA
2003-INTRODUCTION AND HIGHLIGHTS
3944, June 2003.
[41] Tobak, M., Chapman, G.T. and Unal, A., “Modeling Aerodynamic Discontinuities and the Onset of Chaos in Flight Dynamical Systems,” NASA TM 89420, Dec. 1986..
[42] Nangia, R., “Applying Vortex Breakdown Empiricisms to Predict Wing Aerodynamic Characteristics in Symmetric and Asymmetric Situations,” AIAA 2003-3945, June 2003.
[43] Lan, C.E. and Hsu, C.H., “Effects of Vortex breakdown on Longitudinal and lateral Aerodynamics of Slender Wings by the Suction Analogy”, AIAA 82-1385, 1982.
INTRODUCTION AND HIGHLIGHTS
Fig. 4 Leading-edge vortex breakdown [6]
FIGURES
Fig. 4bSprial of breakdown structure
Fig. 4a Image of leading-edge vortex breakdown
Fig. 3 Evolution of transition process in shear layer [5]
Fig. 1 Vortical crossflow structure [1] Fig. 2 Illumination of shear layer instability [2]
INTRODUCTION AND HIGHLIGHTS
xVB 45 40 35 30 25 20 15 0.0 0.2 0.4 0.6 0.8 1.0 Wentz Thompson Pelletier (D) Pelletier (S) Lambourne Earnshaw Huang (wind) Huang(water) Erickson Panton α Werlé
Fig. 9 Model sting/support assembly in ONERA F2 tunnel
Fig. 8 ONERA 70º delta wing
Fig. 7 Measured vortex breakdown on 65º delta wings at different facilities [20]
Fig. 6 Vortex breakdown/tail-fin interaction of F-18 HARV at α
αα
α=25º (NASA Photo)
Fig. 5 Evolution of transition process in shear layer [5] INTRODUCTION AND HIGHLIGHTS
Upper wing half Upper centerbody Upper fairing Iso-surface of vorticity magnitude colored by Y-vorticity
Fig. 15 AMR-grid instantaneous solution [31] Fig. 14 AMR-grid instantaneous solution [31]
Fig. 13 Computed spiral and bubble breakdown [29] Fig. 12 Test rigs installed in TsAGI wind tunnel
Fig. 11 IAR interchangeable 65º delta wing Fig. 10 NASA LaRC 65º delta wing
INTRODUCTION AND HIGHLIGHTS
INTRODUCTION AND HIGHLIGHTS
![Fig. 1 Vortical crossflow structure [1] Fig. 2 Illumination of shear layer instability [2]](https://thumb-eu.123doks.com/thumbv2/123doknet/14154069.472212/18.918.255.667.475.740/fig-vortical-crossflow-structure-illumination-shear-layer-instability.webp)
![Fig. 15 AMR-grid instantaneous solution [31]](https://thumb-eu.123doks.com/thumbv2/123doknet/14154069.472212/20.918.189.773.147.351/fig-amr-grid-instantaneous-solution.webp)
