OATAO is an open access repository that collects the work of Toulouse
researchers and makes it freely available over the web where possible
Any correspondence concerning this service should be sent
to the repository administrator:
tech-oatao@listes-diff.inp-toulouse.fr
This is an author’s version published in:
http://oatao.univ-toulouse.fr/20492
To cite this version:
Rousseau, Raphaël
and Santaella, Catherine and Bonnafous,
Anaïs and Achouak, Wafa and Godon, Jean-Jacques and
Delia-Dupuy, Marie-Line
and Bergel, Alain
Halotolerant bioanodes:
The applied potential modulates the electrochemical characteristics,
the biofilm structure and the ratio of the two dominant genera.
(2016) Bioelectrochemistry, 112. 24-32. ISSN 1567-5394
Halotolerant bioanodes: The applied potential modulates the
electrochemical characteristics, the biofilm structure and the ratio of the
two dominant genera
Raphaël Rousseau
a, Catherine Santaella
b, Anaïs Bonnafous
c, Wafa Achouak
b, Jean-Jacques Godon
c,
Marie-Line Delia
a, Alain Bergel
a,⁎
aLaboratoire de Génie Chimique, CNRS-Université de Toulouse (INPT), 4 allée Emile Monso, BP 84234, 31432 Toulouse, France
bLaboratoire d'Ecologie Microbienne de la Rhizosphere & Environnement Extrêmes (LEMiRE), UMR 7265, CNRS-CEA-Aix-Marseille, Université, CEA Cadarache DSV/IBEB/SBVME, 13108 Saint Paul
lez Durance, France
cINRA UR 0050, Laboratoire de Biotechnologie de l'Environnement, Avenue des Etangs, F-11100 Narbonne, France
a b s t r a c t
a r t i c l e
i n f o
The development of economically-efficient microbial electrochemical technologies remains hindered by the low ionic conductivity of the culture media used as the electrolyte. To overcome this drawback, halotolerant bioanodes were designed with salt marsh sediment used as the inoculum in electrolytes containing NaCl at 30 or 45 g/L (ionic conductivity 7.0 or 10.4 S·m−1). The bioanodes were formed at four different potentials −0.4,
− 0.2, 0.0 and 0.2 V/SCE to identify the effect on the electrochemical kinetic parameters, the biofilm structures and the composition of the microbial communities. The bioanodes formed at −0.4 V/SCE were largely dominated by Marinobacter spp. Voltammetry showed that they provided higher currents than the other bioanodes in the range of low potentials, but the maximum currents were limited by the poor surface colonization. The bioanodes formed at −0.2, 0.0 and 0.2 V/SCE showed similar ratios of Marinobacter and Desulfuromonas spp. and higher values of the maximum current density. The combined analysis of kinetic parameters, biofilm structure and bio-film composition showed that Marinobacter spp., which ensured a higher electron transfer rate, were promising species for the design of halotolerant bioanodes. The challenge is now to overcome its limited surface coloniza-tion in the absence of Desulfuromonas spp.
Keywords: Microbial anode Microbial community
Microbial electrochemical technology Microbial fuel cell
Bioelectrochemical system
1. Introduction
In the past decade, the association of microbial catalysis with elec-trochemistry has given rise to a huge number of innovative processes, which may impact a large variety of application domains such as energy production, wastewater treatment, synthesis of biocommodities, bio-sensing, metal recovery, etc.[1,2]. Microbial anodes are at the core of most of these microbial electrochemical technologies (METs) and very many studies have been dedicated to their design[3]. It is now possible to obtain efficient microbial anodes on carbon[4,5], which reach the current limiting plateau at potential so low as 0.0 V/SHE, and on stain-less steel electrodes[6,7]and other metallic materials[8]. Multilayer structures have been shown to produce up to 390 A/m2at 0.39 V/SHE
[9]for the oxidation of acetate.
Unfortunately, nothing is perfect. The microbial anodes that have pro-duced the highest currents so far do not tolerate high salinities and operate only in solutions of low ionic conductivity, generally b2 S·m−1. For
comparison, conventional, abiotic, commercial processes, e.g. hydrogen production by water electrolysis, commonly implement electrolytes of conductivity around 20 S·m−1and up to 60 S·m−1(KOH 33% by mass).
A reactor with an inter-electrode distance of 2 cm working with a current density of 200 A·m−2must overcome an ohmic drop of only 67 mV when
operating with an electrolyte of 60 S·m−1conductivity, while the ohmic
drop would reach the considerable value of 2000 mV with an electrolyte of 2 S·m−1as required to implement microbial anodes. The energy loss
due to ohmic drop through the electrolyte can be multiplied by a factor of 30 when a microbial anode is substituted for a conventional abiotic anode. It should be mentioned that this numerical illustration is realistic with regard to the state of the art: a current density of 200 A/m2has
been reached recently by the most efficient microbial anodes[9], and the commercial, abiotic water electrolysis units easily ensure higher values.
In summary, microbial anodes are starting to become efficient for the oxidation of low-cost organic substrate but they require electrolytes of low ionic conductivity, which precludes operation at high current density. The implementation of microbial anodes in economically effi-cient industrial reactors is still hindered by the high ohmic drop through the electrolyte. An essential prerequisite for the large-scale
⁎ Corresponding author.
E-mail address:alain.bergel@ensiacet.fr(A. Bergel).
development of METs is consequently to decrease the energy loss due to ohmic drop by designing microbial anodes able to operate in high-salin-ity electrolytes.
Our previous work has presented the design of efficient microbial anodes that operate in highly saline electrolytes, using salt marsh sedi-ment as the inoculum. Up to 85 A·m− 2have thus been produced at
0.1 V/SCE applied potential, in solutions containing 45 g·L−1NaCl (1.5
times seawater salinity), resulting in an ionic conductivity of 10.4 S·m−1[10]. Surprisingly, all these bioanodes have always revealed
the large dominance of only Marinobacter and Desulforomonas spp. All the experiments previously reported on these halotolerant microbi-al anodes were performed with a polarization potentimicrobi-al of 0.1 V/SCE[11]. The purpose of the present work was to determine the impact of the polar-ization potential on the performance and the structure of bioanodes. Bioanodes were formed under well-controlled electrochemical conditions at four different applied potentials ranging from −0.4 to 0.2 V/SCE.
The bioanode kinetics were determined by numerical analysis of the voltammetric records. The architecture of the biofilms was imaged by confocal laser scanning microscopy and the composition of the microbi-al communities was compared by CE-SSCP fingerprinting and deter-mined by 16S rRNA gene pyrosequencing. It was thus possible to investigate the impact of the applied potential on the electrochemical characteristics of the bioanodes and to link it with the structure of the biofilm and with the ratio of the two dominant microbial genera Marinobacter and Desulfuromonas. The study illustrates the suitability to combine together these three different investigation paths (electro-chemistry, biofilm structure and microbial composition) to progress in understanding microbial bioanode mechanisms.
The study may also open up a new research path in the field of mi-crobial corrosion by adding Marinobacter spp. to the possible mimi-crobial genera involved in biocorrosion mechanisms, as was recently the case for Geobacter[12]. Recently, both Marinobacter and Desulfuromonas spp. have been identified in marine biofilms that induced corrosion of copper alloys[13].
2. Material and methods 2.1. Inoculum and growth medium
Sediments collected from a salt marsh (Mediterranean Sea, Gruissan, France) were used as inoculum. Conductivity from 7.6 to 12.3 S·m− 1
and pH from 6.5 to 7.4 were measured in situ. A volume of 200 mL of sediments was mixed with 1800 mL of a culture medium based on the Starkey medium (NH4Cl 2 g·L− 1, K2HPO4 0.5 g·L− 1, NaCH3COO
40 mM, HCl 37% 46 mL, MgCl2⋅ 6H2O 55 mg·L− 1, FeSO4(NH4)2SO4⋅ 6-H2O 7 mg·L− 1, ZnCl2⋅ 2H2O 1 mg·L− 1, MnCl2⋅ 4H2O 1.2 mg·L− 1,
CuSO4⋅ 5H2O 0.4 mg·L− 1, CoSO4⋅ 7H2O 1.3 mg·L− 1, BO3H3
0.1 mg·L− 1, Mo
7O2(NH4)6⋅ 4H2O 1 mg·L−1, NiCl2⋅ 6H2O 0.05 mg·L−1,
Na2SeO3⋅ 5H2O 0.01 mg·L−1, CaCl2⋅2H2O 60 mg·L− 1) with addition of
NaCl 30 or 45 g·L−1. The conductivity of the final solution was 7.0 and
10.4 S·m−1with NaCl 30 and 45 g/L, respectively, and its pH was 7.5.
2.2. Electrode and electrochemical procedure
In each experiment, four working electrodes made of 2 cm × 1 cm graphite felt (Mersen, France) were disposed in a circle around a single counter-electrode, which was a 10 cm ∗ 5 cm plate of stainless steel 254 SMO (Outokumpu, Sweden). The working electrodes and counter elec-trode were electrically connected with a screwed titanium wire (1 mm di-ameter, Alfa Aesar). A saturated calomel reference electrode (+0.24 V/ SHE, Radiometer) was set between the counter and working electrodes. The solution was initially flushed with nitrogen for 20 min. The reactors were in a thermostatic bath maintained at 30 °C. A multichannel potentiostat (Biologic) equipped with an Nstat device allowed each work-ing electrode to be addressed individually. Each electrode was thus polar-ized at a different potential: - 0.4, −0.2, 0 and 0.2 V/SCE, while being in
the same reactor. The acetate concentration was regularly measured with an enzymatic kit (K-ACETAK, Megazyme). When the concentration fell below 5 to 10 mM, concentrated sodium acetate (4 M) was added to recover the initial 40 mM concentration. After several days of polariza-tion, the potential was relaxed and the microbial anode was left at open circuit until it reached a stable potential. Cyclic voltammetry (1 mV·s−1) was then performed on each anode in the range −0.6 to
0.5 V/SCE. Three successive cycles were performed to check reproducibil-ity. Only the forward scans of the second cycles are presented here. 2.3. Microscopy
A section (0.5 × 0.5 cm2about 1 mm thick) was sliced from the
sur-face of the electrodes. The samples were labelled with SYTO® 9 Green Fluorescent Nucleic Acid Stain (Invitrogen), rinsed with sterile water to remove planktonic cells and were mounted between a slide and a CoverWell incubation chamber™ (Invitrogen, 1 or 2 mm thickness).
A FluoView Olympus CLSM microscope equipped with krypton-argon laser (488 nm, 568 nm and 647 nm lines) and objectives LCPPlan 10/XX and LCPlanFL 40/0.60 (working distance 2.3 mm) was used for microscopic observations. Emissions were observed with a 510– 560 nm filter on the green channel and 585–640 nm on the red channel. Image stacks were collected every 1 μm. Z-stacks (projection of these images on a plane) were generated using the FluoView software. Three to five random fields were examined using both ×10 and ×40 ob-jectives. Epifluorescence was recorded on an Olympus BX41 equipped with a CytoViVa Dual mode epifluorescence module, with a 150 W hal-ogen light source, and a D350/50× Single Band DAPI Exciter - 25 mm and a S492/18× Single Band FITC Exciter - 25 mm for fluorescence, to-gether with a pre-aligned Koehler illumination device and a visible near infra-red spectrophotometer for diffusion light mode. GraphicConverter X and BioImageL [14] were used for image processing.
2.4. DNA extraction, single strand conformation polymorphism (SSCP) fin-gerprinting and DNA pyrosequencing
A piece of each electrode (around half of the surface area) was stored at −80 °C in a 2 mL tube (Eppendorf). Genomic DNA was extracted and purified using the protocol described previously[15]. The total DNA ex-tracted was purified using a QiAmp DNA microkit (Qiagen, Hilden, Ger-many). DNA amount and purity of extracts were confirmed by spectrophotometry (Infinite NanoQuant M200, Tecan, Austria). The bacterial communities were analysed by the PCR–single strand confor-mation polymorphism (SSCP) fingerprint technique. For SSCP, the high-ly variable V3 regions of 16S rRNA gene were amplified by PCR from each bioanode DNA sample.
1 μL of genomic DNA sample was amplified by using the primers w49 (5′-ACGGTCCAGACTCCTACGGG-3′, Escherichia coli position F330) and 5′-6FAM labelled w104 (5′-TTACCGCGGCTGCTGCTGGCAC-3′, E. coli position R533)[16]in accordance with previously described CE-SSCP amplification methods[17]. CE-SSCP electrophoresis was per-formed with ABI310 (Applied Biosystems)[17]. CE-SSCP profiles were analysed using GeneScan software (Applied Biosystems) and the ‘StatFingerprints' package[18]. Pyrosequencing of the DNA samples using a 454 protocol was performed by the Research and Testing Labo-ratory (Lubbock, USA).
3. Results and discussion 3.1. Electrochemical analysis
3.1.1. Microbial anode formation under constant potential chronoamperometry (CA)
Each electrochemical reactor was equipped with four individually addressed working electrodes, each polarized at a different potential:
− 0.40, − 0.20, 0.00 and 0.20 V/SCE. These potential values were higher than that of acetate oxidation and low enough to avoid any water oxida-tion. In the absence of inoculum, none of these potentials resulted in current production. The experiment was reproduced five times in the same conditions. The five experimental runs showed similar current-time evolution to that plotted inFig. 1A. The initial lag period varied rather largely, from 1 to 4 days, from one experimental run to another. In order to diminish the impact of this experimental deviation, the cur-rent densities were measured on each curve 6 days after the curcur-rent onset. The current densities reported inFig. 1B at the potentials of − 0.4, − 0.2, 0.0 and 0.2 V/SCE are the averages of the 5 experimental runs described in the present study. The value for the potential of 0.1 V/SCE was extracted from previously reported experiments, per-formed with 9 reactors run in identical conditions[11].
Among the 20 bioanodes achieved in the present study and the 9 previous measurements, 19 were formed in electrolytes containing 30 g/L NaCl and 10 with 45 g/L NaCl, without any difference due to sa-linity. The previous study[11]showed that NaCl concentrations ranging from 30 to 45 g/L led to the formation of similar bioanodes in terms of electrochemical kinetics, biofilm structure and biofilm microbial com-position. It was confirmed here that variation of NaCl concentration in the range 30 to 45 g/L did not affect the bioanode behaviour.
Standard deviations on current densities were significant (Fig. 1B). Actually, from one experimental run to another, the current-time curves exhibited the same general trend but the absolute current values were not well reproducible. A similar lack of accurate reproducibility has al-ready been observed when inocula coming from natural environments are used at high inoculation ratio[10,19]. In particular, the large set of experiments used different inoculum samples extracted at different times of the year and an unusual procedure was employed here, which consisted of avoiding substrate depletion. Acetate was added to return to the initial concentration of 40 mM when its concentration de-creased to around 5 mM. This procedure succeeded in producing high currents but it introduced some operating differences from one experi-mental run to another. The current evolutions obtained were conse-quently less reproducible than the current peaks commonly reported in the literature with successive batches of fresh solution.
Despite the experimental deviation,Fig. 1B shows a clear depen-dence of the current density on the polarization potential. An exponen-tial variation of the current density with the potenexponen-tial might be expected, according to the Tafel law. Nevertheless, fitting the experi-mental data by a Tafel law led to parameter values that did not make sense physically (Supplementary data). It can be concluded that the cur-rent density provided by the microbial anodes depended on the polari-zation potential in a complex way that was not straightforwardly controlled by elementary electrochemical kinetics.
3.1.2. Voltammetry
At the end of the chronoamperometry, the anode potential was re-laxed. It took about 10 min for the anodes reach a stable open circuit po-tential (OCP) of −0.50 ± 0.01 V/SCE for all anodes whatever the experimental run. This OCP value was close to the formal potential of the HCO3−/CH3COO−of −0.56 V/SCE at pH 7.5 (see Supplementary
data). The fact that OCP always came back to the same value suggested that identical redox components were present at the electrode/biofilm interface whatever the applied potential used to form the bioanodes.
When OCP was stable, voltammetries were recorded at 1 mV·s− 1
(Fig. 2). In the zone of low potential of the voltammetry curves, i.e. at potential values below 0.0 V/SCE, the current supplied by the bioanodes formed at −0.4 V/SCE was slightly or significantly higher than the cur-rent produced by the bioanodes of the same run formed at 0.0 or 0.2 V/ SCE. Over the five experimental runs carried out in this work, this con-clusion was verified 4 times (see Table 1 in Supplementary data). A sim-ilar observation has already been reported in the literature, leading to the conclusion that a low potential applied during the bioanode forma-tion selects the most efficient electroactive bacteria[20].
In contrast, the high range of potentials showed various situations. The bioanodes formed at −0.4 V/SCE could keep their supremacy or could be surpassed by the bioanodes formed under high potential. This latter case has also already been reported in the literature for mi-crobial anodes formed from pure culture[21]or environmental inocu-lum[22]. Actually, the pretty complex situation observed here is an illustration of the various observations reported in the literature (see
[4]for a review) claiming that the performance of bioanodes can be af-fected[20,23]or unaffected[24,25]by the potential used to form them. The voltammetry curves were fitted with the Butler-Volmer-Monod equation, which expresses the current density j as a function of the overpotential η[26]: j ¼ jMax 1− exp −n: FR:T η ! " K1exp −ð1−αRÞ:n: F :T η ! " þ K2exp −n: FR :T η ! " þ KM S þ 1 ! " ð1Þ
where jMax(A·m− 2) is the maximum current density, n = 8 is the
number of electrons produced per mole of acetate, α is the charge trans-fer coefficient, F = 96,485 C·mol− 1is the Faraday constant, R =
8.314 J mol−1K−1is the universal gas constant, T = 303 K is the
tem-perature, KM (mol·L− 1) is the substrate affinity constant, S =
0.04 mol·L−1is the substrate concentration, α is the charge transfer
co-efficient, and K1and K2are dimensionless parameters.
Five parameters must be numerically adjusted: jMax, KM, α, K1and
K2. Preliminary numerical tests showed that the KMvalue did not have
Fig. 1. Chronoamperometries at different polarization potentials. A) Evolution of the current density with time (experimental run #5, performed with 45 g/L NaCl). B) Current densities (Jmax) recorded 6 days after current onset as a function of the polarization potential (E). Values at −0.4, −0.2, 0.0, and 0.2 V/SCE (circles) were averaged from the 5 experimental runs
a significant impact in the range from 5 to 8 mM. Experimentally, a fall in current was observed when acetate concentration was less than ap-proximately 10 mM. KMvalues of 2.2 mM related to acetate have been
reported in the literature[26]. In order to decrease the number of pa-rameters to be adjusted numerically and considering the low impact of KM, its value was fixed at 5 mM in the further calculations. All the
voltammetry curves were thus fitted by adjusting four parameters through least squares regression. The average values obtained on the five experimental runs reported here are gathered together inTable 1.
As observed and commented above for the current densities, stan-dard deviations were also quite high on the adjusted parameters. This is the price to be paid for working with several experimental runs per-formed at different times and using high ratios of an environmental in-oculum. Here, parameter adjustment was based on 20 different curves obtained in 5 independent experimental runs using different samples of the inoculum. In spite of the experimental deviation some clear trends can be extracted.
Firstly, the jMaxparameter was significantly lower for the bioanodes
formed at −0.4 V/SCE, while it was almost identical for all the others. The charge transfer coefficient, α, was between 0.8 and 0.9, without any effect of the polarization potential. The same value was found in the previous study carried out at the constant potential of +0.1 V/SCE[11]. So high α values are unusual for conventional electrochemical reactions, but have already been reported in protein electrochemistry[27]. They pointed out a detrimental dissymmetric energy barrier, which has to
be overcome to transfer the electrons to the electrode. Varying the ap-plied potential did not mitigate this disadvantage.
The K1parameter describes how fast the biochemical reactions run
relative to the electrochemical reaction[26]. If the electrochemical reac-tion is extremely fast compared to the biochemical one, K1tends to zero
and the Butler-Volmer-Monod equation approaches the Nernst-Monod equation. K1was considerably lower for −0.4 V/SCE (K1= 12.4), while
it had comparable values at the other potentials, ranging from 20.9 to 27.2. In all the cases, the high values of K1indicated that the electron
transfer was far from being reversible (Nernstian). Electron transfer to the anode material, rather than the metabolic reactions, was rate-limit-ing. This trend was enhanced for potential values higher than −0.4 V/ SCE, this means that the potential values higher than −0.4 V/SCE either led to less efficient electron transfer or improved the metabolic processes.
The K2is expected to be N1[26]. This condition was largely validated
here. The large variation of K2with the applied potential, particularly
from −0.4 to 0.0 V/SCE, suggested that the potential used to form the bioanodes impacted the metabolic process. The considerable experi-mental variation on this parameter should indicate that the metabolic processes were poorly controlled from one reactor to another.
3.2. Architecture of biofilms
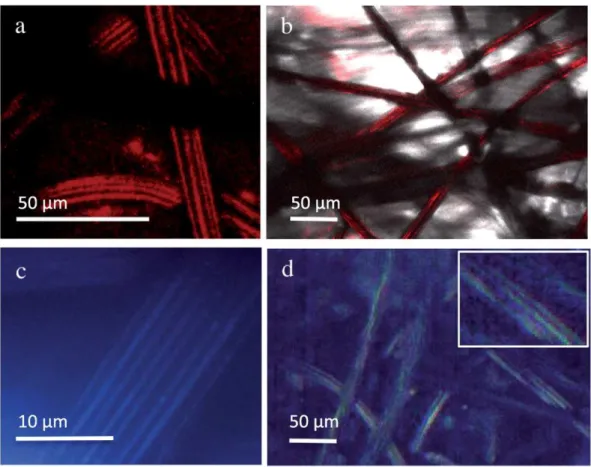
Under confocal laser scanning microscopy (CLSM) excitation at 645 nm and photon recovery between 585 and 640 nm yielded visible photoluminescence from the fibres (Fig. 3a). To validate the images ob-tained in this manner, thin electrode samples were cut that allowed light to pass through. These thin slides imaged in transmission mode (Fig. 3b) confirmed the outlines and shape of the fibre obtained in photoluminescence. The dual mode fluorescence was used, which al-lows fluorescence and light diffraction to be superimposed.Fig. 3c shows images of graphite felt in dual mode under ultraviolet-blue/ green excitation and white light. Graphite felt fibres showed facets re-sembling those observed inFig. 3a. Used alone, reflected light microsco-py allowed graphite felt to be imaged by hyperspectral microscomicrosco-py with details of the facets on the fibres (Fig. 3d). Therefore, diffused light accounted for the signal obtained in CLSM. To our knowledge, this is
Fig. 2. Representative set of voltammetric curves recorded with the bioanodes formed at (A) −0.4 V, (B) −0.2 V, (C) 0.0 V and (D) 0.2 V/SCE over 20 days (run #2). The X-axis was plotted in terms of overpotential (η) calculated as the potential E minus open circuit potential. Black lines: experimental, grey lines: Butler-Volmer-Monod model.
Table 1
Butler-Volmer-Monod parameters as a function of the polarization potential. Voltamme-try curves were recorded at the end of the polarization time and values were averaged from the 5 experimental runs described here. KMwas fixed at 5 mM.
Applied potential during CA (V/SCE) − 0.4 − 0.2 0 0.2 jMax 17.5 ± 9.4 37.6 ± 21.1 35.4 ± 16.7 33.8 ± 17.3 α 0.8 ± 0.10 0.8 ± 0.05 0.9 ± 0.05 0.8 ± 0.05 K1 12.4 ± 3.0 20.9 ± 3.8 27.2 ± 20.5 25.4 ± 17.0 K2 41.0 ± 18.5 104.2 ± 77.4 196.0 ± 199.2 225.4 ± 222.2
jMax(A.m−2) is the maximum current density, α is the charge transfer coefficient, K1and K2
the first report of graphite felt imaging in optical microscopy, regardless of transmission or lack of signal in fluorescence.
Fig. 4gives representative images of the bioanodes developed at − 0.4, − 0.2, 0.0 and 0.2 V/SCE, which provided current densities of 8, 18, 31, and 39 A/m2, respectively. The procedure developed here gave
the opportunity to image the graphite felt fibres and the biofilm matrix at the same time, which led to unequivocal interpretation of the biofilm structure and development. At the lowest potential (−0.4 V/SCE), the biofilm showed rare, discontinuous, patchy structures near the surface of the fibres (Fig. 4a). The potential of −0.2 V/ECS yielded continuous, thin, dense biofilm layers on the fibres, with thickness near 10 μm (Fig. 4b). Biofilms formed at 0.0 V/SCE showed a diffuse, thick matrix, near 20 μm in thickness, that sheathed the fibres (Fig. 4c). At 0.2 V/ SCE, the biofilm displayed a diffuse, fluffy matrix of 30–35 μm thickness that was non-continuous around the fibres and also developed in the spaces between them (Fig. 4d).
In summary, the biofilm architecture was clearly different for the bioanodes formed at −0.4 V/SCE and then it varied according to the ap-plied potential, with a denser volume at higher potentials.
3.3. Microbial populations
CE-SSCP profiles of the electrode samples were recorded for each four bioanodes in the five experimental runs. Representative CE-SSCP profiles are shown inFig. 5A. Only two main groups of peaks were pres-ent on all profiles, indicating that the microbial community of all bioanodes was dominated by the same two major phylotypes.
16S-rRNA gene pyrosequencing of the four bioanodes of an experi-mental run confirmed the low diversity and indicated that the two peaks detected in CE-SSCP belonged to Desulfuromonas and
Marinobacter phylotypes, which represented at least 94% of the biofilm communities for the four bioanodes (Fig. 5B). The other part of the com-munity was made up of various phylotypes, the percentage of each being always b1%. Pyrosequencing replicated for the four bioanodes of another experimental run confirmed these results (Fig. 2 in Supplemen-tary data). The previous work, which was carried out with the single ap-plied potential of 0.1 V/SCE, has also demonstrated the same strong and reproducible selection of these two phylotypes from the extremely large microbial diversity contained in the salt marsh inoculum[11].
For the lowest potential (−0.4 V/SCE) a very low proportion of Desulfuromonas was detected, only 5%, while the Marinobacter spp. repre-sented 87% of the population (the percentages were 0.3 and 93.5%, respec-tively for the duplicate in Supplementary data). At the highest potentials, the proportion of Desulfuromonas spp. ranged from 39 to 45%. For the highest anode potential (0.2 V/SCE), the Marinobacter spp. was dominant, as already observed for bioanodes formed at 0.1 V/SCE[11].
The low abundance of Desulfuromonas spp. at the lowest polarization potential indicated that these species had some difficulty in growing when only a limited potential gradient was available between the anode potential and the redox potential of the substrate used as the electron donor. At the other polarization potentials, Desulfuromonas spp. competed in a more balanced way against Marinobacter spp., even though the Marinobacter spp. was generally slightly dominant (5 bioanodes out of 6).
Desulfuromonas species have already been identified as electroactive species, since the pioneering studies[28]and in bioanodes formed from various types of environmental inoculum such as marine sediments[29]
or paper mill effluents[30].
Plotting the jMax values, extracted from Butler-Volmer-Monod
modelling, against the percentage of Desulfuromonas spp. evidenced a
Fig. 3. Imaging of clean graphite felt. a) Excitation 647 nm, emission 585–640 nm, projection of Z-sections through 31 μm. The fibres show straight lines featuring facets; b) Excitation 488 and 647 nm, transmission and emission 585–640 nm on the red channel, projection of Z-sections through 30 μm. The red signal superimposed with graphite felt fibres, as seen in transmission; c) Dual mode epifluorescence, excitation 350 ± 50 nm and white light, graphite felt fibres show facets as in 3a; 3d) Hyperspectral CytoViva® microscopy. The insert top right shows a zoom on a fibre. Graphite felt fibres look similar to those in image a.
correlation between the electrochemical properties and the percentage of Desulfuromonas spp. (Fig. 6). The theoretical maximal current jMax
in-creased with the Desulfuromonas percentage and then stabilized when Desulfuromonas made up more than about 20–30% of the microbial community. Their role in electroactivity can consequently be assumed. 3.4. Comparison with data reported for other microbial anodes
Electroanalytical studies devoted to the impact of the polarization potential on the formation of multispecies bioanodes and performed in well-controlled electrochemical conditions are not very numerous, and the reported results do not reveal clear trends. Review articles have commented on this context recently[4,31].
From the point of view of the current density produced, some bioanodes have shown increasing performance when the applied po-tential value was increased[19,22], while others have revealed an opti-mal value, with lower performance above and below this value[32–34]. Potential-independent performance has been observed[24]and exactly opposite behaviour has also been experienced, i.e. higher current densi-ty at the lowest formation potential value[20]. Actually, the different potential ranges and inocula that have been used in the various studies may well be a source of large variation in the results reported.
Attempts to assess the impact of the applied potential on the selec-tion of microbial families, genera or species have not shown clearer trends. Bioanodes formed from activated sludge have revealed the pre-dominance of Geobacter sp. at −0.39 V/SCE, while a large microbial di-versity was observed at higher formation potential values [20].
Similarly, the lowest applied potential has led to the selection of a single dominant species (Desulfuromonas acetexigens) in bioanodes formed from raw paper mill effluents[30].
In contrast, other studies have reported that the microbial communi-ties do not depend on the potential applied to develop them. Microbial anodes formed at −0.4, −0.2 and 0.1 V/SCE from garden compost pro-vided identical performance and DGGE has evidenced the same three dominant groups: Geobacter, Anaerophaga and Pelobacter, whatever the applied potential[24]. Nevertheless, the redox systems contained in the biofilms showed some differences depending on the potential. Microbial anodes formed from wastewater have also shown similar bio-film communities dominated by bacteria most similar to Geobacter sulfurreducens, whatever was the applied potential[25]. (See also the discussion about this work:[35], and[36]).
A study that used a mixture of soil and activated sludge as inoculum designed Geobacter-dominated bioanodes, showing that selection by potential acted at the species level. A strain of G. psychrophilus was dom-inant at −0.25 V vs. Ag/AgCl but was genetically different from the strains that dominated the −0.42 and −0.36 V bioanodes[23]. This ar-ticle also reported that just changing a few operating parameters (batch vs. continuous, temperature, buffer concentration, nitrogen feeding or not) could lead to different bioanodes, no longer Geobacter-dominated. This article pointed out the difficulty of drawing general conclusions on this issue.
The only rule that seems to be widely evoked is that high potential values may support the growth of numerous, even moderately efficient, electroactive species while lower potential may favour the selection of
Fig. 4. CLSM images of biofilms stained with SYTO®9. Excitation 488 and 647 nm, emission 560–590 nm (green channel) and 585–640 nm (red channel). Z sections were acquired with 1 μm step. Bioanodes developed on graphite felt anodes polarized at different potentials/SCE (experimental run #5): a) V = −0.4 V, J = 8 A/m2, Projection of Z-sections 8 μm; b)
the most efficient electroactive species that are able to exploit the small difference between the anode potential (electron acceptor) and the redox potential of the substrate (electron donor).
Here, the experimental conditions are markedly different from the previous studies because of the very high salinity of the medium. Halotolerant bioanodes formed from salt marsh have shown stringent and reproducible selection of only two genera, Marinobacter and Desulfuromonas[11], which is original behaviour, not reported so far with other kinds of multispecies bioanodes. The present study showed that the applied potential impacted the microbial community mainly at the lowest value (−0.4 V/SCE), selecting Marinobacter spp. as very dominant species but with a weaker colonization of the electrode sur-face. According to the literature analysis above, it may be guessed that the Marinobacter genus contains the most efficient electroactive species, which are able to implement anode respiration at low applied potential. This deduction is confirmed by the analysis of the experimental data presented below.
3.5. Electrochemical kinetics, biofilm structure and microbial composition support a speculative scenario of bioanode formation
During the voltammetry, the bioanodes formed at −0.4 V/SCE pro-duced the highest currents in the range of low potential (below about 0.0 V/SCE). They could consequently be considered as more efficient than the other bioanodes in the low potential range. Biofilm imaging showed a considerably weaker colonization in comparison to the
Fig. 5. Analysis of the microbial communities of four bioanodes formed at different applied potentials (run #5). A. Superimposed CE-SSCP profiles of the four bioanodes, dark blue −0.4 V, pink −0.2 V, yellow 0.0 V, and cyan 0.2 V/SCE. The fluorescence intensity (in arbitrary unit) is given as a function of the retention time (in number of scans); the numerical values depend on the equipment and can be used only to compare different samples in exactly the same operating conditions. B. 16S rRNA gene pyrosequencing of the bioanodes formed at a. −0.4 V; b. −0.2 V; c. 0.0 V; d. 0.2 V/SCE.
Fig. 6. Maximal current density extracted from the Butler-Volmer-Monod model as a function of the percentage of Desulfuromonas spp. determined by 16S rRNA gene pyrosequencing. Squares: run #4 from this work, diamonds: run #5 from this work, triangles: data extracted from Rousseau et al.[11]), these data did not use JMax, which
was not available, but the current provided by the bioanodes just before they were collected.
bioanodes formed under the highest potentials. The bioanodes formed at −0.4 V/SCE displayed higher currents while remaining considerably less colonized. It must be concluded that very efficient electroactive spe-cies were present in the rare colonized patches. The low value of K1
ex-tracted from the Butler-Volmer-Monod kinetics for these bioanodes confirmed a faster electron transfer process. Analysis of the microbial community showed that Marinobacter spp., largely dominant (87 and 93.5%), were responsible for the higher electron transfer performance.
The JMaxparameter values extracted from Butler-Volmer-Monod
ki-netics showed a unitary trend, with a lower value for the bioanodes formed at −0.4 V/SCE. The bioanodes formed at −0.4 V/SCE showed better electron transfer but they led to lower average JMax. Analysis of
the microbial communities indicated that the value of Jmaxwas
correlat-ed with the proportion of Desulfuromonas spp. An increascorrelat-ed JMax
corresponded to a higher percentage of Desulfuromonas spp., up to a sat-uration threshold in the range of 20–30%, above which the Desulfuromonas spp. increase no longer impacted the JMaxvalue. Biofilm
imaging showed an enhanced colonization of the surface of the bioanodes formed under high potentials.
In summary, Marinobacter spp. displayed higher electron transfer ca-pability, but obtaining higher Jmax values required the growth of
Desulfuromonas spp. The electrodes formed at −0.4 V/SCE showed poor surface colonization. The potential of −0.4 V/SCE was not high enough to support significant development of Desulfuromonas spp., but Marinobacter spp., which was largely dominant at this potential, was not able to ensure widespread surface colonization. It can conse-quently be assumed that Marinobacter spp. achieved more effective electron transfer than Desulfuromonas spp., but it hardly grew without significant development of Desulfuromonas spp.
This scenario was supported by the crossed analyses of the electro-chemical kinetics, the biofilm structures and the microbial communities and gives a consistent explanation to a set of complex experimental data. The fact that the experiments were reproduced five times, using different samples of the inoculum, with large inoculum amounts, in-creased the variability of the raw experimental data but allowed the conclusions to be considered as characteristic of the inoculum. The strong selection of only two dominant microbial genera at a ratio that depended on the applied potential was thus shown to be reproducible, even using different inoculum samples.
Further experiments with co-cultures of defined species of Desulfuromonas and Marinobacter are now necessary to confirm or cor-rect the proposed scenario. Moreover, this scenario suggests a track to further enhancement of the efficiency of halotolerant bioanodes by favouring the electrode surface colonization by Marinobacter spp., which achieved more efficient electron transfer than Desulfuromonas spp., either by growing a pure culture of Marinobacter spp., or keeping the Desulfuromonas spp. ratio at the minimum required to form a dense biofilm.
4. Conclusions
The 20 bioanodes analysed in this study associated with experi-ments reported previously emphasize the stringent and reproducible selection of the two genera Desulfuromonas and Marinobacter in halotolerant electroactive biofilms. Desulfuromonas spp. have already been identified in electroactive biofilms but, to our knowledge, the Marinobacter genus has not been identified as a source of electroactive species yet.
A tentative scenario of bioanode formation is proposed, showing dif-ferent contributions from each of the two genera. According to this sce-nario, Marinobacter spp. should provide remarkably efficient electroactive species, but they are not able to colonize the electrode sur-face broadly at low potential, in the absence of Desulfuromonas spp. Marinobacter spp. should now be considered as an essential candidate to design efficient microbial anodes able to operate in high-salinity
electrolytes, with the help of Desulfuromonas spp. to enhance biofilm development on the electrode surface.
Acknowledgements
This work was part of the “DéfiH12” project funded by the French National Research Agency (ANR-09-BioE-010).
Appendix A. Supplementary data
Supplementary data to this article can be found online athttp://dx. doi.org/10.1016/j.bioelechem.2016.06.006.
References
[1] D. Pant, A. Singh, G. Van Bogaert, S.I. Olsen, P.S. Nigam, L. Diels, K. Vanbroekhoven, Bioelectrochemical systems (BES) for sustainable energy production and product recovery from organic wastes and industrial wastewaters, RSC Adv. 2 (2012) 1248–1263.
[2] H. Wang, Z.J. Ren, A comprehensive review of microbial electrochemical systems as a platform technology, Biotechnol. Adv. 31 (2013) 1796–1807.
[3] A.P. Borole, G. Reguera, B. Ringeisen, Z.-W. Wang, Y. Feng, B.H. Kim, Electroactive biofilms: current status and future research needs, Energy Environ. Sci. 4 (2011) 4813–4834.
[4] M. Rimboud, D. Pocaznoi, B. Erable, A. Bergel, Electroanalysis of microbial anodes for bioelectrochemical systems: basics, progress and perspectives, Phys. Chem. Chem. Phys. 16 (2014) 16349–16366.
[5] X. Xie, C. Criddle, Y. Cui, Design and fabrication of bioelectrodes for microbial bioelectrochemical systems, Energy Environ. Sci. 8 (2015) 3418–3441.
[6] S.F. Ketep, A. Bergel, A. Calmet, B. Erable, Stainless steel foam increases the current produced by microbial bioanodes in bioelectrochemical systems, Energy Environ. Sci. 7 (2014) 1633–1637.
[7] D. Pocaznoi, A. Calmet, L. Etcheverry, B. Erable, A. Bergel, A. Stainless steel is a prom-ising electrode material for anodes of microbial fuel cells, Energy Environ. Sci. 5 (2012) 9645–9652.
[8] A. Baudler, I. Schmidt, M. Langner, A. Greiner, U. Schroder, Does it have to be car-bon? Metal anodes in microbial fuel cells and related bioelectrochemical systems, Energy Environ. Sci. 8 (2015) 2048–2055.
[9] S. Chen, G. He, Q. Liu, F. Harnisch, Y. Zhou, Y. Chen, M. Hanif, S. Wang, X. Peng, H. Hou, U. Schröder, Layered corrugated electrode macrostructures boost microbial bioelectrocatalysis, Energy Environ. Sci. 5 (2012) 9769–9772.
[10]R. Rousseau, X. Dominguez-Benetton, M.-L. Delia, A. Bergel, Microbial bioanodes with high salinity tolerance for microbial fuel cells and microbial electrolysis cells, Electrochem. Commun. 33 (2013) 1–4.
[11]R. Rousseau, C. Santaella, A. Wafa, J.-J. Godon, A. Bonnafous, A. Bergel, M.-L. Delia, Correlation of the electrochemical kinetics of high-salinity-tolerant bioanodes with the structure and microbial composition of the biofilm, ChemElectroChem 1 (2014) 1966–1975.
[12]M. Mehanna, R. Basseguy, M.-L. Delia, A. Bergel, Role of direct microbial electron transfer in corrosion of steels, Electrochem. Commun. 11 (2009) 568–571.
[13] M.L. Carvalho, J. Doma, M. Sztyler, I. Beech, P. Cristiani, The study of marine corro-sion of copper alloys in chlorinated condenser cooling circuits: the role of microbi-ological components, Bioelectrochemistry 97 (2014) 2–6.
[14]L.E. Chavez de Paz, G. Bergenholtz, G. Svensater, The effects of antimicrobials on endodontic biofilm bacteria, J. Endod. 36 (2010) 70–77.
[15] J.J. Godon, E. Zumstein, P. Dabert, F. Habouzit, R. Moletta, Molecular microbial diver-sity of an anaerobic digestor as determined by small-subunit rDNA sequence analy-sis, Appl. Environ. Microbiol. 63 (1997) 2802–2813.
[16] C. Delbes, R. Moletta, J.J. Godon, Monitoring of activity dynamics of an anaerobic di-gester bacterial community using 16S rRNA polymerase chain reaction — single-strand conformation polymorphism analysis, Environ. Microbiol. 2 (2000) 506–515.
[17] N. Wery, V. Bru-Adan, C. Minervini, J.P. Delgenes, L. Garrelly, J.J. Godon, Dynamics of Legionella spp. and bacterial populations during the proliferation of L. pneumophila in a cooling tower facility, Appl. Environ. Microbiol. 74 (2008) 3030–3037.
[18]R.J. Michelland, S. Dejean, S. Combes, L. Lamothe, L. Cauquil, StatFingerprints: a friendly graphical interface program for processing and analysis of microbial finger-print profiles, Mol. Ecol. Resour. 9 (2009) 1359–1363.
[19] D.A. Finkelstein, L.M. Tender, J.G. Zeikus, Effect of electrode potential on electrode-reducing microbiota, Environ. Sci. Technol. 40 (2006) 6990–6995.
[20]C.I. Torres, R. Krajmalnik-Brown, P. Parameswaran, A.K. Marcus, G. Wanger, Y.A. Gorby, B.E. Rittmann, Selecting anode-respiring bacteria based on anode potential: phylogenetic, electrochemical, and microscopic characterization, Environ. Sci. Technol. 43 (2009) 9519–9524.
[21] E. Marsili, J. Sun, D.R. Bond, Voltammetry and growth physiology of Geobacter sulfurreducens biofilms as a function of growth stage and imposed electrode poten-tial, Electroanalysis 22 (2010) 865–874.
[22]X. Zhu, J.C. Tokash, Y. Hong, B.E. Logan, Controlling the occurrence of power over-shoot by adapting microbial fuel cells to high anode potentials, Bioelectrochemistry 90 (2013) 30–35.
[23] A.S. Commault, G. Lear, M.A. Packer, R.J. Weld, Influence of anode potentials on se-lection of Geobacter strains in microbial electrolysis cells, Bioresour. Technol. 139 (2013) 226–234.
[24] B. Cercado, N. Byrne, M. Bertrand, D. Pocaznoi, M. Rimboud, W. Achouak, A. Bergel, Garden compost inoculum leads to microbial bioanodes with potential-independent characteristics, Bioresour. Technol. 134 (2013) 276–284.
[25] X. Zhu, M.D. Yates, M.C. Hatzell, H.A. Rao, P.E. Saikaly, B.E. Logan, Microbial commu-nity composition is unaffected by anode potential, Environ. Sci. Technol. 48 (2014) 1352–1358.
[26] H.V.M. Hamelers, A. ter Heijne, N. Stein, R.A. Rozendal, C.J.N. Buisman, Butler-Volmer-Monod model for describing bio-anode polarization curves, Bioresour. Technol. 102 (2011) 381–387.
[27] S.F. Wang, T. Chen, Z.L. Zhang, X.C. Shen, Z.X. Lu, D.W. Pang, K.Y. Wong, Direct elec-trochemistry and electrocatalysis of heme proteins entrapped in agaros hydrogel films in room-temperature ionic liquids, Langmuir 21 (2005) 9260–9266.
[28] R. Bond, D.E. Holmes, L.M. Tender, D.R. Lovley, Electrode-reducing microorganisms that harvest energy from marine sediments, Science 295 (2002) 483–485.
[29] T. Zhang, T.S. Bain, M.A. Barlett, S.A. Dar, O.L. Snoeyenbos-West, K.P. Nevin, D.R. Lovley, Sulfur oxidation to sulfate coupled with electron transfer to electrodes by Desulfuromonas strain TZ1, Microbiology 160 (2014) 1123–1129.
[30] S.F. Ketep, A. Bergel, M. Bertrand, A. Achouak, E. Fourest, Lowering the applied po-tential during successive scratching/re-inoculation improves the performance of microbial anodes for microbial fuel cells, Bioresour. Technol. 127 (2013) 448–455.
[31] R.C. Wagner, D.F. Call, B.E. Logan, Optimal set anode potentials vary in bioelectrochemical systems, Environ. Sci. Technol. 44 (2010) 6036–6041.
[32] P. Aelterman, S. Freguia, J. Keller, W. Verstraete, K. Rabaey, The anode potential regulates bacterial activity in microbial fuel cells, Appl. Microbiol. Biotechnol. 78 (2008) 409–418.
[33] S. Parot, M.-L. Delia, A. Bergel, Forming electrochemically active biofilms from gar-den compost under chronoamperometry, Bioresour. Technol. 99 (2008) 4809–4816.
[34] X. Wang, Y. Feng, J. Liu, H. Lee, N. Ren, Performance of a batch two-chambered mi-crobial fuel cell operated at different anode potentials, J. Chem. Technol. Biotechnol. 86 (2010) 590–594.
[35] A.S. Commault, G. Lear, R.J. Weld, Comment on microbial community composition is unaffected by anode potential, Environ. Sci. Technol. 48 (2014) 14851–14852.
[36] X. Zhu, M.D. Yates, M.C. Hatzell, H.A. Rao, P.E. Saikaly, B.E. Logan, Response to com-ment on microbial community composition is unaffected by anode potential, Envi-ron. Sci. Technol. 48 (2014) 14853–14854.