To cite this version : Ochoa, Nathalie and Vega, Carlos and Pébère,
Nadine and Lacaze, Jacques and Brito, Joaquín L. CO2 corrosion
resistance of carbon steel in relation with microstructure changes.
(2015) Materials Chemistry and Physics, vol. 156. pp. 198-205. ISSN
0254-0584
To link to this article : doi:
10.1016/j.matchemphys.2015.02.047
URL :
http://dx.doi.org/10.1016/j.matchemphys.2015.02.047
O
pen
A
rchive
T
OULOUSE
A
rchive
O
uverte (
OATAO
)
OATAO is an open access repository that collects the work of Toulouse researchers and
makes it freely available over the web where possible.
This is an author-deposited version published in :
http://oatao.univ-toulouse.fr/
Eprints ID : 14112
Any correspondance concerning this service should be sent to the repository
administrator:
[email protected]
CO
2
corrosion resistance of carbon steel in relation with
microstructure changes
Nathalie Ochoa
a,*, Carlos Vega
a, Nadine P
eb
ere
b, Jacques Lacaze
b, Joaquín L. Brito
caDepartamento de Ciencia de los Materiales, Universidad Simon Bolívar, Aptdo., 89000, Caracas, Venezuela
bUniversite de Toulouse, CIRIMAT, UPS/INPT/CNRS, ENSIACET, 4 Allee Emile Monso, CS 44362, 31030 Toulouse Cedex 4, France
cLaboratorio de Físico-química de Superficies, Centro de Química, Instituto Venezolano de Investigaciones Cientificas (IVIC), Carretera Panamericana, Km 11, Altos de Pipe, Estado Miranda, Venezuela
h i g h l i g h t s
The effect of change in microstructure on CO2corrosion resistance was evaluated. An API 5LX 42 carbon steel was immersed in a 0.5 M NaCl solution saturated with CO2. Banded, normalized, quenched-tempered and annealed microstructures were considered. Electrochemical measurements were coupled with surface analysis.
Morphology and distribution of undissolved Fe3C control corrosion kinetics.
Keywords: Metals Heat treatment Microstructure Corrosion Electrochemical techniques X-ray photoelectron spectroscopy
a b s t r a c t
The microstructural effects on the corrosion resistance of an API 5L X42 carbon steel in 0.5 M NaCl so-lution saturated with CO2 was investigated. Four microstructures were considered: banded (B),
normalized (N), quenched and tempered (Q&T), and annealed (A). Electrochemical measurements (po-larization curves and electrochemical impedance spectroscopy) were coupled with surface analyses (scanning electron microscope (SEM) and X-ray photoelectron spectroscopy (XPS)) to characterize the formation of the corrosion product layers. Electrochemical results revealed that corrosion resistance increased in the following order: B < N < Q&T < A. From the polarization curves it was shown that specifically, cathodic current densities were affected by microstructural changes. SEM images indicated that ferrite dissolved earlier than cementite and a thin layer of corrosion products was deposited on the steel surface. XPS analyses revealed that this layer was composed of a mixture of iron carbonate and non-dissolved cementite. It was also found that the quantity of FeCO3content on the steel surface was greater
for Q&T and A microstructures. These results, in agreement with the electrochemical data, indicate that the deposition mechanism of iron carbonate is closely related to the morphology of the non-dissolved cementite, determining the protective properties of the corrosion product layers.
1. Introduction
Carbon dioxide corrosion is an important degradation problem with major implications for oil and gas industries. Steel pipes in contact with production fluids are particularly susceptible to this kind of damage. Corrosion results from the dissolution of CO2in the source water forming carbonic acid. Its aggressiveness is affected by interrelated parameters dependent on operational and metallurgical
variables. The former are related to geological characteristics and operational conditions and the latter to the metal's characteristics and the processes used in its manufacture. Even though CO2 corro-sion phenomena have been widely studied since the 70's, only few works are devoted to investigating the influence of the steel's microstructure on its corrosion resistance[1e10].
In early 2000, Lopez et al. [1] published a state-of-the-art appraisal concerning the influence of microstructure and the chemical composition of carbon and low alloy steels on CO2 corrosion. They found that metallurgical variables have a significant influence on the CO2corrosion phenomena but concluded that it is
*Corresponding author.
not possible to obtain general behavior patterns due to the complexity of the problem and the interrelations occurring among the various parameters involved in the occurrence of this phenomenon.
The chemical composition of carbon steel and/or the thermo-mechanical treatment applied during the manufacturing process determine its microstructure. These variables are not independent and the same microstructure can be obtained with different chemical compositions and/or heat treatments. Most previous works have been devoted to evaluating the effect of one parameter without taking into account that the others can also be modified. Thus, some authors have found that the corrosion resistance of carbon steels with a ferritic/pearlitic microstructure was higher than that reached with martensitic steels, whereas other studies have reported the opposite[1e4]. However, as pointed out by Lopez et al.[1], results from these studies are not comparable because the experimental conditions were different.
Although there is no general agreement as to how the micro-structure affects the corrosion resistance of carbon steels, many authors consider that this parameter not only modifies the char-acteristics and the kinetics of corrosion products formation but also has a significant influence on the action of corrosion inhibitors. Some authors[2,3,5,11e16]have found that the steel microstruc-ture plays an important role on the adherence of the corrosion products which mainly consist of iron carbonate (FeCO3). Several
authors have associated the protective properties of the carbonate films to the anchoring effect provided by iron carbide (Fe3C)
[1,2,11,12]; indeed, during the exposure time, the ferritic phase dissolves whereas iron carbide (contained in the pearlite) are highlighted. This effect is a consequence of the galvanic coupling that occurs between these micro-constituents: ferrite acts as anodic site whereas cementite acts as a cathode[17,18]. However, the role of these two components on the stability and on the pro-tective properties of the corrosion product layers is not well understood.
The aim of the present study is to reach a better understanding of the influence of the carbon steel microstructure on its corrosion resistance focusing on the formation of the corrosion product layers. For this purpose, heat treatments were performed on carbon steel API 5L X42 samples in order to modify the morphology and the distribution of the steel constituents while keeping the chem-ical composition constant. Afterwards, corrosion tests were carried out in a CO2saturated brine using electrochemical measurements
coupled with surface analyses in order to evaluate the effect of the steel microstructure.
2. Experimental 2.1. Materials
API 5L X42 carbon steel samples were taken directly from a pipeline. Their chemical composition, determined by inductively coupled plasma e optical spectrometry (ICP-OES), is given inTable 1. As received, the steel presents a banded microstructure that con-stitutes the reference material. This microstructure is currently ob-tained in seamless steel pipes manufactured by extrusion. Different heat treatments, described inTable 2, were performed on banded reference specimens to modify the morphology and distribution of the steel constituents: ferrite (
a
) and pearlite, the latter being alamellar aggregate of ferrite (
a
) and of cementite (Fe3C) whichre-sults from the eutectoid decomposition of high temperature austenite. Four microstructures were thus considered: banded (B), normalized (N), quenched and tempered (Q&T), and annealed (A).
2.2. Metallurgical characterization
The microstructures of the samples were characterized by op-tical microscopy (OM) following conventional metallographic procedures specified in ASTM E 3-01 and E 407-99 standards
[19,20]. The samples were etched with 5% Nital solution during 10 s. Phase fractions were determined using ImageJ®
analysis software. The mechanical properties of the heat-treated steels were tested by Rockwell B measurements correlated to the ultimate tensile stress (UTS) using conversion tables presented in the ASTM E140-97 standard[21].
2.3. Electrochemical measurements
A standard Pyrex three-electrode cell was used with a platinum grid as counter electrode, a saturated calomel electrode (SCE) as reference and rods of the steel as rotating disk electrodes. Working electrode rods consisted of cylinders 7 mm of diameter which were covered with a heat shrinkable sheath in order to leave only the tip of the steel electrodes in contact with the corrosive medium. Prior to electrochemical measurements, the electrodes were ground with SiC papers down to grade 1200. Afterwards, they were cleaned with ethanol, rinsed with distilled water and dried in warm air. The electrode rotation rate was fixed at 200 rpm. The corrosive medium was a 0.5 M solution of NaCl (reagent grade), initially purged with nitrogen for 30 min and then CO2 was bubbled through for 1 h
before introduction of the sample into the cell. CO2bubbling was
maintained during the experiment to limit the ingress of air. Ex-periments were carried out at atmospheric pressure and room temperature. The pH of the corrosive solution was around 3.5 and did not change during the experiments.
Polarization curves and electrochemical impedance diagrams were obtained after 6 h of immersion at the corrosion potential. Current-voltage curves were obtained under potentiodynamic regulation using a Solartron 1286 electrochemical interface. They were plotted from the cathodic to the anodic range, from 1 V/SCE to 0.4 V/SCE. The potential sweep rate was fixed at 10 mV min 1. Electrochemical impedance measurements were carried out using a Solartron 1286 electrochemical interface connected to a Solartron 1250 frequency response analyzer. Impedance diagrams were ob-tained under potentiostatic regulation, at the corrosion potential, over a frequency range of 65 kHz to 7 mHz with 8 points per decade, using a 8 mV peak-to-peak sinusoidal voltage. Three ex-periments were carried out to ensure reproducibility.
2.4. Surface analyses
The morphology of the corroded steel electrodes was observed using a LEO 435 VP scanning electron microscope operating at
Table 1
Chemical composition of API 5LX 42 carbon steel.
C Si Mn P Cu Nb V Ti Fe
0.211 0.263 0.768 0.011 0.086 0.002 0.004 0.003 Balance
Table 2
Characteristics of the heat treatments applied to the carbon steel samples.
Heat treatment Characteristics
Normalized (N) Austenitizing at 1350!C for 10 min followed by air
cooling Quenched and
tempered (Q&T)
Austenitizing at 900!C for 20 min followed by
quenching in water. The steel was tempered at
650!C for 60 min
15 kV. The chemical composition of the corroded electrodes was determined using x-ray photoelectron spectroscopy (XPS) carried out on a VG Escalab 220i-XL spectrometer. For the surface analyses, steel samples were prepared by the same procedure as for the electrochemical experiments. After 6 h of immersion, the elec-trodes were removed from the solution after anodic polarization. They were rinsed with ethanol and dried in warm air before being placed in a fast-entry pre-chamber and then in the analysis chamber. The specimens were irradiated using a Mg K
a
X-ray source with a power of 300 W. Measurements were made at a take-off angleq
¼ 90!. The experimental resolution of the bindingen-ergy was 1 eV. After background subtraction, peak deconvolution was performed using XPSGRAF102 software. Binding energies were corrected for possible charging effects by referencing to the C1s (284.5 eV) peak. The chemical composition of the steel surfaces was analyzed monitoring the C1s, O1s and Fe 2p3/2signals.
3. Results
3.1. Metallurgical characterization
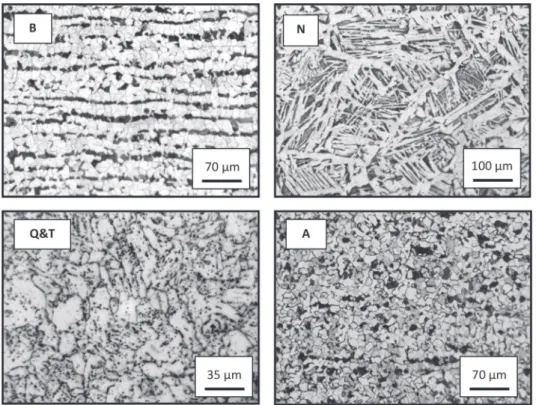
Representative micrographs of the different steel microstruc-tures are presented inFig. 1. The microstructures present are seen to depend on the heat treatment applied with light and dark zones which have different distributions and morphologies. It can be noted that the banded microstructure of the reference sample disappeared after the heat treatments. The banded (B) micro-structure is composed of alternating light and dark bands corre-sponding to equiaxed proeutectoid ferrite grains and coarse pearlite, respectively[22]. This microstructure results from a slow cooling rate from the austenitizing temperature and is the mani-festation of the segregation of alloying elements during the steel solidification process[23,24]. Light and dark areas observed on the normalized (N) microstructure correspond to ferrite and fine pearlite, respectively[22]. In this case, proeutectoid ferrite located
at the grain boundaries of a coarse former austenite grain has a polygonal morphology; ferrite situated within the grains grows as Widmanst€atten ferrite plates[22]. This microstructure is frequently obtained when a short, high temperature heat treatment is per-formed on a low carbon steel[25,26]. The quenched and tempered (Q&T) microstructure consists of dark precipitates randomly dispersed in a light matrix which corresponds to isolated cementite globules and a ferritic matrix, respectively[22]. Globular cementite results from the transformation of martensite to ferrite and car-bides[25]. The annealed (A) microstructure consists of light and dark grains whose sizes are relatively uniform and correspond to proeutectoid ferrite and colonies of pearlite, respectively[22]. In addition, coarse pearlite is also observed at ferrite grain boundaries. The long sub-critical annealing applied in this study leads to a redistribution of the cementite (Fe3C) in pseudo-spherical pearlite
agglomerates [22,26]. Volume fractions determined for the different steel microstructures revealed that all samples contain ferrite as major component while the pearlite was slightly different depending on the steel microstructures: B (25.9%), N (27.6%), Q&T (27.5%), A (26.3%). In the pearlitic fraction, the amount of ferrite was much larger than the amount of cementite. If the pearlitic fraction is considered constant and equal to 27% for all microstructures, the total Fe3C quantity can be estimated from the FeeFe3C equilibrium
phase diagram using the lever rule at the eutectoid temperature. This implies a volumetric pearlitic fraction near to 3% but the exact percentage is slightly modified if we consider the effect of other alloying elements.
Correlations of the Rockwell B hardness measurements made on different samples to the ultimate tensile stress (UTS) indicated that the UTS values are between 579 and 482 MPa after the different heat treatments[21]. It can be mentioned that 414 MPa corre-sponds to the minimum UTS value specified in the API 5L Standard for X42 grade carbon steel pipes[27]. From an industrial point of view, the steel samples evaluated in this study fulfill the mechan-ical requirements specified in the API 5L standard.
3.2. Electrochemical characterization
The variation of the corrosion potential, Ecorr, of the carbon steel
electrodes was plotted as a function of immersion time (Fig. 2). It can be observed that Ecorris independent of the steel
microstruc-ture: after 1 h of immersion, Ecorrshifted slightly in the positive
direction and then it slowly decreased to remain relatively constant at around 0.670 V/SCE, indicating that the electrochemical system reached a steady state after 6 h of immersion.
Electrochemical impedance measurements were carried out at Ecorrfor the different samples (Fig. 3). The spectra are characterized
by two time constants: a capacitive loop in the middle frequency range and an inductive loop in the low frequency domain. The shape of the diagram in the low frequency domain is not exactly the same for all the spectra. For the Q&T and for the A microstructures, the inductive loop tends to close on itself giving rise to another capacitive loop. In previous works [17,18,30], the medium fre-quency loops are attributed to the charge transfer process on the ferritic phase freely dissolving into a faulty layer of siderite (FeCO3)
as corrosion product. In this case, the charge transfer resistance (RT)
would also reflect differences in the uncorroded cementite (Fe3C)
area, revealed after 6 h of immersion for the different microstruc-tures. Inductive behavior is generally associated with the existence of relaxation processes of adsorbed species at the metal/solution interface[27e31]and closure of the inductive loop is attributed to an activeepassive transition[31,32].
Equivalent electrical circuits are frequently used to extract the parameters associated with the impedance diagrams where a constant phase element (CPE) is used instead of a capacitance to take the non-ideal behavior of the interface into account. The CPE is given by:
ZCPE¼ 1
Q ðjuÞa (1)
where
a
is related to the angle of rotation of a purely capacitive lineon the complex plane plots and Q is a constant expressed in
U
1 cm 2sa. In the present study, parameters were graphically obtained: the electrolyte resistance (Re) and the resistanceassoci-ated with the capacitive loop (RT), physically related to the
corro-sion resistance, were directly measured on the impedance spectra;
a
and Q were determined using the graphical method proposed byOrazem et al. [18]. The effective capacitance Ceff (expressed in
Farads), was calculated from the CPE parameters considering a distribution of the charge transfer resistances on the electrode surface[29]:
Ceff ¼ Q1=aðReRT=ðRe þ RTÞÞð1 aÞ=a (2)
The impedance parameters are reported inTable 3. It can be seen that the RTvalue depends on the heat treatment and increases
in the following order: B < N < Q&T < A. On the other hand, the capacitance values were higher than 50
m
F cm 2and the product RT
Ceffwas not constant; therefore, the capacitive loops are thought to
result from both a charge transfer process occurring on the ferritic phase, that freely dissolves and a film effect due to the corrosion products that precipitate on the steel surface. Thus, the impedance results indicated that the CO2corrosion resistance of the API 5L X42
steel was sensitive to the heat treatments performed. Furthermore, the shape of the impedance spectra in the low frequency range indicates different corrosion mechanisms when B/N and Q&T/A microstructures are compared.
To evaluate the influence of the microstructure on the electrode kinetics, polarization curves were obtained for the different heat -0.8 -0.75 -0.7 -0.65 -0.6 -0.55 -0.5 0 1 2 3 4 5 6 7 B N A Q&T E c o rr v s S C E ( V ) t (h) A Q
Fig. 2. Corrosion potential versus immersion time in a 0.5 M NaCl solution saturated
with CO2for the different steel microstructures.
Fig. 3. Electrochemical impedance diagrams obtained at the corrosion potential after
6 h of immersion in a 0.5 M NaCl solution saturated with CO2for the different steel
microstructures.
Table 3
Electrochemical parameters obtained from the impedance diagrams presented in
Fig. 3. B N Q&T A Re(Ucm2) 5.7 5.8 5.6 5.5 RT(Ucm2) 217 235 267 320 a 0.82 0.84 0.85 0.83 Q (MU 1cm 2sa) 1027 485 397 381 Ceff(mF cm 2) 330 158 135 107 -1 -0.9 -0.8 -0.7 -0.6 -0.5 -0.4 10-6 10-5 10-4 10-3 10-2 10-1 B A Q&T N Ecorr vs SCE (V) i ( A /c m 2 )
Fig. 4. Current-voltage curves obtained after 6 h of immersion in a 0.5 M NaCl solution
treated steels after 6 h of immersion (Fig. 4). It can be observed that the shape of the currentevoltage curves is similar. In the anodic domain, a Tafelian part for the low anodic overvoltage is observed. The anodic Tafel slopes are independent of the steel microstructure
with values varying between 90 and 94 mV dec 1. Besides,
around 0.54 V/SCE, the anodic current densities systematically decreased recalling a pseudo-passivation plateau; nevertheless, current densities increase again for higher overvoltages. For the cathodic domain, a well-defined current plateau is observed which is ascribed to the mass transport of the hydrogen reduction reaction
[33]. The values of the cathodic current densities on the plateau (ilim) are reported inTable 4. The values decrease in the following
order ilim B>ilim N>ilim Q&T>ilim A, in agreement with the increase
of the RTvalues obtained from the impedance spectra. A decrease of
ilimof about 30% is observed between the banded and the annealed
samples. This result was reproducible and indicates that the heat treatment performed on the steel mainly affects the cathodic
Table 4
Electrochemical parameters involved in the calculation of the corrosion rate for the API 5LX 42 steel with different microstructures.
B N Q&T A
ba(mV dec 1) 92 92 94 91
ilim(mA cm 2) 190 153 122 106
icorr(mA cm 2) 180 166 146 122
CR (mm year 1) 2.1 1.9 1.7 1.4
Fig. 5. SEM observations of the corroded steel surfaces after a preliminary hold time of 6 h in a 0.5 M NaCl solution saturated with CO2; left and right images were obtained for two
reaction. Modification of the diffusion current densities could be linked to the precipitation of non-soluble corrosion products such as siderite that limits the cathodic reaction decreasing the surface area available for the reaction. This result is in agreement with the impedance data.
The corrosion rates (CR) of the steel with the different micro-structures were calculated from the electrochemical parameters (Table 4) according to the ASTM G 102-04 Standard[34]with the following equation: CR ¼ (K icorr EW)/
r
, where K is a constant(3.27 & 10 3 mm g
m
A 1 cm year),r
is the density of iron (7.86 g cm 3) and EW is the equivalent weight of the carbon steelestimated at 28. Corrosion current densities (icorr) were determined
using the simplified Stern and Geary equation (icorr ¼
b
a/2.3 RT)since it was shown that the cathodic reaction is under diffusion control [35]. The RT values were obtained from the impedance
spectra (Table 3) and anodic Tafel slopes (
b
a) were measured fromthe polarization curves. The anodic Tafel slope value used for the calculation was 90 mV dec 1for all microstructures. As expected,
the corrosion rate decreased in the following order: B > N > Q&T > A. The corrosion rate of the steel with an annealed microstructure is about 35% lower than that of the banded steel but it is predictable that this difference will be greater for longer exposure times. This result is in agreement with those obtained by Al-Hassan et al.[5]who used weight loss measurements to study the effect of the microstructure on the corrosion of steels in aqueous solutions containing carbon dioxide. In their study, longer immersion periods (>400 h) were necessary to show differences in the corrosion resistance of the carbon steels with the different microstructures; in our study, the same result was obtained after only 6 h.
3.3. Surface analyses
SEM images of corroded carbon steel surfaces after 6 h of im-mersion in the 0.5 M NaCl solution saturated with CO2can be seen
inFig. 5. The features of light and dark zones imitate the steel microstructures presented inFig. 1. Higher magnification images (right panel) reveal that the dark areas correspond to the selective dissolution of the ferritic matrix. The lamellar or globular mor-phologies of the light zones correspond to the non-dissolved cementite contained in the pearlitic structure. Selective dissolu-tion of the ferritic phase with respect to cementite indicates that microgalvanic cells are formed between these constituents influ-encing the kinetics of the corrosion process. SEM images revealed that ferrite is the anode while iron carbide, contained in the eutectoid mixture, is the cathode, in agreement with its lower electrical conductivity[36]. Recently, Farelas et al.[17]confirmed that cementite forms preferential cathodic sites with lower over-potential favoring hydrogen evolution. These results are also in
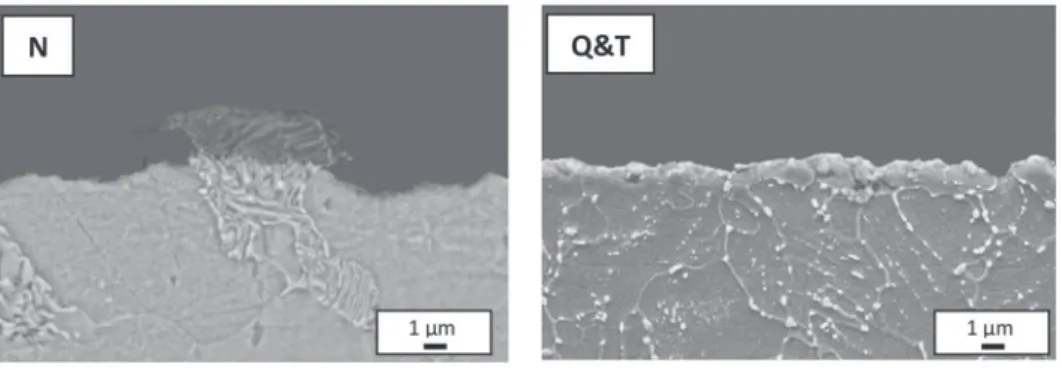
agreement with previous works reported in the literature[11,37]. In addition, it can be seen that the cementite surface area increases when selective dissolution of ferrite takes place and thus the galvanic coupling between the iron carbides and the ferritic matrix is enhanced. A very thin whitish layer can be observed on cementite, which is more visible on the lamellar structure of banded (B) and normalized (N) samples. For these two micro-structures, it seems that a very thin layer of corrosion products forms on the outer part of the remaining cementite structure far from the metal substrate; conversely, in the case of quenched and tempered (Q&T) and annealed (A) microstructures, this layer could precipitate near the metal surface due to the different morphology of the iron carbide. This feature can be observed on the cross-sectional views of the N and Q&T samples (Fig. 6).
The chemical composition of the corroded steel surfaces was determined by XPS analysis.Fig. 7shows a comparison of the high resolution spectra corresponding to C 1s, O 1s and Fe 2p regions obtained from the corroded steel surfaces with different micro-structures. Deconvolution of C 1s region reveals peaks at 283.6, 284.6, 286.3, and 288.7 eV which correspond to binding energies of carbon in cementite (Fe3C), adventitious species like graphitic
carbon and ethanol (CH3CH2OH), and iron carbonate (FeCO3),
respectively [38e40]. Peaks obtained at 528.6, 530.2, and 531.7 from deconvolution of the O 1s spectra correspond to the binding energies of O2 , OH , and CO32 ions in hematite (Fe2O3), iron
oxy-hydroxide (FeOOH) and iron carbonate, respectively [3,37,38]. These signals are in agreement with those obtained from the Fe 2p3/2spectra. Although the Fe signals are inherently less intense
and more surface sensitive, deconvolution of iron spectra reveals different signals according to the steel microstructure. In the case of the banded (B) and normalized (N) samples, only a signal at ~711 eV was observed due to the binding energy of iron in Fe2O3.
Addi-tionally, quenched and tempered (Q&T) and annealed (A) samples exhibited a signal at ~712.2 eV corresponding to iron carbonate. Iron oxy-hydroxide signals could be related to the partial decom-position of iron carbonate when CO2 corroded samples were
exposed to air before being placed in the analysis chamber. Ac-cording to several authors[39,40], iron carbonate decomposed into
a
-Fe2O3 þ CO2 in air at temperatures below 100 !C. This couldexplain why the metallic iron signal at about 706.6 eV was not detected. However, the amount of iron carbonate at the metal surface detected by XPS analyses was higher for the less corrosion-prone samples (Q&T and A) and diminished with decreased corrosion resistance (N and B).
4. Discussion
The electrochemical results presented here show that the CO2
corrosion resistance of the API 5L X42 steel depends on its
Fig. 6. SEM observations of the cross-sectional views of the corroded steel surfaces after 6 h of immersion in a 0.5 M NaCl solution saturated with CO2: Normalized (N) and
microstructure. From the electrochemical measurements, it was found that the Q&T and A samples show the lowest corrosion rates compared with the B and N microstructures. Polarization curves revealed that this result was mainly linked to the differences in the cathodic reduction reaction. SEM images showed that when the corrosion process took place, the morphology of the undissolved cementite was revealed by the selective dissolution of the ferritic phase. Additionally, a very thin whitish layer deposits on the metal surface which is more or less continuous depending on the steel microstructure. From XPS analyses, the presence of FeCO3on the
steel surfaces was more abundant on Q&T and A microstructures. Joint analysis of electrochemical and surface characterizations indicated that the corrosion resistance of the API 5L X42 steel, is closely related to the morphology of non-corroded iron carbide which controls the iron carbonate deposition. It is determined by the heat treatment performed on the steel samples which also establishes the characteristics of the microgalvanic coupling be-tween ferrite and cementite. When corrosion develops, the galvanic coupling could be accentuated by the precipitation of siderite on the steel surface.
Our results suggest that when the ferrite and pearlite areas were better differentiated, the strength of the galvanic coupling between ferrite and cementite increased. Thus, as the corrosion process evolves, a critical concentration of ferrous cations at the metal/so-lution interphase was reached; as a consequence, iron carbonate precipitated partially covering the steel surface. Precipitation of siderite is also favored by a local increase of the pH when the hydrogen evolution occurs on the cathodic sites. For steels with banded (B) and normalized (N) microstructures, iron carbonate forms on the outer part of the remaining cementite structure far from the metal substrate. This feature leads to the internal acidi-fication between the non-corroded lamellae of Fe3C that further
prevents precipitation of FeCO3 directly on the metal surface. In
these cases, the resulting layers are non-protective and the CO2
corrosion resistance of the steel is low. Conversely, for samples with
Q&T and A microstructures, the morphology and distribution of the undissolved cementite favor the formation of FeCO3 directly in
contact with the metal substrate. In these cases, corrosion product layers are more continuous and protective; this explains the highest RTvalues, the lower effective capacitance, and the lowest
cathodic current densities obtained for these samples.
5. Conclusions
Electrochemical measurements carried out after 6 h of immer-sion in a 0.5 M NaCl solution saturated with CO2revealed that the
corrosion resistance of API 5L X42 steel was dependent on the heat treatments performed. It was found that the corrosion rate decreased as a function of the microstructure in the following or-der: banded (B) > normalized (N) > quenched and tempered (Q&T) > annealed (A). This behavior was explained by the differ-ences between the distribution and morphology of the non-corroded cementite which controls the intensity of the galvanic coupling between ferritic and pearlitic steel constituents and the formation of iron carbonate layers at long term.
Acknowledgments
This work was carried out within the international framework agreement between the Fondo Nacional de Ciencia Tecnología e Innovacion (FONACIT) in Venezuela and the Centre National de la Recherche Scientifique (CNRS) in France. Partial financial support was provided by Universidad Simon Bolívar, University finances airfare Engineer Carlos Vega to France under the Masters program. The authors wish to express their gratitude to Alberto Albornoz and Yannick Thebault for their most valuable assistance in XPS and SEM, respectively.
References
[1]D.A. Lopez, T. Perez, S.N. Simison, The influence of microstructure and chemical composition of carbon and low alloy steels in CO2corrosion. A state-of-the-art appraisal, Mater. Des. 24 (2003) 561.
[2]A. Dugstad, H. Hemmer, M. Seiersten, Effect of steel microstructure on corrosion rate and protective iron carbonate film formation, Corrosion 57 (4) (2001) 369.
[3]D.A. Lopez, W.H. Schreiner, S.R. de Sanchez, S.N. Simison, The influence of carbon steel microstructure on corrosion layers. An XPS and SEM character-ization, Appl. Surf. Sci. 207 (2003) 69.
[4]D.A. Lopez, S.N. Simison, S.R. de Sanchez, The influence of steel microstructure on CO2corrosion. EIS studies on the inhibition efficiency of benzimidazole, Electrochim. Acta 48 (2003) 845.
[5]S. Al-Hassan, B. Mishra, D. Olson, M. Salama, Effect of microstructure on corrosion of steels in aqueous solutions containing carbon dioxide, Corrosion 54 (10) (1998) 480.
[6]M. Ueda, A. Ikeda, Effect of microstructure and Cr content in steel on CO2 corrosion, in: Proceedings of the International Corrosion Conference, Paper 13, NACE International, USA, 1996.
[7]M. Ueda, H. Takabe, Effect of environmental factor and microstructure on morphology of corrosion products in CO2environments, in: Proceedings of the International Corrosion Conference, Paper 13, NACE International, USA, 1999. [8]J.K. Heuer, J.F. Stubbins, Microstructure analysis of coupons exposed to carbon
dioxide corrosion in multiphase flow, Corrosion 54 (7) (1998) 566. [9]R. Quiroz, A. Rosales, E. Baron, Efecto de la perlita en aceros bandeados sobre
la resistencia a la corrosion por CO2, RLMM 29 (2009) 84.
[10] L.N. Xu, S.Q. Guo, C.L. Gao, W. Chang, T.H. Chen, M.X. Lu, Influence of micro-structure on mechanical properties and corrosion behavior of 3% Cr steel in CO2environment, Mater. Corros. 1 (2012) 566.
[11] J. Crolet, N. Thevenot, S. Nesic, Role of conductive corrosion products in the protectiveness of corrosion layers, Corrosion 54 (3) (1998). NACE Interna-tional, 194.
[12] J.L. Mora-Mendoza, S. Turgoose, Fe3C influence on the corrosion rate of mild steel in aqueous CO2systems under turbulent flow conditions, Corros. Sci. 44 (2002) 1223.
[13] V. Ruzic, M. Veidt, S. Nesic, Protective iron carbonate films. Part 1: mechanical removal in single-phase aqueous flow, Corrosion 62 (5) (2006) 419. [14] B. Kinsella, Y.J. Tan, S. Bailey, Electrochemical impedance spectroscopy and
surface characterization techniques to study dioxide carbon product scales, Corrosion 58 (10) (1998) 835.
[15] K. Videm, J. Kvarekvaal, T. Perez, G. Fitzsimons, Surface effects on the elec-trochemistry of iron and carbon steel electrodes in aqueous CO2solutions, in: Proceedings of the International Corrosion Conference, Paper 1, NACE Inter-national, USA, 1996.
[16] C. Palacios, J. Shadley, Characteristics of corrosion scales on steels in a CO2 saturated NaCl brine, in: Proceedings of the International Corrosion Confer-ence, Paper 47, NACE International, USA, 1991.
[17] F. Farelas, M. Galicia, B. Brown, S. Nesic, H. Castaneda, Evolution of dissolution processes at the interface of carbon steel corroding in a CO2environment studied by EIS, Corros. Sci. 52 (2010) 509.
[18] M. Henriquez, N. Peb ere, N. Ochoa, A. Viloria, Electrochemical investigation of the corrosion behavior of API 5L-X65 carbon steel in carbon dioxide medium, Corrosion 69 (2013) 1171.
[19] ASTM E 3e01, Standard Guide for preparation of Metallographic Specimens,
American Society for Testing Materials.
[20] ASTM E 407e99, Standard Guide for Microetching Metals and Alloys, Amer-ican Society for Testing Materials.
[21] ASTM E 140e97, Standard Hardness Conversion Tables for Metals. Relation-ship Among Brinell Hardness Vickers Hardness, Rockwell Hardness, Superfi-cial Hardness, Knoop Hardness, and Scleroscope Hardness, American Society for Testing Materials.
[22] ASM Metals Handbook, Metallography and Microstructures, vol. 4, 2004. [23] R. Grange, Effect of microstructural banding in steel, Metal. Trans. 2 (1971)
417.
[24] T. Yamashita, S. Torizuka, K. Nagai, Effect of manganese segregation on fine-grained ferrite structure in low-carbon steel slabs, ISIJ Int. 43 (11) (2003) 1833.
[25] D. Porter, K. Easterling, Phase Transformations in Metals and Alloys, second ed., Chapman & Hall, London, UK, 1992.
[26] ASM Metals Handbook, Heat Treating, Vol. 4, 1991.
[27] API 5L Standard, Specification for line pipe. 45th ed., American Petroleum Institute.
[28] M.E. Orazem, N. Peb ere, B. Tribollet, Enhanced graphical representation of electrochemical impedance data, J. Electrochem. Soc. 153 (2006) B129. [29] B. Hirschorn, M.E. Orazem, B. Tribollet, V. Vivier, I. Frateur, M. Musiani,
Determination of effective capacitance and film thickness from constant-phase-element parameters, Electrochem. Acta 55 (2010) 6218.
[30] G.A. Zhang, Y.F. Cheng, Corrosion of X65 steel in CO2-saturated oilfield for-mation water in the absence and presence of acetic acid, Corros. Sci. 51 (2009) 1589.
[31] M. Keddam, O.R. Mattos, H. Takenouti, Reaction model for iron dissolution studied by electrode impedance. Part I- experimental results and reaction model, J. Electrochem. Soc. 128 (1981) 257.
[32] C. Gabrielli, Identification of Electrochemical Processes by Frequency Response Analysis, Solartron Analytical, Technical Report Number 004/83, 1998 (France).
[33] E. Remita, B. Tribollet, E. Sutter, V. Vivier, F. Ropital, J. Kittel, Hydrogen evo-lution in aqueous soevo-lutions containing dissolved CO2: quantitative contribu-tion of the buffering effect, Corros. Sci. 50 (2008) 1433.
[34] ASTM G 102e04. Standard Practice for Calculation of Corrosion Rates and Related Information from Electrochemical Measurements, American Society for Testing Materials.
[35] M. Stern, A.L. Geary, Discussion of electrochemical polarization, 1. A theo-retical analysis of the shape of polarization curves, J. Electrochem. Soc. 104 (1957) 56.
[36] M. Umemoto, Z.G. Liu, H. Takaoka, M. Sawakami, K. Tsuchiya, K. Masuyama, Production of bulk cementite and its characterization, Metal. Mater. Trans. A 32 (2001) 2127.
[37] L.D. Paolinelli, T. Perez, S.N. Simison, The effect of pre-corrosion and steel microstructure on inhibitor performance in CO2corrosion, Corros. Sci. 50 (2008) 2456.
[38] S. Wu, Z. Cui, F. He, Z. Bai, S. Zhu, X. Yang, Characterization of the surface film formed from carbon dioxide corrosion on N80 steel, Mater. Lett. 58 (2004) 1076.
[39] J.K. Heuer, J.F. Stubbins, An XPS characterization of FeCO3from CO2corrosion, Corros. Sci. 41 (1999) 1231.
[40] T.L. Webb, J.E. Kruger, Differential thermal analysis, in: R.C. Mackenzie (Ed.), Fundamental Aspects, vol. 1, Academic Press, New York, 1970, p. p 327.