Any correspondence concerning this service should be sent to the repository administrator:
[email protected]
Identification number: DOI: 10.1016/j.jpowsour.2013.08.049
Official URL:
http://dx.doi.org/10.1016/j.jpowsour.2013.08.049
This is an author-deposited version published in:
http://oatao.univ-toulouse.fr/
Eprints ID: 11743
To cite this version:
El Hannach, Mohamed and Soboleva, Tatyana and Malek, Kourosh and Franco,
Alejandro A. and Prat, Marc and Pauchet, Joel and Holdcroft, Steven
Characterization of pore network structure in catalyst layers of polymer
electrolyte fuel cells. (2014) Journal of Power Sources, vol. 247 (n° 1). pp.
322-326. ISSN 0378-7753
O
pen
A
rchive
T
oulouse
A
rchive
O
uverte (
OATAO
)
OATAO is an open access repository that collects the work of Toulouse researchers and
makes it freely available over the web where possible.
Characterization of pore network structure in catalyst layers
of polymer electrolyte fuel cells
Mohamed El Hannach
a,*, Tatyana Soboleva
b, Kourosh Malek
b,c, Alejandro A. Franco
a,1,2,
Marc Prat
d,e, Joël Pauchet
a, Steven Holdcroft
b,caCEA, LITEN, LCPEM, 17 rue des Martyrs, F-38054 Grenoble, France
bDepartment of Chemistry, Simon Fraser University, Burnaby, BC, Canada V5A 1S6 c
National Research Council of Canada, Institute for Fuel Cell Innovation, 4250 Wesbrook Mall, BC, V6T 1W5 Vancouver, Canada
dUniversity of Toulouse, INPT, UPS, IMFT, Avenue Camille Soula, 31400 Toulouse, France eCNRS, IMFT, 31400 Toulouse, France
h i g h l i g h t s
g r a p h i c a l
a b s t r a c t
We build a comprehensive model of nitrogen adsorption isotherm. The results confirm the existence of
different sorption regimes.
We validate the representation of a catalyst layer porous media using a pore network.
The effect of ionomer content on pore size distribution was successfully modeled.
Keywords:
Pore network modeling Catalyst layer
Polymer electrolyte fuel cell Nitrogen adsorption isotherm Pore size distribution
a b s t r a c t
We model and validate the effect of ionomer content and Pt nanoparticles on nanoporous structure of catalyst layers in polymer electrolyte fuel cells. By employing Pore network modeling technique and analytical solutions, we analyze and reproduce experimental N2-adsorption isotherms of carbon, Pt/
carbon and catalyst layers with various ionomer contents. The porous catalyst layer structures comprise of Ketjen Black carbon, Pt and Nafion ionomer. The experimental pore size distributions obtained by N2
-adsorption are used as an input to generate porous media using the pore network approach. Subse-quently, the simulated porous structures are used to produce simulated N2-adsorption isotherms, which
are then compared to the experimentally measured isotherms. The results show a good agreement in the prediction of the effect of the ionomer content on the microstructure of catalyst layers. Moreover, the analysis of the isotherms confirms the hypothesis of ionomer distribution on the surface of agglomerates as well as the existence of different sorption regimes in primary and secondary pores of fuel cell catalyst layers.
1. Introduction
In current and past physical models of Catalyst Layer (CL) in Polymer Electrolyte Fuel Cells (PEFCs), there has been a lack of clear CL nanostructure picture, in particular, structure and function of ionomer, nature and distribution of active interfaces, structure and composition of agglomerates, porosity, mixed
* Corresponding author. Simon Fraser University, Mechatronic Systems Engineering, School of Engineering Science, 250-13450 102 Avenue, Surrey, BC, Canada V3T 0A3.
E-mail address:[email protected](M. El Hannach).
1 Laboratoire de Réactivité et de Chimie des Solides (L.R.C.S.), Université de Picardie Jules Verne, CNRS UMR 7314-33 rue Saint Leu, Amiens, France.
2 Réseau sur le Stockage Electrochimique de l’Energie (RS2E), FR CNRS 3459, France.
wettability, and water distribution [1]. Simulations of micro-structure formation, including self-organization of components in CL, predict the interplay between fabrication parameters, structure and transport properties[2,3]. Moreover, understand-ing CL structure is imperative for development of novel materials and improvement of CL physicochemical properties. Neverthe-less, in order to evaluate the impacts on “pseudo” steady state performance and durability, modeling efforts are needed to couple basic structural parameters obtained from modeling the CL microstructure formation to the fuel cell performance modeling[4,5].
In order to complete basic structural aspects, the remaining is-sues include establishing a relationship between composition and microstructure in terms of ionomer and Pt content, pore size dis-tribution, and pore network characteristics. The Pore Network Modeling (PNM) approach is widely used to study the transport phenomena inside porous materials and its application has increased recently in the field of Proton Exchange Membrane Fuel Cell (PEMFC) materials. The main input of the PNM is the pore size distribution (PSD). Nitrogen physisorption is a common tool used to evaluate microstructures of porous materials and obtain pore size distribution curves. The PSD can be estimated either from adsorption or desorption isotherms using modified forms of Kelvin equation for capillary condensation.
In this work, we used the PSDs extracted from the nitrogen adsorption isotherms for various catalyst layer compositions as an input parameter for the PNM. The experimentally-derived iso-therms were reported in Ref.[6]and explained in theExperimental section. Then the adsorption isotherms are simulated using the model described below to reproduce the experimental isotherms. The flexibility of the PNM allows for simulation of the nitrogen adsorption process with the consideration of pores blockage due to nitrogen condensation. A comparison between the experimental and simulated isotherms validates representation of the CL using the pore network model.
2. Experimental
In a previous study by Soboleva et al.[6], Ketjen Black carbon and a catalyst powder with 46 wt% Pt on Ketjen Black from Tanaka Kikinzoku Kogyo (TKK)[1,6]were used for N2-adsorption studies
and for fabrication of the catalyst coated membranes (CCMs). All CCMs were fabricated by spray-deposition of catalyst inks on Nafion 211 membrane, used as received. CCMs with 5, 10, 30 and 50 wt% of ionomer in the CL corresponding to 0.047 mg cm 2(0.1 I/ C), 0.094 mg cm 2 (0.2 I/C), 0.375 mg cm 2 (0.8 I/C), and
0.875 mg cm 2(1.8 I/C) ionomer loadings were prepared. Carbon
and Pt loadings were held constant at 0.475 mg cm 2and 0.4 mg cm 2respectively. The thickness of the catalyst layers was
12 ! 2.0
m
m.N2-physisorption experiments, previously published in Ref.[6],
were performed at 77 K on a 3100 Surface Area Analyzer (Beckman Coulter ). N2gas of ultra-high purity 99.999% was used. Carbon
and Pt/carbon samples of w100 mg were degassed at 160"C for
12 h prior to the adsorption experiment to remove any residual water from the samples. CCMs of total 50 cm2were cut into thin strips, placed in the sample tube and degassed for 12 h at 105"C.
Adsorption experiments were performed immediately after degassing. A blank adsorption experiment on Nafion 211 mem-brane was performed and it was found that contribution of the membrane to N2adsorption of CCMs is negligible. Adsorption
iso-therms of Pt/carbon powders and CCMs were all re-plotted after normalizing by carbon content in each sample. BET surface areas were found from BET equation[7], by plotting left-hand side term of the equation against p/p0 in the range from 0.05 to 0.2 p/p0.
Monolayer volume, nm, was found from the slope and the intercept
of such a BET plot, Eq.(1):
nm ¼
1
slope þ intercept (1)
Surface area is then calculated from Eq.(2):
SABET ¼
nm$N$s
V (2)
where N e Avogadro’s number, s e cross-sectional area of the N2
molecule (0.162 nm2); V e molar volume of adsorbent gas.
Total pore volume was found at a partial pressure of 0.98 p/p0
(STP) by converting to liquid nitrogen volume using the conversion factor of 0.001547[8].
Pore size distributions (PSDs) were assessed using the Barrete JoyceeHalenda (BJH) method, which is based on the Kelvin equa-tion and accounts for the formaequa-tion of a condensed layer adsorbed on the pore wall prior to capillary condensation, which is accounted for using HarkinseJura equation:
tN2 ¼
13:99
0:034 logðp=p0Þ 1=2
!!A" (3)
where tN2e thickness of the adsorbed layer on the pore wall, !A; p e partial pressure of N2; p0e saturation pressure of N2at 77 K[9].
3. Model development
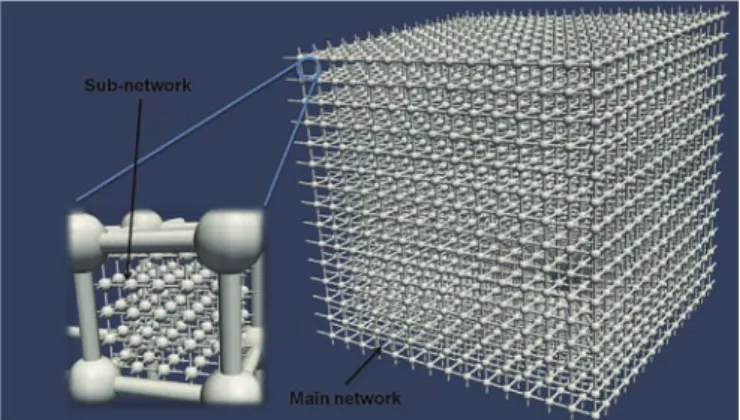
The PNM is based on using a network of pores and throats (links between adjacent pores) (Fig. 1) to represent the structure of a porous medium [10,11]. The pore network used in this work is constructed from spherical shape pores and cylindrical shape throats. The distance between two adjacent pores, i.e., network spacing, is constant. Thus, the pore network is regular. We use only 3D networks where every pore is connected to 6 adjacent pores (Fig. 1). The CL consists of agglomerated carbon/platinum particles. Two types of pores are considered: primary pores (d < 5 nm) representing pores inside agglomerates, and secondary pores (d > 5 nm) representing pores between agglomerates.
Secondary pores are represented by a 3D regular pore network with a network spacing equal to 150 nm. The value is chosen to be higher than the maximum pore diameter to avoid any overlap be-tween two adjacent pores. The size of the network is measured by a number of pores in x, y, and z directions. The size of the main pore network is 15 ' 15 ' 15, which is equivalent to 3375 pores and 10,800 throats. The size of the simulated domain is equivalent to
Fig. 1. Pore network representing the primary pores (sub-network in the left) and the secondary pores (main network in the right).
2.4 ' 2.4 ' 2.4
m
m which is large enough to capture the range ofpore sizes indicated by the PSD.
The primary pores are represented with 2744 sub-networks. Each sub-network is geometrically located in the cubic space be-tween 8 pores and 12 throats of the main network (Fig. 1) and represents the location of an agglomerate[11]. The pores located at the edges of sub-networks are connected to the adjacent throats of the main network. The size of the sub-network is chosen to represent the porous structure of an agglomerate with a diameter of w100 nm. However, the pores inside the agglomerates can be blocked by the ionomer when its loading increases, assuming that the ionomer is mainly distributed on the surface of the agglomer-ates[10]. To represent this blockage of primary pores by ionomer, the number of pores in the sub-network was varied from 5 ' 5 ' 5 to 1 ' 1 ' 1 so that only the accessible primary pores are repre-sented (Table 1). Experimentally obtained PSDs for different sam-ples are used to generate the porous structures in the pore network model,Fig. 2.
To simulate the nitrogen adsorption isotherms using con-structed pore networks, the relative pressure of nitrogen p/p0 is
increased gradually from 0 to 1 and then decreased following the same steps. The volume of the adsorbed nitrogen is calculated during adsorption (increase of p/p0) and desorption (decrease of p/
p0). At each step, the thickness of the adsorbed nitrogen is
calcu-lated as function of the relative pressure using Eq.(3).
The increase of tN2reduces the nitrogen-free diameter dfreeof
the pores and the throats. This diameter is expressed as follows:
dfree ¼ d 2tN2 (4)
where d is the geometrical diameter of the pore or the throat (at
tN2 ¼ 0 !A). As the relative pressure increases during adsorption
process, dfreedecreases.
The capillary condensation of nitrogen results in the complete filling of a pore with liquid nitrogen, dfree¼ 0. The process occurs
when the radius of the meniscus rm formed by the liquid/gas
interface is lower than a critical radius rcgiven by Kelvin equation:
rc ¼ 2gN2Vm
RTlnðp=p0Þ10
7ðnmÞ (5)
where
g
N2(N m 1) is the surface tension and Vm(m3mol 1) is themolar volume of liquid nitrogen. The radius of the meniscus de-pends on the diameter of the pores and on the shape of the meniscus itself. We suppose that the shape of the meniscus cur-vature changes from the adsorption process to the desorption process (seeFig. 3). The expressions of rmin the adsorption process
and the desorption process are given in the Eqs. (6a) and (6b), respectively: 2 rm ¼ 1 rþ 1 N0rm ¼ 2r ¼ dfree (6a) 2 rm ¼ 1 rþ 1 r0rm ¼ r ¼ dfree=2 (6b)
From Eqs.(6a) and (6b), the capillary condensation occurs at higher relative pressure during the adsorption process (dfree< rc)
than during the desorption process (dfree< 2rc). As a consequence a
hysteresis is obtained.
The model is based on HosheneKopelman algorithm[12]. The throats located at the boundaries of the main network are considered to be opened to the surroundings, where nitrogen is introduced. These throats are considered as starting points for the algorithm to investigate the networks and fill the pores and the throats with the correct amount of absorbed and liquid nitrogen using recursive functions.
For example, starting from a pore, the algorithm investigates one of the adjacent throats. If the capillary condensation occurs, this throat is considered as blocked (dfree¼ 0) and the second throat
is investigated. If the capillary condensation does not occur, the algorithm investigates the next pore and continues until it finds a pore or a throat that is blocked by condensed liquid N2. Then the
algorithm goes back and investigates the last pore or throat with
dfrees 0. The simulation continues until all possible pathways for nitrogen starting from the throats located on the boundaries of the main network are investigated. This process is repeated during all nitrogen adsorption and desorption steps. Additionally, the pore trapping phenomenon is considered in the simulation. This process occurs during desorption, when all pathways leading to pores in-side the structure are blocked with condensed liquid nitrogen resulting in inability of these pores to desorb nitrogen at a partial pressure prescribed by Kelvin equation.
Ideally, all pores larger than the molecular diameter of nitrogen (3.5 !A) can be detected by N2adsorption technique. The following Table 1
The composition of investigated samples and the corresponding sizes of sub-networks.
Sample composition Sub-network size Ketjen-Black (KB) 5 ' 5 ' 5 Pt/KB 4 ' 4 ' 4 Pt/KB þ 5% ionomer 3 ' 3 ' 3 Pt/KB þ 10% ionomer 2 ' 2 ' 2 Pt/KB þ 30% ionomer 1 ' 1 ' 1 Pt/KB þ 50% ionomer 0
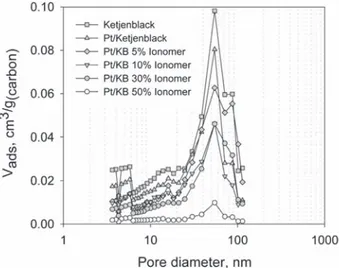
Fig. 2. Pore size distributions of different catalyst layer structures obtained by Sobo-leva et al.[6].
Fig. 3. Illustration of the meniscus shape (a) during the adsorption process, (b) during the desorption process.
adsorption regimes are distinguished during nitrogen adsorption. The physical adsorption in micropores[13,14](<2 nm) that occurs at very low gas partial pressures (<0.01 p/p0) is described by the
theory of micropore filling [15e17]. Adsorption in these pores occurs through volume filling, with the adsorption potential strongly enhanced by the overlap of adsorption forces from the opposite walls of the pore; i.e., neither mono-/multilayer adsorp-tion or capillary condensaadsorp-tion takes place. Concurrent with the filling of micropores, adsorption of monolayer of nitrogen mole-cules occurs on the pore walls of meso- and macropores (>2 nm) and on the external surface of a particle. Although it is difficult to distinguish between these concurrent processes, the consensus is that the steeper the rise in the adsorption isotherm at these very low partial pressures, the larger is the total volume of micropores
[18,19]. As the partial pressure is increased in the experiment, monolayer formation evolves into multilayer formation until the pore radius related to the capillary condensation at a given partial pressure is reached, instantly filling the pore. Thus, at medium and high partial pressures, two processes may be observed to occur simultaneously: multilayer formation and capillary condensation. At a partial pressure close to unity, either all pores are filled with nitrogen, and the isotherm reaches a plateau because the satura-tion point is reached, or multilayer formasatura-tion continues in mac-ropores (>100 nm) and no saturation point in the isotherm is observed.
By comparing the simulated and experimental adsorption iso-therms, the latter extracted from Soboleva et al.[6], we can assess the validity of representing the CL structure using a pore network model.
4. Results and discussion
The results obtained with the PNM are presented inFig. 4. In general, it is possible to distinguish three different regions in the adsorption isotherms. The effect of the PSD and in particular the amount of primary pores is evident from the low partial pressure section of adsorption isotherms (<0.05 p/p0) where the pore partial
filling process is occurring (no capillary condensation). At the values of relative pressure >0.05, the amount of adsorbed nitrogen increases almost linearly, which is consistent with the hypothesis of monolayer adsorption.
The second part of the isotherm (0.35 < p/p0< 0.7) corresponds
to the filling of the primary pores by capillary condensation. These
pores have smaller diameters (w5 nm) than the secondary pores and therefore they are filled first. The third part of the isotherm (0.7 < p/p0) corresponds mainly to the filling of the secondary pores
by capillary condensation. The amount of accumulated nitrogen increases faster in this part of the isotherm because the secondary pores are larger and therefore have a larger contribution to the porosity.
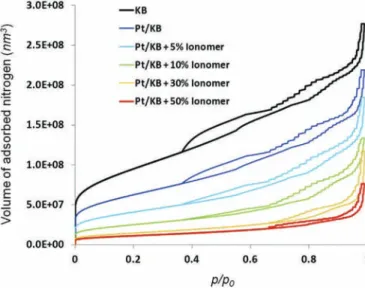
As it can be observed fromFig. 5, good agreement between the experimental and the simulation results is found. The model predicts well the position of the hysteresis. However, there are discrepancies in the shape of the isotherm between experimental and simulation results, especially in the case of Pt/KB 50% ionomer CL. In the simulation, the accumulated volume of the adsorbed nitrogen is much higher than experimental results. Thus, the model overestimates the total volume occupied by the pores of a given diameter. This overestimation is believed to be due to the assumption of the regular pore network, i.e., constant spacing between pores. In a microstructure model based on almost spherical particles, we can assume that the length of the throats (cylindrical shape pores) is nearly equal to their diameters. Hence, with the assumption of constant spacing (throat length) of 150 nm, the length of the small throats (e.g., 10 nm) may be overestimated, together with their volume. If the number of the small pores is relatively higher than the number of the large pores (with a diameter close to the network spacing) then over-estimation of the volume occupied by the small pores is not negligible. This phenomenon is observed in the case of flat PSDs, such as for Pt/KB 50% ionomer catalyst layer, where the volume occupied by each pore size class is similar. The case of Pt/KB 50% ionomer illustrates the limit of the regular pore network assumption, where the simulation results are drastically different from the experimental. For all other samples, the PSD is charac-terized by a distinctive peak at w50 nm; in this case the over-estimation of the volume occupied by the small pores is negligible compared to the total volume occupied by the large pores around the peak. In this case, representing the porous structure with a regular pore network is acceptable and validated by experimental results.
We observe inFig. 5that the total measured and calculated pore volume decreases when ionomer content in the catalyst layer is increased. In terms of PSD, the presence of the ionomer reduces the volume occupied by each pore size class, especially the primary pores with diameters around 5 nm (seeFig. 2). In the simulation, the primary pores, i.e., intra-agglomerate pores, are assumed to be blocked by the ionomer distributed on the surface of the agglom-erates. This assumption is modeled by reducing the number of the
accessible pores in the sub-networks (Table 1). The assumption leads to simulation results that are in good agreement with the experimental ones. Thus, we conclude that the simulation results confirm that the ionomer is distributed on the surface of agglom-erates rendering the intra-agglomerate pore space inaccessible to gaseous nitrogen.
From these findings, we conclude that the regular pore network comprising primary and secondary pore networks is acceptable to represent the microstructure of fuel cell catalyst layers. The assumption of a regular pore network is valid for PSDs that possess a distinct peak and is not applicable for flat PSDs where pore volumes of all pores are similar. Since realistic catalyst layers are represented by PSDs with a peak at a certain pore size, the assumption is then valid for most of conventional catalyst layer structures. Moreover, the described results validate the hy-pothesis that ionomer is distributed on the surface of the agglomerates.
Acknowledgment
The authors gratefully acknowledge partial funding from CEA, Grenoble, France, as well as the NRC-CEA collaboration program and Simon Fraser University. The CEA funding was received from the European Union’s Seventh Framework Programme (FP7/2007e 2013) for the Fuel Cells and Hydrogen Joint Technology Initiative under grant agreement n"[256798] (PEMICAN).
References
[1]M.H. Eikerling, K. Malek, Electrochemical Materials for PEM Fuel Cells: Insights from Physical Theory and Simulation in Modern Aspects of Electrochemistry, Springer-Verlag, New York, 2009, pp. 169e247.
[2]K. Malek, M. Eikerling, Q. Wang, T. Navessin, Z. Liu, J. Phys. Chem. C 111 (2007) 13627.
[3]K. Malek, T. Mashio, M. Eikerling, Electrocatalysis 2 (2011) 141e157. [4]A.A. Franco, in: C. Hartnig, C. Roth (Eds.), Polymer Electrolyte Membrane and
Direct Methanol Fuel Cell Technology (PEMFCs and DMFCs), Fundamentals and Performance, vol 1, Woodhead, Cambridge, UK, 2012.
[5]K. Malek, A.A. Franco, J. Phys. Chem. B 115 (2011) 8088.
[6]T. Soboleva, X. Zhao, K. Malek, Z. Xie, T. Navessin, S. Holdcroft, ACS Appl. Mater. Interfaces 2 (2010) 375e384.
[7]S. Brunauer, P.H. Emmett, E. Teller, J. Am. Chem. Soc. 60 (1938) 309e319. [8]M. Uchida, Y. Fukuoka, Y. Sugawara, N. Eda, A. Ohta, J. Electrochem. Soc. 143
(1996) 2245e2252.
[9]S.J. Gregg, K.S.W. Sing, Adsorption, Surface Area and Porosity, Acedemic Press, New York, 1982.
[10] M. El Hannach, J. Pauchet, M. Prat, Electrochim. Acta 56 (2011) 10796e10808. [11] M. El Hannach, M. Prat, J. Pauchet, Int. J. Hydrogen Energy 24 (2012) 18996e
19006.
[12] A. Al-Futaisi, T.W. Patzek, Phys. A 321 (2003) 665e678.
[13] K.S.W. Sing, D.H. Everett, R.A.W. Haul, L. Moscou, R.A. Pierotti, J. Rouquerol, T. Siemieniewska, Pure Appl. Chem. 57 (1985) 603e619.
[14] J. Rouquerol, D. Avnir, C.W. Fairbridge, D.H. Everett, J.H. Haynes, N. Pernicone, J.D.F. Ramsay, K.S.W. Sing, K.K. Unger, Pure Appl. Chem. 8 (1994) 1739e1758. [15] M. Kruk, M. Jaroniec, Chem. Mater. 13 (2001) 3169e3183.
[16] M.M. Dubinin, Carbon 25 (1987) 593e598.
[17] J. Choma, M. Jaroniec, J. Piotrowska, Carbon 26 (1988) 1e6.
[18] J.M. Thomas, Introduction to the Principles of Heterogeneous Catalysis, Aca-demic Press, New York, 1967.