Asteroseismological Studies of Long- and Short-Period Variable Subdwarf B Stars
par Suzanna Randali Département de physique Faculté des arts et des sciences
Thèse présentée à la Faculté des études supérieures en vue de l’obtention du grade de
Philosophiœ Doctor (Ph.D.) en physique
Novembre, 2005
Direction des bibliothèques
AVIS
L’auteur a autorisé l’Université de Montréal à reproduire et diffuser, en totalité ou en partie, par quelque moyen que ce soit et sur quelque support que ce soit, et exclusivement à des fins non lucratives d’enseignement et de recherche, des copies de ce mémoire ou de cette thèse.
L’auteur et les coauteurs le cas échéant conservent la propriété du droit d’auteur et des droits moraux qui protègent ce document. Ni la thèse ou le mémoire, ni des extraits substantiels de ce document, ne doivent être imprimés ou autrement reproduits sans l’autorisation de l’auteur.
Afin de se conformer à la Loi canadienne sur la protection des renséignements personnels, quelques formulaires secondaires, coordonnées ou signatures intégrées au texte ont pu être enlevés de ce document. Bien que cela ait pu affecter la pagination, il n’y a aucun contenu manquant. NOTICE
The author of this thesis or dissertation has granted a nonexclusive license allowing Université de Montréal to reproduce and publish the document, in part or in whole, and in any format, solely for noncommercial educational and research purposes.
The author and co-authors if applicable retain copyright ownership and moral rights in this document. Neither the whole thesis or dissertation, nor substantial extracts from ît, may be printed or otherwise reproduced without the author’s permission.
In compliance with the Canadian Privacy Act some supporting forms, contact information or signatures may have been removed from the document. While this may affect the document page count, it does flot represent any loss of content from the document.
Université de Montréal faculté des études supérieures
Cette thèse intitulée:
Asteroseismological Studies of Long- and Short-Period Variable SubdwarfB
Stars
présentée par:
Suzanna Randali
a été évaluée par un jury composé des personnes suivantes:
Pierre Bergeron, président-rapporteur Gilles Fontaine, directeur de recherche Pierre Brassard, membre du jury
Tony Lynas-Gray, examinateur externe
Thèse acceptée le:
Le principal but de cette thèse est d’établir les bases observationnelles et théoriques nécessaires à l’interprétation astéroséismologique des étoiles sous-naines de type B (sdB) va riant sur de longues périodes, qui n’ont été que récemment découvertes. La présente étude nous permet également d’améliorer notre connaissance des sdBs pulsantes de courtes périodes et de développer une méthode de vérification des analyses effectuées jusqu’à maintenant pour ces objets.
Après avoir décrit la classe des étoiles sous-naines chaudes et la théorie des pulsations, nous effectuons une analyse astéroséismologique de l’étoile pulsante de courtes périodes EC 20117—4014. Ensuite, nous explorons, d’une manière théorique, le potentiel que comporte la photométrie multi-filtre pour l’identification partielle des modes observés dans les deux types de variables sdB. Pour les pulsateurs rapides, les outils développés devraient être utiles pour vérifier l’identification des modes obtenus à partir de l’astéroséismologie, tandis que pour les oscillateurs lents, ils fourniront les contraintes requises pour entreprendre des analyses quantitatives. La partie restante de cette thèse est constituée d’une étude ambitieuse qui a pour but d’extraire et d’interpréter quantitativement les pulsations observées chez les sdBs variables de longues périodes. Notre analyse est fondée sur une moyenne de 350 heures de photométrie rapide obtenue pour chacune des trois cibles représentatives : PG 1627+017, PG 1338+481 et PG 0101+039. Si, d’une part, les propriétés oscillatoires de ces étoiles concordent bien avec les prévisions de façon relative, nous constatons qu’elles s’accordent mal à celles prédites par les modèles stellaires sur un plan absolu. En particulier, la valeur observée pour la limite bleue des étoiles pulsantes pourrait dépasser, jusqu’à un maximum de 8000 K, la valeur prédite, indiquant quelques inexactitudes dans les modèles utilisés présentement. D’autre part, il est
11
possible d’interpréter les distributions de périodes d’une façon quantitative pour deux des étoiles observées. Ces analyses indiquent que les modes sont, de préférence, excités dans des intervalles de fréquence bien précis, suggérant ainsi la présence d’un mécanisme de sélection d’énergie inconnu. La sous-abondance résultante des périodes observées comparées à celles prédites par les modèles, ajoutée au fait que les modes démontrent un comportement quasi-asymptotique, compliquent les analyses astéroséismologiques tentées. Néanmoins, les résultats obtenus se révèlent très prometteurs et, nous l’espérons, permettront éventuellement l’étude astéroséismologique complète des sous-naines de type 3 variables de longues périodes.
Mots clefs:
étoiles: intérieurs, étoiles: oscillations, étoiles: astéroséismologie, étoiles: branche horizontale, étoiles: individuelles: EC 20117—4014, étoiles: individuelles: PG 1627+017, étoiles: indivi duelles: PG 1338+481, étoiles: individuelles: PG 0101+039
The thesis presented here lays the observational and theoretical foundations for tue aste roseismological interpretation of the newly discovered class of long-period variable subdwarf B stars. In addition, we further our understanding of the short-period variable subdwarf B stars and develop a method of verifying the analyses achieved for these more extensively studied objects.
After summarising the status quo on hot subdwarfs and introducing basic pulsation theory,
we carry out an asteroseismological analysis of the rapid oscillator EC 20117—4014. We then
describe a theoretical exploration into the potential of multi-colour photometry for partial mode identification in both the short- and the long-period variables. In the case of the former, the tools developed should provide a means of verifying the mode identification inferred from asteroseisrnology for a number of objects, while for the latter they provide iiecessary a priori constraints. The remainder of the thesis is devoted to a pioneering study aimed at quantitati vely extracting and interpreting the oscillations exhibited by Iong-period variable subdwarf B stars. Our analysis is based on between 300 and 400 hours of time-series photometry obtained for each of three representative targets: PG 1627+017, PG 1338+481 and PG 0101+039. We find that their oscillatory properties are in agreement with predictions from non-adiabatic pulsation calculations at the relative but not the absolute level. In particular, the experimen tal blue edge of the instability strip exceeds that predicted by up to $000 K, indicating that the subdwarf B star models currently used are subject to deficiencies. Quantitative interpre tations of the period spectra uncovered were possible for two of the targets and indicate the preferential excitation of modes in well-defined frequency ranges, attributed to an unknown energy channelling mechanism. The ensuing underabundance of observed pulsations compared
iv
to those predicted together with the near-asymptotic behaviour of the modes greatly compli cates the asteroseismological exercises attempted. Nevertheless, the resuits achieved are very promising and will in ail likelihood pave the way for future studies of long-period variable subdwarf B stars.
$nbject headings:
stars: interiors, stars: oscillations, stars: asteroseismology, stars: horizontal-branch, stars: in dividual: EC 20117-4014, stars: individual: PG 1627+017, stars: individual: PG 1338+481, stars: individual: PG 0101+039
Sommaire j
Abstract iii
Table of Contents y
List of Figures vi
List of Tables vii
Acknowledgements vii
1 INTRODUCTION 1
1.1 INTRODUCTION TO SUBDWARF B STARS 1
1.1.1 What Are Subdwarf B Stars? 1
1.1.2 Why Are Subdwarf B Stars Worth Studying2 6
1.1.3 Subdwarf B Stars as Asteroseismic Probes $
1.2 THEORY 0F PULSATING SUBDWARFS 13
1.2.1 Basic Properties of Non-Radial Modes of Oscillation 13 1.2.2 Determining a Stellar Model’s Adiabatic Periods 17 1.2.3 Determining Pulsational Stability from Non-Adiabatic Calculations. 21
1.2.4 Pulsations in EC 14026 Stars 24
1.2.5 Pulsations in Betsy Stars 31
2.2 2.3 2.4 2.5 2.6 2.7 2.8 2.9 2.10 2.11
3 MULTI-COLOUR PHOTOMETRY FOR PULSATING 3.1 ABSTRACT
3.2 INTRODLrCTION 3.3 BASIC THEORY
3.4 MODEL ATMOSPHERES AND MONOCHROMATIC QUANTITIES vi 38 40 49 50 52 53 53 56 57 60 63 66 66 67 70 73 75 77 80 84 $7 TABLE 0F CONTENTS
1.3.1 Observational Goals and Techniques 1.3.2 Observations of EC 14026 Stars 1.3.3 Observations of Betsy Stars 1.4 MYPHDPROJECT
2 ANALYSIS 0F THE RAPIDLY PULSATING 5DB EC 20117-4014 2.1 ABSTRACT
INTRODUCTION EC 20117—4014 OBSERVATIONS
ANALYSIS 0F THE LIGHT CURVES
EVIDENCE FOR BINARY MOTION FROM FREQUENCY VARIATION ASTEROSEISMOLOGY
2.7.1 Initial Considerations 2.7.2 Methodology
2.7.3 Finding the Optimal Model for EC 20117—4014 2.7.4 Period Fit and Mode Identification
2.7.5 Structural Parameters of EC 20 117—4014 CONCLUSION TABLES REFERENCES FIGURES SDB STARS 98 99 100 103 114
3.5 NONADIABATIC EFFECTS IN REPRESENTATIVE MODELS 0F PULSATING SDB STARS
3.6 APPLICATION TO UBVRI PHOTOMETRY
3.6.1 Resuits for mir representative EC 14026 star model . 3.6.2 Resuits for our representative PG 1716 star model . 3.6.3 Resuits for other models: Dependence on Teff and 10g g 3.7 FEASIBILITY 0F APPLICATION TO MULTI-COLOUR DATA 3.8 CONCLUSION 3.9 TABLES 3.10 REFERENCES 3.11 FIGURES 116 120 121 122 125 128 130 134 139 143 4 ASTEROSEISMOLOGICAL STUDIES - I. PG 1627+017 4.1 ABSTRACT 4.2 INTRODUCTION 4.3 A MULTI-SITE CAMPAIGN 4.3.1 Initial Considerations 4.3.2 PG 1627±017 4.3.3 Observations 4.4 FREQUENCY ANALYSIS
4.4.1 The R hand Data: Extracting the Pulsations
4.4.2 The Multi-Colour Data: Determining the Relative Amplitudes 4.5 INTERPRETATION 0F THE RESULTS
4.5.1 A Brief Overview
4.5.2 Improved Static Models and their Pulsation Properties
4.5.3 Interpretation of the Observed Non-Uniform Period Distribution 4.5.4 Search for an Optimal Model in Parameter Space
4.6 CONCLUSION
4.7
TABLES 172 173 173 177 177 179 181 184 184 189 192 192 193 198 204 211 215 4.8 REFERENCES 219TABLE 0F CONTENTS viii
4.9 FIGURES 222
5 ASTEROSEISMOLOGICAL STUDIES - II. PG 1338+481 240
5.1 ABSTRACT 241
5.2 INTRODUCTION 241
5.3 OBSERVATIONS 245
5.3.1 PG 1338+481 245
5.3.2 Campaign Organisation and Outcome 246
5.4 FREQUENCY ANALYSIS 249
5.4.1 The R-hand data 249
5.4.2 The simultaneous U/R data 251
5.5 INTERPRETATION 0F TRE PERIOD SPECTRUM 254
5.5.1 Comparison with Non-Adiabatic Theory 254
5.5.2 Constraining Mode Identification from Multi-Colour Photometry . . . . 257 5.5.3 Quantitative Analysis of the Adiabatic Period Spectrum 260
5.6 ASTEROSEISMOLOGY 262
5.6.1 Background 262
5.6.2 Search in Parameter Space for an Optimal Model of PG 1338+481 . . . 265 5.6.3 Structural Parameters and Period Fit of the Optimal Model 272
5.7 CONCLUSION 275 5.8 TABLES 280 5.9 REFERENCES 287 5.10 FIGURES 290 6 MOST PHOTOMETRY 0F PG 0101+039 308 6.1 ABSTRACT 309 6.2 INTRODUCTION 309
6.3 OBSERVATIONS AND ANALYSIS 312
6.3.1 Spectra and Atmospheric Model Fit 312
6.4 MODELLING THE VARIATIONS 0F PG 0101+039 314 6.5 CONCLUSION 316 6.6 TABLES 319 6.7 REFERENCES 320 6.8 FIGURES 322 Z CONCLUSION 326 Bibliography 334 Appendices 344
1.4 1.5 1.6 1.7 1.8 1.9 1.10 1.11 1.12 1.13 1.14 1.15 1.16 1.17 1.18 1.19 1.20 12 13 15 16 25 27 29 30 34 35 37 41 44 45 46 47 49 2 4 10
List of Figures
1.1 Location of subdwarf B stars on the H-R diagram
1.2 Schematic of post-AGB, post-EAGB and AGB-Manqué evolution 1.3 Distribution of EC 14026 and constant stars in the log g— Teff plane
Light curves of EC 14026 and Betsy stars
Distribution of EC 14026 stars and Betsy stars in the log g —Teff plane $pherical Harmonics
Location of p- and g-modes in an sdB model Run of the work integral in EC 14026 stars Iron abundance profiles in EC 14026 stars Dependence of periods on Teff in EC 14026 stars Dependence of periods on 10g g in EC 14026 stars Betsy star instability strip
Driving/damping process in Betsy stars Propagation diagram for Betsy stars
Period ranges observed for EC 14026 stars compared to those predicted . . Fourier spectra for PG 1605+072
Fit of observed and predicted periods for PC 0014+067 Lightcurve of PC 1336—018
Lightcurve of KPD 1930+2752 Lightcurve of H$ 0702+6043
2.2 Fourier transform from one night for EC 20117—4014 8$ 2.3 Fourier transform of EC 20117—4014 from the SAAO data 89 2.4 fourier transform of EC 20117—4014 from the La Silla data 90 2.5 Observed and modelled Fourier spectra for EC 20117—4014 91
2.6 Frequency variation for EC 20117—4014 92
2.7 Suce of the
x2
function along the log g—Teff plane in the vicinity of the optimalmodel 93
2.8 Suce of the
x2
function along the M — logq(H) plane in the vicinity of theoptimal model 94
2.9 Slice of the “projected”
x2
function along the log g — Teff plane 95 2.10 Suce of the “projected”x2
function along the log g — Teff plane 96 2.11 Observed and theoretical period spectra for EC 20117—4014 973.1 Behavior of some key monochromatic quantities for our representative EC
14026 star model 143
3.2 Monochromatic amplitude ratios for our representative EC 14026 star model . 144 3.3 Monochromatic phase differences for our representative EC 14026 star model . 145 3.4 Behaviour of the radial component of the pressure eigenfunction for our repre
sentative EC 14026 star model 146
3.5 Behaviour of the radial component of the pressure eigenfunction for our repre
sentative PG 1716 star model 147
3.6 R values for our representative EC 14026 model 148
3.7 /r — ir values for our representative EC 14026 model
149 3.8 Fit to computed < R > and < b’p > values for our representative EC 14026
star model 150
3.9 R values for our representative PG 1716 model 151
3.10 ‘/‘T — ir values for our representative PG 1716 model
152 3.11 Fit to computed < R > and < ‘/- > values for our representative PG 1716
LIST 0F FIGURES xii
3.12 Relative importance of the temperature terms compared to the radius and surface gravity terms for our representative EC 14026 star model 154 3.13 Phase shifts for our representative EC 14026 star model 155 3.14 Amplitude ratios for our representative EC 14026 star model 156 3.15 Amplitude ratios for our EC 14026 star model displayed according to the degree
indices 157
3.16 Amplitude ratios for our EC 14026 star model setting T3 = O and 72 0 . . 158 3.17 Relative importance of the temperature terms compared to the radius and
surface gravity terms for our representative PG 1716 star model 159 3.18 Phase shifts for our representative PG 1716 star model 160 3.19 Amplitude ratios for our representative PG 1716 star model 161 3.20 Amplitude ratios for our PG 1716 star model displayed according to the degree
indices 162
3.21 Amplitude ratios for oui PC 1716 star model setting T3 = O and 72 = O . . 163 3.22 I to U amplitude ratio as a function of degree index 164 3.23 Variation of the I/U amplitude ratio with period for our representative PG
1716 model 165
3.24 Variation of the I — U phase difference with period for our representative PG
1716 model 166
3.25 Phase differences between oscillations in the I and U bandpasses for a sequence
of subdwarf B star models 167
3.26 I/U amplitude ratios for a sequence of subdwarf B star models 168 3.27 Behaviour of the I/U amplitude ratio with effective temperature for the EC
14026 and PC 1716 regime 169
3.28 Behaviour of the I/U amplitude ratio with surface gravity for the EC 14026
and PC 1716 regime 170
3.29 Fit to the pulsational amplitudes observed for the 182.4 s mode of KPD 2109+4401171
4.1 Light curves of PG 1627+017 222
4.3 Pre-whitening process for PG 1627+017 224 4.4 Quality of the frequency extraction for PG 1627+017 225 4.5 U/R light curves of PG 1627+017 obtained at Mt. Lemmon and Mt. Bigelow 226 4.6 U/R Fourier transforms from Mt. Lemmon and Mt. Bigelow 227 4.7 U/R light curves of PG 1627+017 obtained at MDM Kitt Peak 22$
4.8 U/R Fourier transforms from MDM Kitt Peak 229
4.9 Theoretical instability strip for PG 1627+017 230
4.10 Brunt-Visàlà frequency and Rosseland mean opacity for a sdB model 231
4.11 Period spacing for a PG 1627+017 model 232
4.12 Rotational splitting for PG 1627+017 233
4.13 Observed period spectrum of PG 1627+017 compared to that of a representa
tive model 234
4.14 Dependence of the period spectrum on logq(H) 235
4.15 Dependence of the period spectrum on M 236
4.16 Dependence of the period spectrum on 10g q(He) 237
4.17 Slice of the
x2
hypersurface optimising logq(He) at each point for PG 1627+017238 4.18 Slice of thex2
hypersurface at constant logq(He) for PG 1627+017 2395.1 U and R light curves of PG 1338+48 1 290
5.2 Comparison of Mt. Bigelow and MDM light curve for PG 1338+481 291 5.3 Pre-whitening of the R band Fourier transform for PG 1338+481 292 5.4 Pre-whitening of the simultaneous U/R Fourier transforms for PG 1338+481 . 293 5.5 Theoretical compared to observed PG 1716 star instability strip 294 5.6 Pulsational amplitudes of observed PG 1716 stars 295 5.7 Predicted and observed U/R amplitude ratios for PG 1338+481 296 5.8 Predicted and observed U— R phase differences for PG 1338+481 297
5.9 Period spectra for PG 1338+481 and PG 1627+017 298
5.10 Theoretical and observed periods for PG 1338+481 299
5.11 Dependence of theoretical periods on Teff 300
LIST 0F FIGURES xiv
Dependence of theoretical periods on
Dependence of theoretical periods on log q(H) Dependence of theoretical periods on 10g q(He)
x2
hypersurface in the M — logq(H) plane optimising logq(He)x2
hypersurface in the M — log q(H) plane at constant log q(Re)x2
hypersurface in the Teff — log g plane6.1 Model fit to the MMT spectrum of PG 0101+039 6.2 Lightcurve of PG 0101+039 obtained with MOST
6.3 Fourier transforms for PG 0101+039 and two comparison stars
6.4 Theoretical pulsation spectrum for a representative PG 0101+039 model 5.13 5.14 5.15 5.16 5.17 5.18 302 303 304 305 306 307 322 323 324 325
Observing 10g for EC 20117—4014 . Oscillations of EC 20117—4014
Possible orbital characteristics of EC 20117—4014 Mode identification for EC 20117—4014
Inferred properties of EC 20117—4014
3.1 Basic properties of our representative sdB models
3.2 Model atmosphere parameters for our reference EC 14026 star model 3.3 Model atmosphere parameters for our reference PG 1716 star model 3.4 Equilibrium models for a sequence of subdwarf B stars
3.5 Fit of predicted amplitudes to those observed for the 182.4-s mode 2109+4401
Campaign involvement for PG 1627+017 215
R hand photometry obtained for PG 1627+017 216
Simultaneous U/R hand data obtained for PG 1627+017 217 Oscillations detected in the light curve of PG 1627+017 217
Properties of the equilibrium models 218
Fit between the ‘optimaÏ” model and the observed periodicities for PG 1627+017218
Observations obtained for PG 1338±481 280
continued 281 R hand oscillations of PG 1338+481 282 2.1 2.2 2.3 2.4 2.5 80 81 81 82 83 134 135 136 137 of KPD 138 4.1 4.2 4.3 4.4 4.5 4.6 5.1 5.1 5.2
5.3 Simultaneous U/R oscillations of PG 1338+481 . 283
5.4 Basic properties of equilibrium models 284
5.5 Observational properties of the four well-studied PG 1716 stars 285 5.6 Period match for the optimal model for PG 1338+481 286
First and foremost thanks go to my supervisor Gilles Fontaine for everything, from taking me on because a student from England seemed exotic at the time to reassuring me that writing up a thesis is a mmd game for the best of us. I’d like to express my gratitude also for ail the things in between: taking me along for an amazing observing experience in Hawaii, stoically defying the antics of the Mt. Lemmon 60” telescope, actively encouraging me to make the most of conferences in every way, and understanding my compulsive and frequent need for holidays in far-away places. Last but by no means least, I am thallkful for the academic support and motivation I received during my time as a PhD student.
I also thank Pierre Brassard for developing and patiently teaching me how to use a number of programs, and coming to my technical rescue on more than one occasion. I am indebted to Betsy Green, who first discovered the Betsy stars and later showed me how to observe them. Further thanks go to the members of the “groupe dégénéré”, notably Patrick, Mathieu, Caroline, Alex, Agis, P.-O. and Jean-Philippe for advice, comments and lively discussions on subjects ranging from supermongo to vegetarianism. I would also like to thank my lovely flatmates Caroline and Tassia for unforgettable moments, deep psychological insights, and the extensive broadening of my Québecois vocabulary, not always in the most academic direction. Finally, my heartfelt appreciation to Stuart, who has been incredibly motivating and patient ail this time. For their long-term support, encouragement, and the good times spent together I am grateful to my family and friends, in particular Julla, Katrin, Dad, Chrissi, Sam, Ben, Dan and Jerry.
INTRODUCTION
1.1
INTRODUCTION TO SUBDWARF B STARS
1.1.1
What Are Subdwarf B Stars?
Subdwarf B (sdB) stars are evolved, low mass, compact objects, that lie on the Extreme Horizontal Branch (EHB) and post-EHB of the Hertzsprung-Russell diagram (Greenstein & Sargent 1974). They have effective temperatures between 22,000 and 42,000 K and high surface gravities in the 5.0 logg 6.2 range (Saffer et al. 1994). f irst discovered in the 1950’s (Humason & Zwicky 1947; Iriarte & Chavira 1957; Chavira, 1958; feige 1958), they were later spectroscopically classified as blue objects with anomalously broad Balmer unes, a consequence of their elevated surface gravity cornpared to main sequence stars (Greenstein 1960; Berger 1963; Greenstein 1966). The latter implies a comparatively small radius and a low 1uminosity, placing them between the main sequence and the white dwarf graveyard in terms of physical parameters.
The chemical composition of subdwarf B stars is characterised by a helium-burning core surrounded by a very thin hydrogen-rich envelope. The dominant nuclear process taking place in the core is the conversion of helium to carbon and oxygen via the triple-alpha chain. Due to the high temperature dependence (x T32) of the nuclear reaction rate, the hottest innermost regions of the star are subject to convection. Moving towards the surface and lower temperatures, the nuclear reaction rate decreases quickly, giving rise to first a thin
CHAPTER 1. INTRODUCTION 2
FIGURE 1.1 — Location of subdwarf B stars on the H-R diagram
semi-convection zone and then a radiative outer core composed almost entirely of helium. In contrast, the heavier end-products of nuclear burning, carbon and oxygen, are concentrated in the inner core. The hydrogen-rich sheil surrounding the core is thought to have a mass of between 0.0001 and 0.0050 solar masses, depending on the effective temperature of the star in question. Since the inert envelope acts as an isolator for the heat generated by the nuclear reactions in the core, sdBs with higher effective temperatures should be associated with thinner hydrogen shelis than their cooler counterparts (Dorman et al. 1993). Ail subdwarf B stars display chemically peculiar atmospheres made up of nearly pure hydrogen, helium typically being underabundant by more than one order of magnitude compared to solar. Heavy elements such as C, N and Si also show abundance anomalies that can be quite large (Heber 1991).
These are believed to be the resuit of diffusion processes, in particular gravitational settiing and radiative levitation, operating in competition with weak stellar winds (Michaud et al. 1985). It is thoiight that these processes resiilt in the formation of large inhomogeneities in the stars’ atmospheres, an important point that will be revisited below.
Subdwarf B stars correspond to an advanced phase of stellar evolution and are believed to be the immediate progenitors of low-mass white dwarfs (e.g. de Kool et al. 1993). There is however some debate as to their exact formation process, for which a number of theories have been proposed. The simplest of these is based on the idea that the (single) subdwarf B star progenitor experiences heavy mass loss near the tip of the flrst giant branch (FGB), at which the core attains the mass required for the helium flash (M - 0.48 M0; see e.g. Faulkner 1972;
Dorman et al. 1993; Castellani et aï. 1995; Dorman et al. 1996 for details on this evolutionary theory). Assuming that the red giant is stripped of a significant amount of mass but stops just short of losing its entire envelope, helium ignition can nevertheless occur and the star setties on to the hot end of the horizontal branch on the zero-age extreme horizontal branch. This core helium-burning phase is identifled with subdwarf B star evolution and ïasts around years. Due to the thinness of the hydrogen sheli the majority of the star’s luminosity originates from the nuclear reactions taking place in the core, and hydrogen sheli burning
is insignificant. After core helium exhaustion, the star has insufficient hydrogen energy to
force a supergiant style envelope and ascend the asymptotic giant branch (AGB). Instead, the ignition of the outer layers of helium leads to post-EHB evolution along the so-called “AGB-Manqué” track (Greggio and Renzini 1990) for a time comparable to the equivalent early AGB phase. The lielium-sheil biirning phase is identifled with siibdwarf O stars, which have temperatures around 45,000 K and surface gravities of 10g g 5.5. Finally, the star joins the white dwarf cooling track at Teff 80,000 K and collapses as a low-mass white dwarf (Bergeron et aï. 1994). This evoïutionary scenario produces single core helium burning EHB stars with tightly constrained total masses of around 0.4$ M0 and helium envelope masses
Menv < 0.02 M®. Historically, the main problem with the theory has been the necessity of
“flne-tuning” the mass loss in order to produce subdwarf B stars, however recent simulations have shown that the significant mass loss occurring in the red giant phase may well ïead to
CHAPTER 1. INTRODUCTION 4
extreme horizontal branch evolution quite naturally (D’Cruz et al. 1996, Sweigart 1997).
FIGuRE 1.2 — Schematic representation of post-AGB, post-EAGB and EHB evolution. In the ftrst case, the sdB progenitor has sufficient envelope mass (Menv 0.02 M®) to follow the classical AGB and post-AGB (P-AGB) track. In the remaining two cases, the hydrogen sheli
is too thin (Menu 0.02 M0) for thermal pulsing to take place at the tip of the AGB; the star thus setties on the EHB. If the envelope mass is sufficiently high, the star is able to develop a convective envelope, placing it on the AGB for a whule. However, envelope convection cannot be sustained until the tip of the AGB, and the star instead follows the P-EAGB (“Post-Early AGB”) track to the white dwarf cooling sequence. If the hydrogen envelope is particularly thin, the star becomes a subdwarf and spends its post-EHB evolution in the AGB-Manqué phase. From Dorman et al. (1993).
Another evolutionary channel potentially capable of producing single subdwarf B stars is the merger of two helium white dwarfs in a close binary. In this scenario, the two primaries are driven together by orbital angular momentum loss due to gravitational wave radiation, and the merged object ignites helium to produce an fR3 star (Webbink 1984; Iben & Tutukov
1986; Han 1998). According to simulations by Han et al. (2002), subdwarfs formed on the
basis of two white dwarfs will have a relatively wide mass distribution (0.4—0.65 M®) peaked at 0.51 M0. Their envelope masses are expected to be extremely thin, since any residual
hydrogen present in the white dwarfs’ atmospheres will 5e buried deep within the star and mixed with hellum during the merger process, thus igniting violently aud being consumed quickly. The birth rates calculated indicate that a significant fraction of sdB stars may form
P-AG8
î
>, 0 o E -J Temperaturethis way, which could help explain some of the observed sd3 stars that appear to be more massive than 0.5 M®, provided that these are single objects.
The recent identification of many subdwarf B stars as both short- and long-period binaries (e.g. Allard et al. 1994; Maxted et al. 2001) raised the need for evolutionary scenarios that were able to produce sdBs with companions. Such systems start out as close binaries in which the red giant primary loses most of its envelope to the secondary star through mass transfer before igniting helium and settling on the EHB. While this idea had first been proposed by Mengel, Norris, & Gross (1976), their treatment was not complete from a binary evolution point of view since it did not distinguish between dynamically stable and unstable mass transfer (Le. Roche lobe overfiow vs. common envelope phase). The creation of binary subdwarfs was thus re-examined in detail by Han et al. (2002; see also Han et al. 2003), who proposed two distinct formation channels giving rise to sdB binary systems with different orbital characteristics. In both cases. the subdwarf’s red giant progenitor starts to fili its Roche lobe when it is relatively close to the tip of the first red giant branch. If the radius of the rnass-losing star increases more quickly than its Roche lobe, mass transfer will be dynamically unstable and lead to the formation of a common envelope where the envelope of the red giant engulfs both its degenerate core and the compaiiion star. Friction between the orbiting components will then cause them to loose angular momentum and spiral in towards each other. Assuming this releases enough energy for the common envelope to be ejected, we are left with a very close binary system containing a helium core stripped of most of its hydrogen. The latter may stili ignite helium if it was close enough to the red giant tip before the mass transfer, and thus evolve into a subdwarf B star. In the second scenario, mass transfer is dynamically stable aiid occurs via Roche lobe overflow, stopping when the primary’s radius (and hydrogen envelope) has decreased sufficiently. If the degeiierate core mass is large enough, helium will ignite, producing a subdwarf B star in a fairly wide binary. Both the common envelope ejection (CE) channel and the Roche lobe overflow (RLOF) channel can be divided into sub-channels depending on the nature of the binary companion. If the latter is a main sequence star, the CE channel is most likely to form sdB stars with a mass distribution sharply peaked at around 0.46 M0 and short binary periods between 0.05 d and 40 d. In comparison, CE ejection
CHAPTER1. INTRODUCTION 6
with a white dwarf companion typically yields lower mass subdwarfs (M 0.35 M®) and a slightly wider distribution of orbital periods. The creation of a subdwarf via the RLOF channel is much more likely on the basis of a main sequence rather than a white dwarf companion, since the secondary must be relatively massive for stable RLOF to occur. Subdwarfs produced in this scenario can have masses ina very wide range between 0.33 and 1.1 M®, although the more massive sdBs are unlikely and the mass distribution again peaks sharply at around 0.46
Y.
While ail four of the evolutionary scenarios detailed present plausible explanations for the existence of subdwarf B stars, the different theories have yet to be tested observationally. It would be particularly interesting to examine which combinations of the stellar mass, the thickness of the hydrogen envelope and the binary characteristics occur in nature, and whether these are in accordance with those predicted from the formation channels. This would lead to n more mature understanding of the creation of subdwarf B stars, one of the last great mysteries in stellar evolution theory.
1.1.2
Why Are Subdwarf B Stars Worth Studying?
Subdwarf B stars are cnrrently a hot research topic in stellar astronomy. Many specialists in the field of evolved stars have recently directed their attention towards these small, seemingly insignificant objects and the summer of 2003 saw the first of a series of conferences devoted solely to EHB stars. But what makes sd3’s so special and worth studying?
One of the reasons subdwarf B stars are important is their sheer abundance. Shallow pho tographic surveys such as the Palomar-Green (Villeneuve et al. 1995), Montreal-Cambridge Tololo (Lamontagne et al. 2000) and Edinburgh-Cape (Stobie et al. 1995) survey have shown that they dominate the Galactic population of blue objects more luminous than l6th magni tude in the visible. The Palomar-Green survey alone found over 300 sdB stars with magnitudes brighter than V 14.3. A kinematical analysis of a sample of 110 subdwarf B stars (Altman et al. 2001) revealed that the majority belong to our Galaxy’s disc and the halo population forms a minority. This means that the kinematical history of sdBs is different from that of cooler A-type horizontal branch (HBA) stars, which rnainly occur in the halo. In fact, when
corisidering sdB, 1133 and HBA stars, their spatial behaviour seems to be related to their location on the horizontal branch. The bluer species are normally not found in the halo, the redder ones preferably there. A better understanding of horizontal branch and extreme hori zontal branch stars could perhaps shed some light on this and provide us with a firmer grasp on the structure and evolution of our Galaxy.
$ubdwarf B stars are also useful for constraining the ages of the oldest galaxies and hence cosmological models. Giant elliptical galaxies have been observed to exhibit an increasingifllx with decreasing wavelength in the ultra-violet (1000—2500
À),
thought to be largely due to the radiation of HB and EHB stars (e.g. Yi, Demarque 8 Oemler 1997). This so-called “UV upturn” can be used as an age indicator for the galaxy using population synthesis models, providing that certain input parameters are known (Yi et al. 1999). Que of the most important of these is the metallicity of the dominant UV sources, since the “metal-poor HB hypothesis” and the “metal-rich 113 hypothesis” predict significantly different ages for the same nearby elliptical galaxies. In the former scenario, giant ellipticals are similar in age or even younger than old Galactic globular clusters, while in the latter they are about 30 % older than the old halo populations in the Milky Way. The inferred age further depends on the mass loss of the 113 and EHB stars; if the mass-loss efficiency correlates positively with metallicity, nearby giant ellipticals may only be 60—70 % as old as our Galaxy. Therefore, placing constraints on the structure and evolution of 113 and EHB stars is imperative to the precise determination of these galaxies’ ages.Perhaps the most important reason for studyillg subdwarf B stars is their intrinsic interest as exotic objects because of their extremely thin hydrogen shell. As vas discussed in the previous section, we do not yet flllly understand their formation process, in particular the details surrounding the mass loss near the tip of the first red giant branch. While this in its own right warrants the doser investigation of sdB’s, the information gained from any such study has wide-ranging implications for stellar and binary evolution scenarios. Effectively constituting the bare helium core remuant of red giants, subdwarf B stars ca be used as laboratories to test theories of core he-burning and post-red giant evolution. This reuders them of fundamental iuterest to stellar astrophysics as well as the understanding of nuclear
CHAPTER1. INTRODUCTION 8
reaction processes.
1.1.3 Subdwarf B Stars as Asteroseismic Probes
The popularity of subdwarf B stars received a sudden boost when it was discovered that some of them show multi-periodic brightness variations, also kilowil as pulsations or oscilla tions. As variable stars, sdBs join the likes of classical Cepheids, RR Lyrae, 5 Scuti or ZZ Ceti white dwarfs, to name only a few. In the simplest case (that of radial pulsations), the bright ness variations observed from Earth are caused by the regular expansion and contraction of the star, similar to that of the human lung as air is inhaled and exhaled. The timescale on which this occurs depends on the physical parameters of the star, such as its mass, radius and internal composition. Therefore, oscillations can be used to probe the stellar interior, much in the same way as seismic waves are employed to infer the muer structure of the Earth. This field of study is called asteroseismology, and is thought to hold the key to a more ma ture understanding of subdwarf B stars. In particular, it is hoped that asteroseismology can constrain the thickness of these stars’ hydrogen shells and the extent of their convective core, parameters which cannot be deduced any other way but are of paramount importance for evolutionary scenarios.
Short-period Variable Subdwarf B Stars (EC 14026 Stars)
The first class of pulsating subdwarf B star vas discovered at the South African Astro nomical Observatory only relatively recently (Kilkenny et al. 1997; see also Koen et al. 1997; O’Donoghue et al. 1997; Stobie et al. 1997). Named EC 14026 stars after the prototype, these oscillators exhibit multi-periodic luminosity variations with short periods between 80—500 s and low amplitudes of a few mmags (typical amplitudes lie below 5—10 mmags, however amplitudes as high as 60 mrnags have been detected in certain objects). They correspond to the hotter and more compact sdB stars at 28,000 K Teff 37,000 K and 5.25 logg 6.00.
Interestingly, short-period variations in subdwarf B stars were predicted nearly simulta neously to their discovery by an independent group here in Montréal (Charpinet et al. 1996),
an extremely rare occurrence in stellar pulsation study. It is believed that the oscillations in EC 14026 stars are caused by an opacity mechanism associated with a local overabundance of iron (see section 1.2.4), and that a good understanding of the driving process has been reached. Indeed, ail 34 EC 14026 stars detected to date fail into the instability strip predicted by theory (see Charpinet et al. 2001 for a review). Moreover, it has been possible to quantita tively match the periods of oscillation observed to those predicted for four targets (see section 1.3), allowing the tools of asteroseismoiogy to be applied. Since the oscillations in EC 14026 stars are sensitive mostly to the structure of the outer layers, this resulted in the accurate determination of the hydrogen sheli thickness as well as the total mass. The values derived so far indicate the correlation between the envelope mass and effective temperature predicted from theory, as well as the expected stellar masses around 0.46—0.48 M® (Charpinet et al. 2005). Whiie it is too early to speak of definite constraints on sdB formation theories, it is clear that the study of EC 14026 stars is beginning to bear fruit from an evolutionary point of view.
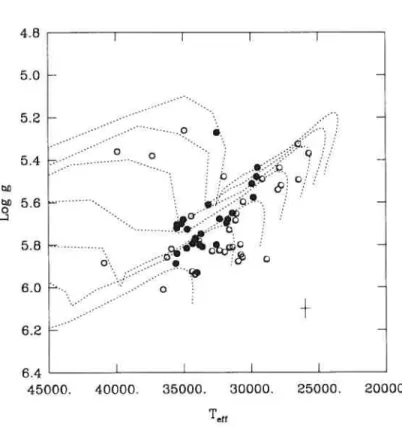
Despite the success of pulsation theory in explaining the fast pulsators’ observed properties, certain challenges remain. One of these is the fact that short-period variable subdwarf B stars co-exist in the same region of the H-R diagram as their non-pulsating counterparts (see Figure 1.3), when according to predictions all stars in the instability strip should pulsate. Although the reason for this is still open to debate, a currently favoured theory (Fontaine Chayer 1997; Chayer et al. 2004) proposes that weak stellar winds could be to blame. It is suggested that these would, over time, empty out the iron reservoir in the envelope layers of the star and cause the opacity mechanism driving the oscillations to cease. In this scenario, non pulsating subdwarf B stars would either suifer a higher mass loss rate than the oscillators, or be significantly older. Evolutionary calculations have shown that stars with similar values of Teff and log g can have different ages depending on the mass of the stellar coTe, that of its envelope, its helium abundance and metallicity (e.g. Dorman et al. 1993). Furthermore, exploratory modelling (Fontaine et al. 2005) of a weak stellar wind’s effect on the iron abundance profile in sdB envelopes found that a depletion does occur in the layers critical to driving within the He-core burning timescale. Unfortunately from an observationai point of view the iron
CHAPTER 1. INTRODUCTION 10 4.8 5.0 5.2 5.4 0 5.6 5.8 6.0 6.2
FIGURE 1.3 — Distribution of EC 14026 stars (fihled black circles) and constant sdB stars (open circles) in the 10g g — Teff plane. The spectroscopic estimates of the stars’ atmospheric parameters are those 0f Green, Fontaine, & Chayer (in preparation), typical uncertainties on which are indicated by the cross. Also shown are sorne of Ben Dorrnan’s evolutionary tracks for models with a range of hydrogen sheil masses (dotted unes). From Fontaine et al. (2005).
abundance decreases in the driving region before any significant change registers at the stellar surface. Therefore, it is quite possible that two targets with the same atrnospheric metallicity experience very different conditions in the layers contributing to pulsational instability, causing one of them to oscillate while the other does flot. This may help explain recent negative resuits reported from searches for a spectroscopic signature of pulsating subdwarf B stars (e.g. Blanchette et al. 2005).
Long-Period Variable Subdwarf B Stars (PG 1716 Stars or Betsy Stars)
Just as the subdwarf B community felt that they were beginning to achieve an unders tanding of the pulsations inthe EC 14026 stars, Betsy Green announced the discovery of yet another class of pulsating subdwarfB star (Green et al. 2003). The new oscillators appear to
6.4
45000. 40000. 35000. 30000. 25000. 20000. Tett
be multi-mode pulsators with long periods of the order of one to two hours and very small pulsational amplitudes of 5 mmags. Commonly referred to as PG 1716 stars after the pro totype PG 1716+426, some of the Montréal group prefer to cali them “Betsy stars” in honour of their discoverer. I will use this name throughout the non-article part of my thesis.
The reason it took five years to discover the Betsy stars, despite the search for pulsating sdBs being on since the discovery of the EC 14026 prototype, is that their periods are a factor of ten longer, and their amplitudes of pulsation are generally lower than in the case of the EC 14026 stars. When testing a subdwarf for pulsations it was usually declared constant if no relative amplitude variations greater than 0.05 ¾ were detected on a timescale of 1-2 hours (see Billères et al. 2002), which automatically led to an oversight of the slow pulsators. They were eventually discovered in the course of an sdB monitoring campaigu searching for reflection effects and eclipses in close binary systems, features of a similar timescale and amplitude level as the pulsations uncovered. In order to illustrate the challenges faced in the search for Betsy stars compared to the EC 14026 stars, Figure 1.4 shows typical light curves for these two types of object on the same amplitude scale.
In addition to their differing pulsation properties, the two classes of subdwarf B pulsators can also be distinguished by their atmospheric parameters, the typical Betsy star being dis tinctly cooler and less compact (Teif 27,000 K; logg 5.4) than the average EC 14026 star (Teif 33,000 K; logg 5.7, see Figure 1.5 for details). However, their domains ofinstability seem to touch, as was confirmed by the detection of two hybrid objects that exhibit both long- and short-period luminosity variations ($chuh et al. 2005; Oreiro et al. 2005). While it is difficult to establish a precise temperature scale towards the cooler end of the subdwarf B star domain, Betsy stars can be described as lying between roughly 20,000 and 29,000 K. It is believed that, as a result of their lower temperatures, the outer hydrogen sheil is thicker than in the rapid pulsators, extending to 0.003 - 0.004 M® in the coolest objects. Another noteworthy fact is that the slow oscillators are surprisingly common. Whereas less than 5
¾
of subdwarf B stars are identified with the rapid pulsators, Betsy stars make up 25-30 % of the sdB population, and it is indeed possible that ail cool subdwarfs are slowly oscillating at some amplitude level.
CHAPTER1. INTRODUCTION 12 25.0 P—MODE PULSATORS 15.0 50 —5.0 . ... ... ... .•....••.•... —15.0 .-... .: .. _._. ..——..._../_•
G—MODE PULSATORS lIME AXIS COMPRESSED BY A FACTOR 2
—25.0— I I
0. 1000. 2000. 3000. 4000. 5000. 6000.
Tïme (seconds)
FIGURE 1.4 — Representative light curves of short-period and long-period variable subdwarf B stars. Note that the tirne-axis refers to the top haif of the figure; the light curves in the bot tom haif have been compressed by a factor of 2. From Fontaine et al. (2003).
The rnost obvious challenge following the surprising discovery of these new variables was explaining their instability. Following several unfruitful attempts, Fontaine et aI. (2003) suc ceeded in computationally exciting bands of periods in a range comparable to those observed by invoking the same iron opacity mechanism responsible for the EC 14026 instability region (see section 1.2.5). In contrast to the case of the fast pulsators. the oscillations observed in the Betsy stars are sensitive to the muer layers, and thus have the potential to constrain the extent of the convective core. However, our understanding of the slow pulsators is stili relatively limited, and it remains to be seen whether asteroseismology will be possible in the
FIGuRE 1.5 — Distribution of 26 EC 14026 stars (fihled black circles) and 30 Betsy stars (open circles) on the H-R diagram. The two circled black points refer to hybrid objects that exhibit both short- and long-period variations. Shown are all pulsators for which we have consistent atmospheric paraineters derived from MMT spectra. The thin dotted unes show some of Ben Dorman’s evolutionary tracks for models with a range of H envelope masses. The thick dotted hue represents the zero-age He-burning main sequence for masses between 0.3—0.6 M®. Froni Fontaine et al. (2005).
future.
1.2
THEORY 0F PULSATING SUBDWARFS
1.2.1
Basic Properties of Non-Radial Modes of Oscillation
The oscillations found in subdwarf B stars are non-radial. which by definition means that during a pulsation cycle the star deviates from its spherical shape rather than oscillating around its equilibrium figure as is the case for radial pulsations. However, it should be noted that in subdwarf B stars the pulsations manifest themselves not so much in the physical
4.8 -5.0 -I I I I 5.2 -5.4 5.6 5.8 6.0 6.2 o
+
6.4 — 45000. 40000. 35000. 30000. 25000. Tetr 20000.CHAPTER 1. INTRODUCTION 14
give rise to the observed luminosity variations. The reason for this is that the stars’ high
surface gravity hinders any appreciable radial outward displacement, instead directing the available energy into heating the corresponding region.
Non-radial oscillations are conventionally described by three spherical harmonic coordi nates, k, t and m. The radial order k corresponds to the sheil number n in quantum physics,
and in a stellar oscillation model represents the number of nodes in the radial component of the dispiacement from the centre to the surface. The harmonic degree t refers to the number of nodal unes that divide the stellar surface into regions oscillating in opposite phase to each other, while the azimuthal quantum number m (where m —t, —t + 1,...,t — 1, t) corres
ponds to the number of those that cross the equator. The effects of changing t and m on
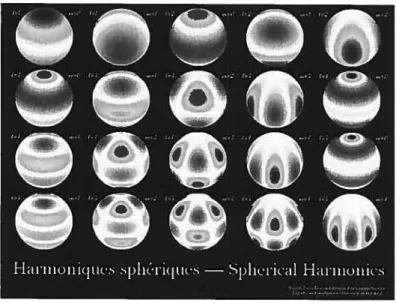
the surface of a stellar model are illustrated in Figure 1.6. Radial modes (not illustrated) are nothing more than special cases of non-radial modes, namely those with t = O. It is evident from Figure 1.6 that the value of t plays a critical part in the amplitude of the brightness variation as observed from Earth. Since stellar disks (with the exception of that of the Sun) are generally not resolvable and we can thus not make out the spherical harmonic patterns as depicted in Figure 1.6, all we see is the brightness variation of the integrated disk. Assuming the same intrinsic amplitude, it is obvious that the overall brightness variation of the visible disk during a pulsational cycle will decrease as the value of t increases. It is for this reason that observations claiming to have detected modes with t 3 are received with scepticism.
In a given spherical equilibrium model, a mode’s eigenfrequency u is a function of k and
t, while both the frequency and the eigenfunction are independent ofni, exhibiting a (2t +
1)-fold degeneracy. This degeneracy is due to the symmetry of the equilibrium structure around an arbitrary axis and can hence be lifted by introducing rotation, resulting, to first order, in equally spaced frequency splittings corresponding to the rotational frequency. Therefore, analysing the frequency spectrum of an oscillating star not only yields information on the pulsations themselves but can also render the star’s rotational period.
Non-radial pulsations can be divided into two distinct types owing to the existence of two restoring forces, pressure and gravity. They occupy different period domains, which are divided by two characteristic frequencies describing the local vibrational property of the star.
The first of these is called the Lamb frequency and corresponds to the reciprocal of the time scale of one horizontal wavelength divided by the loca.l sound speed. The latter quantity is given by c2 = (d in P/dlnP)ad(P0/P0) where P0 and Po are the pressure and density of the unperturbed state respectively. The horizontal wavelength can 5e expressed in terms of the horizontal wave number kh [1(1 + 1)]1/2/r — t/r, yielding ‘\h = 2?T/kh 2irr/t. Since this wavelength is travelled horizontally by a sound wave in a period Àh/27rc, the Lamb frequency is given by
L = (k,c)2
= 1(1 +1)c2
(1.1)
The second characteristic frequency describes the vertical oscillation of a bubble of gas around its equilibrium position under gravity and is called the Brunt-Vàisàlà frequency (N2). It can be expressed as 2
t
1 dlnP0 dlnp0 N = g dr — dr)
(1.2) \d1np)dwhere g is the local gravitational acceleration.
In the case of high-frequency oscillations where 2 > L, N2, the relative radial displace ment is dominated by the relative Eulerian pressure perturbation, implying that the restoring FIGURE 1.6 — Illustration of spherical harrnonics in a spherical stellar model. The dark and light coloured regions refer to areas of maximum temperature variation (i.e. hot and cold patches) and those where the temperature stays at its equilibrium value (i.e. nodal lines) respectively. From Pierre Brassard (private communication).
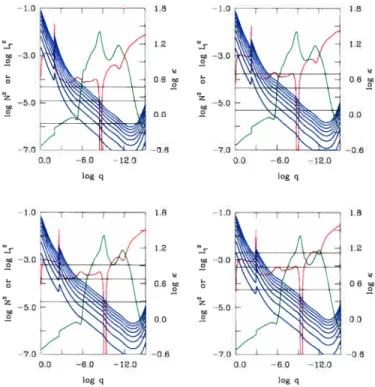
CHAPTER1. INTRODUCTION 16 -ogL logN2 3 —4 —10 log q
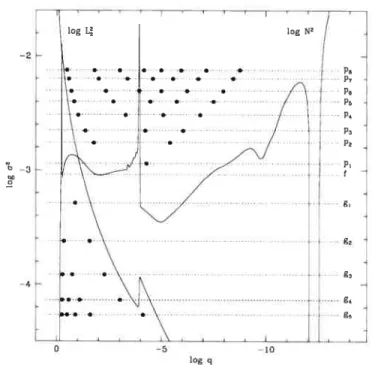
FIGURE 1.7 — Propagation diagram for a representative subdwarf B model illustrating the regions of propagation for p- and g-modes as a function of logarithmic depth log q log (1 — M(r)/M), where M(r) is the stellar mass within a spherical volume of radius r and M is the total mass of the star. Note that in this notation log q = O corresponds to the centre of the star and the surface lies at 10g q - 15. The eigenfrequencies 2 of the p-modes are shown up to k = 8 (p8), while those of the g-modes are given up to k = 5 (g5). The fundamental mode, as well as the Lamb and Brunt-Vàisàlà ftequency are also indicated. Each black point refers to a node of the mode’s eigenfunction. From Charpinet (1998).
force is caused mostly by excess pressure. The high-frequency modes are consequently named p-modes and show the characteristics of acoustic waves, such as a decrease in period as the radial order k increases. It can be seen from Figure 1.7 that p-modes propagate mostly in the outer layers of the star (note the logarithmic depth scale), and thus constitute shallow envelope modes. For low-frequency perturbations with u2 < L?, N2 the restoring force is mainly due to buoyancy. These oscillations behave like gravity waves (such as those found in the oceans), in that their period increases with k and are thus called g-modes. In contrast to the p-modes, their nodes are confined to the inner regions of the star; they thus probe deep within the stellar interior. In between the two frequency domains (i.e. for > 2 > N or
L? <u2 < N) is an evanescent zone where the eigenfunction exponentially decays with the distance from the wave propagation region. This region acts as a “tunnel” that, if it is thick
g g
;:::;:::::
o —o - g, g, genough, completely separates the p- and g-modes, leaving them trapped in the star’s P or G zone respectively. Between the P and G domains is the so-called fundamental mode (f-mode), which lias a hybrid status and exhibits both p- and g-mode characteristics.
1.2.2
Determining a Stellar Model’s Adiabatic Periods
In this section,
I
will give a very brief overview of how the pulsational periods characteristic of a
given stellar modelare
obtained. This is meant to provide the reader with some basic understanding of the concepts involved; it does by no means constitute an exhaustive mathe matical treatment of pulsation theory. More details can be found in the textbook Nonradiat Pulsations of Stars by Unno et al. (1989) as well as in Theory of Stettar Pulsations by Cox (1980).A star can be described as a closed system governed by thermodynamic and fluid dynamic laws. Neglecting complicating factors such as rotation, convection and the effects of a magnetic field, the system can 5e fully described by the following six equations:
mass conservation
+ (p) = 0, (1.3)
energy conservation
PT(+V)5PfNV.FR (1.4)
the Navier-Stokes relation (Newtonian fiuid mechanics)
(1.5)
Poisson’s equation (which describes the distribution of matter in a gravitational field)
= 4irGp, (1.6)
the equation of state, which normally takes a numerical form, and the equation of energy transfer. In an optically thick medium (such as the stellar interior) we can make the assumption
CHAPTER 1. INTRODUCTION 18
that energy is transferred by diffusion and write
where K=T. (1.7)
3tp
The symbols used in these equations have their conventional meaning as follows: p is the density, T is the temperature, S is the entropy, P is the pressure, cpr is the nuclear energy
production rate, FR is the radiative flux, ‘F is the gravitational poteutial, ft is the velocity vector of the fluid, and K i5 the opacity.
If the star is in hydrostatic equilibrinm (i.e. not pulsating), its structural quantities are time-independent and ail time derivatives as well as the velocity vector can be set to zero. The equation of mass conservation then annihilates, while the remaining four analytical expressions can be written as
PoEN,oVFo0 (L8)
—VPO — Po’o = (1.9)
— 4-ïrGpo = 0 (1.10)
(1.11)
where the subscript “0” indicates an unperturbed vaine. Things can be further simplifled by replacing the parameter gradients by simple derivatives with respect to the distance from the steliar center r in the approximation of spherical symmetry, yieiding
4nr2pe where L = 4nr2FR (1.12) dP -. d CM —=—pg where g=V=—=——— (L13) dr dr r’ = 4ïrr2p (1.14) dT 3np L 115 dr — 4acT3 4nr2
(
of layers characterised by T, when an unperturbed stellar model is calculated. The resulting physical quantities and their local dependence on T are subsequently used in the computation of the model’s pulsational properties.
Since stellar oscillations rarely reach large amplitudes compared to the overall structure of the star, they can be treated as small perturbations to its equilibrium state. These pertur bations can be described mathematically in two ways. In the Eulerian formalism the point of reference is fixed to a physical location at which the parameters of stellar structure change during a pulsation cycle. The time-dependence of a given quantity
f
can then be expressed asf(i t) = fo() +
f’(,
t), (1.16)where fo( is the unperturbed value off at a location and
f’(,
t) is its Eulerian perturbation at time t. In contrast, the Lagrangian approach monitors the physical displacement of a given fiuid element characterised by a particular value off,
yieldingf(t) =fo(r)+6f(i,t). (1.17)
Here, TJ is the equilibrium position of the element and is its perturbed location. As the latter is time-dependent, it is useful to introduce the Lagrangian displacement vector 6=
The perturbations are introduced into the previously static system by replacing each of the structural quantities in equations 1.3—1.6 by their time-dependent equivalent in either the Eulerian or Lagrangian formalism (equation 1.16 or 1.17). Since the perturbations are assumed to be small, only the first order terms in
f’
and6f
are kept by (linearisation). Terms consisting of unperturbed quantities only can be eliminated by applying the condition of hy drostatic equilibrium (equations 1.8—1.11), leaving a set of linear differential equations with the perturbed quantities as variables. Their coefficients are functions of the non-perturbed quantities, which depend only on the radial coordinateT, and are calculated during the modelbuilding process. The perturbed quantities on the other hand depend on the three spherical coordinates T (the radial coordinate already introduced), & (the angular altitude, correspon
CHAPTER1. INTRODUCTION 20
as well as on the time t. Consequently. a given perturbed quantity f’(r,O,,t) can be ex
pressed in terms of a product of functions, each depending on only one or two coordinates (separation of variables). Individual solutions to the set of linear differential equations (also caÏÏed the eigenmodes of the system) then take the form
fL,t,m(T,8,,t) = J,t(r)Y(8,)eit or fklm(T,,b, t) fkt(r)Yfl(8,b)e1t
(1.1$)
in the Eulerian and Lagrangian formalism respectively. Here, kt is an eigenftequency of the system, f1(T) or fkt(r) is the corresponding eigenfunction, and Y4(O,
)
is the (numerically known) spherical harmonic associated with the geometry of an t, m oscillation (see previous section for the significance of k, t and m). The general solution to the set of equations is a linear combination of many eigenmodes, given byJ’(T,9,b,t) aktmft(T)Yn(0 q5)ett, (1.19)
k,t,m
where Ùktm is an arbitrary coefficient corresponding to the intrinsic amplitude of the mode
that cannot be determined from linear theory.
The eigenfrequencies and eigenfunctions of eigenmodes are computed by solving the com plex system of six linearised and variable separated equations of oscillation, which are given by + + (N2 —J2)r + = gVadSS (1.20) pdr pç dT P
---()
+ 1dm_ +(
—)
4
— Ï(t+fl, = VadS (1.21) r dr F dr cr pc8 ur P id (2d1) — 1(1± ‘I — 4KGP( + r) = —41rGVadS (1.22) -F - K’ (1.23) dr dr ipTS = (PEN)’ — (r2f) — 1(1+ (1.24) ‘5T F2—1P $ T P2 (1.25)The thermodynamic quantities F1, F2 and Vd have their usual meaning, while F(r) is the radial component of the radiative flux perturbation, is the radial component of the Lagrangian displacement vector, and e8 is the local sound speed. N2 and L? correspond, respectively, to the Brunt-Visià and the Larnb frequency deflned in the previous section.
If information on the excitation of the eigenmodes is not an issue, the system of equations given above can be simplifled considerably using what is commonly known as the adiabatic approximation. In this approach it is assumed that no energy transfer takes place between the internai energy of the gas and the kinetic energy of the oscillations. As a consequence, the perturbation in entropy S = 0. The six complex equations of oscillation (they are complex on account of the irnaginary term in equation 1.24) can then be summarised in two flrst order and one second order equations corresponding to equations 1.20—1.22, which contain real components only, as + -4F’ + (N2 — 2) (1.26) pdr pc8 dr 1 ,-i / \ / T2\ r’ hi j_fl I 2 j 9 Ii t j — I 22 r de ‘ j c \ u-y pc8 u r ---(r2) — ‘ 47rGP(-- +
iY_r).
(1.28) r-dr dl- r- pc8 gComplemented by four boundary conditions (two at the centre and two at the surface of the star), this system of equations is reduced to an eigenvalue problem that yields a set of discrete eigenfrequencies u and their associated eigenfunctions. Since these cannot be determined
analytically, Pierre Brassard developed a designated numerical code perfectly suited to their evaluation (see Brassard et al. 1992 for details). It is this code that is used to compute the adiabatic period spectra of both the long-and short period variables discussed in the remainder of this thesis.
1.2.3 Determining Pulsational Stability from Non-Adiabatic Calculations
The properties of non-radial pulsations in stars are often studied in the adiabatic approxi mation because this is Iess involved than solving ail six of the complex equations describing stellar oscillations (equations 1.20—1.25). Nevertheless, full non-adiabatic calculations are of
CHAPTER 1. INTRODUCTION 22
paramount importance when attempting to determine the stability of a given mode. Since the set of equations solved is complex rather than real, the resulting eigenfrequencies and eigen functions are also complex quantities and as such consist of real and imaginary components. The eigenfrequency cari then be written
(1.29)
where R and i are real numbers. Consequently, the time dependence of an eigenmode (cf.
equation 1.18) is of the form
exp(icrt) = exp[i(GR + icri)t] = exp(icrRt) exp(—crit). (1.30)
The first component on the right hand side of the equation describes the oscillatory behaviour of a mode with frequencyUR(= 2ir/P), while the second part indicates the damping or growth
of the pulsation with time. This latter term does not exist in adiabatic theory as the imaginary part of the eigenfrequency cri is not computed. It is the sign of cri that is decisive: if it is
positive, the oscillation will 5e damped over time; it is thus stable. If on the other hand cri is
negative, the amplitude of the pulsation will experience an exponential growth and the mode will be unstable to oscillations. In practical terms this occurs if an excitation mechanism is operative in a region of the star where the amplitude of its eigenfunction is large. I will briefiy discuss the reason for stellar instability and the underlying driving mechanism for sdB stars in what follows.
The reason stars pulsate is because they are not in hydrostatic equilibrium and the force of gravity acting on the outer mass of the star is not quite balanced by the interior pressure. As a result of this, when a star expands due to increased gas pressure, its density decreases to the point of hydrostatic equilibrium and overshoots it, before gravity dominates and the star begins to contract again. The momentum of the in-falling material carnes the contraction and the pressure beyond the equilibrium point, starting the process all over again. Because energy is lost during such pulsations they are normally damped, resulting in the star’s overali stability. However, observations show that this is not always the case. On the contrary, we
now know of a number of farnilies of oscillating stars, most of which pulsate with very regular periods. This implies that the dissipated energy must be replaced by some forrn of excitation mechanism.
A star’s stabiiity is the resuit of the competition between the excitation and damping
mechanisms, which respectively supply and dissipate energy in certain regions of a star. The energy theorem is given by
1M
(EN — V. dMr
— f=R
P. dS, (1.31)
where the total energy E of the star consists of the kinetic, potential and internai energies and cari 5e written as
CM/i 1
E
/
t2++U)dMr. (1.32)J0 \2 2 j
Here is the gravitational potential, U is the specific internai energy M is the total mass of the star, EN is the nuclear energy generation rate, p is the density,
P
is the total energy flux,P is the pressure and iY is the velocity vector. Put into words, the energy theorem states that change in the total energy of a system is caused by either nuclear energy generation 6N in the
interior, ioss of radiative flux
P
at the surface or the outgoing waveflux Pï if no work is doue from the outside. $ince stability is the problem of the exchange from one type of energy to another in a given system, at Ïeast one form of energy must increase or decrease monotonically for instability to 5e achieved. Considering this, it is useful to introduce the work function W corresponding to tire total increase in energy over one period of oscillation. W can 5e derived from the first term on the right hand side of equation 1.31 if tire pressure goes to zero at the surface, and is given byw
= = (EN —P)
dMr (1.33)The star will pulsate in the case where W > O, i.e. when a net energy increase is taking place.
Tins energy increase originates from nuclear reactions in the core, which release photon energy that is efficiently converted to kinetic energy through some kind of driving mechanism.
CHAPTER1. INTRODUCTION 24
In the case of subdwarf B stars, this mechanism is the t-mechanism. The -mechanism contributes to the driving of an oscillation if
(+
>0, (1.34)where tT =
(--)
is the temperature dependence of opacity with constant density, =(1)
T is the density dependence of opacity with constant temperature and f3— 1 is an adiabatic exponent defined by
P3 — 1
= (8lnT)
, (1.35)
8lnp s
where S refers to entropy. If this inequality is satisfled by a particular region in the stellar envelope, the radiative flux from the stellar interior is blocked by the effect of the temperature and density dependence of opacity. Analogous to the concept of a dam blocking water from
a river and thereby creating a reservoir, this opaque layer in the stellar envelope causes the
radiative energy to build up. The blocked energy is subsequently converted to kinetic energy and hence used to drive the oscillations. Local enhancement of opacity is generally due to the presence of a partial ionisation zone, such as the region where singly ionised helium absorbs ultraviolet radiation to become doubly ionized. Since the value of 1T increases in the inner
part of an ionisation zone and decreases in the outer layers, the excitation and damping zones are located in the inner and outer zones of the ionisation zone respectively. The application of the t-mechanisrn to subdwarf B stars will be discussed in more detail in the following paragraph.
1.2.4 Pulsations in EC 14026 Stars Uncovering the Driving Mechanism
As models of subdwarf 3 stars are characterized by the presence of a Me II/He III convec
tion zone where Me II is ionized, h seemed natural to investigate whether it could serve as a driving rnechanism for pulsations. However, early modelling (Charpinet et al. 1996) showed that, in fact, the Me II/He III partial ionization zone was located too high in the envelope, in a region that contained too little mass for driving to be significant. On the other hand, there
was another maximum in the opacity, this time due to heavy-metal ionization, that seemed to lie at just the right envelope depth for pulsations to be driven efficiently (see Figure 1.8 for details). Furthermore, this newly found opacity bump (referred to as the Z-bump) was strongly depeudent on the metallicity of the uniform model; whereas employing solar metal abundances (Z 0.02) resulted in an opacity too weak to drive pulsations, increasing the metallicity of the model to beyond Z 0.04 produced excited modes. The modes excited were found to be non-radial low-order p-modes whose excitation depended on the model’s surface gravity log g and, to a lesser extent on the effective temperature Te , as well as on
the metallicity Z. o 1.5 1 0.5 0 —0.5
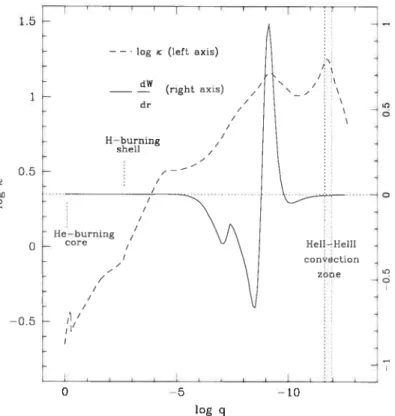
FIGuRE 1.8 0f interest here is the derivative of the work function dW/dr (solid line) as
well as the Rosseland mean opacity profile (dotted line) as a function of depth. The quantity dW/dr gives the net amount of energy gained (or lost) by the displaced material during a cycle of pulsation. Where it is positive, the corresponding region transfers energy INTO the mode, thereby exciting it. It can be seen that while dW/dr is essentially zero at the depth of the HeII/HeIII convection zone, it has a peak at the same depth as the secondary bump in the Rosseland mean opacity profile due to the ionization of heavy elements, in particular iron. This enables the driving of pulsations. From Charpinet et al. (1996).
0 —5 —10