HAL Id: hal-01869705
https://hal.inria.fr/hal-01869705
Submitted on 6 Sep 2018
HAL is a multi-disciplinary open access
archive for the deposit and dissemination of
sci-entific research documents, whether they are
pub-lished or not. The documents may come from
teaching and research institutions in France or
abroad, or from public or private research centers.
L’archive ouverte pluridisciplinaire HAL, est
destinée au dépôt et à la diffusion de documents
scientifiques de niveau recherche, publiés ou non,
émanant des établissements d’enseignement et de
recherche français ou étrangers, des laboratoires
publics ou privés.
Potential effects on server power metering and modeling
Yewan Wang, David Nörtershäuser, Stéphane Le Masson, Jean-Marc Menaud
To cite this version:
Yewan Wang, David Nörtershäuser, Stéphane Le Masson, Jean-Marc Menaud. Potential effects on
server power metering and modeling. CloudComp 2018 : 8th EAI International Conference on Cloud
Computing, Sep 2018, Exeter, United Kingdom. pp.1-12, �10.1007/s11276-018-1882-1�. �hal-01869705�
Yewan WANG1, 2, David NÖRTERSHÄUSER1, Stéphane LE MASSON1 and Jean-Marc MENAUD2
1 Orange Labs R&D, 2 Avenue Pierre Marzin, 22300 Lannion, France 2
IMT Atlantique, 4 Rue Alfred Kastler, 44307 Nantes, France
Abstract. Cloud datacenters are compute facilities formed by hundreds or even
thousands of servers. With the increasing demand of cloud services, energy ef-ficiency of servers in data center has become a significant issue. The knowledge of the energy consumption corresponding to hardware and software configura-tion is important for operators to optimize energy efficiency of a data center. We currently work on a predictive model for energy consumption of a server, with inputs as service provided, hardware material equipped (type and quantity of processor, memory and hard drive) and technical environment (energy con-version and cooling). In this article, we characterize some potential factors on the power variation of the servers, such as: original fabrication, position in the rack, voltage variation and temperature of components on motherboard. The re-sults show that certain factors, such as original fabrication, ambient temperature and CPU temperature, have noticeable effects on the power consumption of servers. The experimental results emphasize the importance of adding these ex-ternal factors into the metric, so as to build an energy predictive model adapta-ble in real situations.
Keywords: Server Benchmarking, Power Estimation, CPU Temperature.
1
Introduction
Data Centers are facilities composed of a large amount of servers, they are the cor-nerstones of the Internet that support data traffic transaction and storage for differ-ent cloud service, such as real-time video streaming, online gaming and mail ser-vice. However, with the rapid growth of the cloud service in recent years, data cen-ters have become a huge energy consumer, their power densities are 538-2153 W/ m2 and sometimes can be as high as 10 KW/ m2 [1]. The study of the configura-tion of suitable informaconfigura-tion system in data center becomes indispensable to make good use of the hardware resources [2]. Therefore, a simulation model for energy consumption is useful for designing data centers satisfying the current need and in the same time, without causing too much waste in hardware resources. A such model should be able to predict energy consumption with the following inputs: in-formation service provided (performance throughput), server hardware and soft-ware configuration as well as the associated technical environment (cooling sys-tem, room space, etc.). Much work has been done on building accurate power
pre-dictive models for servers in data centers. Some of them proposed high-accuracy software-level solutions as replacements to physical analyzers in order to allocate efficiently physical resources and make the system more energy-aware[3][4]. However, during our experimental measurements, we find that some factors may cause unexpected power variation in servers. We compare the difference of power among 15 identical servers by using an industrial-standard benchmark. Several po-tential factors in real data centers that may affect servers’ power in physical exper-iments are evaluated, such as: original fabrication process, way of placement in racks, fluctuating neighboring temperature, source voltage variation. Especially, we design tests to evaluate and characterize the influence of temperature variation of CPU and of the other components to the power, as well as the performance of servers, in precisely controlled experiment conditions. Normally, the consumption of CPU depends mainly on IT load. As the power increases with the load, CPU works harder and dissipates more heat, if the heat is not evacuated in time by the cooling system, the temperature surround CPU becomes higher and leads to the rise of leakage current, which will in reverse increase the power of CPU[5][6]. However, the influence of this thermal effect to the power consumption in system level hasn’t been precisely characterized.
The paper is organized as follows: Firstly, we briefly introduce the related work in Section 2. In Section 3, we explained how physical measurements are performed to 15 identical servers in using an industrial standard test tool. This aims to clarify how power varies among identical servers in a real data centers. Then, in Section 4 we study the influence of temperature on power consumption and performance of servers in system level. Temperature is varied separately on CPU and the other components than CPU in the motherboard. Conclusions are given in Section 5.
The goal of this paper is to identify and characterize the impact factors contributing to the power variation of servers, in order to help correcting the precision of existing theoretical models built from mathematical analyses. The major contributions of this paper are:
─ We compare the power consumption of 15 nominally identical servers. An indus-trial-standard benchmark has been used to stress different components of the serv-ers at different target levels.
─ We explore several potential factors that may contribute to the power variation of servers in real data centers, including: server fabrication, way of placement in racks, fluctuating neighboring temperature and variation of source voltage to the server power.
─ We characterize separately the impact of temperature by components on power and performance of servers equipped with CPUs in different generations.
2
Related work
Some recent studies concluded that other than IT load applied to the components (CPU, memory, network and storage), the power of servers can be affected by exter-nal factors, such as origiexter-nal fabrication process[7][8], ambient tempera-ture[9][10][11], way of placement in a rack. Henry C Cole et al. [7] conducted sever-al tests among three server manufacturers (three from Intel, one from Dell and one from Supermicro) with similar mechanical and electronic specifications, in order to determine whether the energy use and efficiency of server had the relationship with their brands. 5% difference of power consumption was observed among three identi-cal Intel servers. They switched their main components in the motherboard in order to identify the source of the difference. The results showed that the difference was main-ly brought by CPU. However, these tests were performed within onmain-ly three servers and the conclusion was suggestive rather than definitive. In a thermodynamic analysis of Patterson et al. [12], the ambient temperature affects server power in two ways: through temperature sensitive components (i.e. CPU) and through server internal cooling fans. They draw the conclusion theoretically by analyzing a typical data cen-ter configuration. CPU temperature draws much attention, as a lot of work has con-firmed the strong relationship between CPU temperature and server power [13][14][15]. Mair et al. [16] observed the power latency when running unchanged system load in the server. Moreover, the duration of power latency follows tightly the CPU warm-up period, and the system’s fan speed remained steady at 3600 rpm during the test. Therefore, the power latency in this case was not due to the consumption of fan but to the rise of CPU temperature. The conclusion was that the CPU temperature can result in notable variation of power consumption before and after the stable state. They suggested to prolonger the execution time to eliminate this thermal impact and increase the model precision. However, the correlation between the CPU temperature and the server power hasn’t been discussed and only the AMD architecture servers are concerned in their studies.
3
Do identical servers under the same load always have the
same energy consumption?
IMT Atlantique in Nantes (France) is one of the sites of Grid5000 [19], an experi-ment-driven platform grouped in homogeneous clusters from 8 cities across France. It provides open access to geographically distributed resources for researches in com-puter science domain. The site located in Nantes disposes of 4 racks and each rack stores 12 identical servers (Dell PowerEdge R630 [email protected]), as shown in
Fig. 1.
3.1 Experiments setup
Five micro-workloads in the SERT [17] are chosen as the test suite. SERT (Server Efficiency Rating Tool) is an industrial standard rating tool for evaluating
energy-efficiency for server systems, developed by SPEC committee. It contains a number of micro-workloads, called Worklets that exercise different components of the SUT (Server Under Test) at different target load levels (except idle). In our experiment, we chose 5 typical worklets in SERT to stress CPU, memory and storage system of the SUT, in order to analyze the power consumption variations for identical servers. The details of these worklets are shown in Table 1. Firstly, we run SERT on S1 twice, the power and performance (operations throughput) variation is within 1%, which means the result of SERT is reproducible.
The system diagram shown in Fig. 2 includes three parts: Measurement system, Controller and SUT.
─ The measurement system is composed by two devices:
Yokogawo WT330: a power analyzer measuring AC (alternative current) power
provided to PSU (power supply unit) of server, with maximum measurement error less than 1%.
Testo176 + Thermocouple: a thermometer with two thermocouples connected
(type K, with 0.1mm diameter)
─ Controller: controls SUT by sending commands via a network cable. Controller also gathers measurement data recorded by power and temperature analyzers with 1Hz sampling frequency.
─ SUT: installed with Linux OS compatible to SERT, systems are configured accord-ing to the guidelines described in the SPEC Methodology [18]
Table 1. Test suite information.
Worklet Component Description Load level
LU CPU Dense Matrix operations 100%, 75%, 50%, 25%
SHA256 CPU SHA-256 hashing transformation 100%, 75%, 50%, 25%
Sequential Storage Reads and Writes data to/from file 100%, 50%
Capacity3 Memory XML validation Base, Max
Idle system No load on SUT None
Fig. 2. System diagram Fig. 1. Position of SUT in the room
100 120 140 160 180 200 220 S1 S2 S3 S4 S5 S6 S7 S8 S9 S10 S11 S12 P owe r ()W at t
LU100 % LU50 % SHA100 % SHA50 %
Seq100 % CapMax Idle
0,0 % 1,0 % 2,0 % 3,0 % 4,0 % 5,0 % 6,0 % 7,0 % 8,0 % 9,0 %
Power variation Performance variation
LU100 % LU75 % LU50 % LU25 % SHA100 % SHA75 % SHA50 % SHA25 % Seq100 % Seq50 % CapBase CapMax Idle
3.2 Power variation for 12 identical servers in the same rack
The test suite is repeated on S1-S12 in sequence in rack 1. Fig. 3 shows the mean power of S1-S12 in running different worklets and Fig. 4 precises the maximum-minimum percentage of variation on server power and performance.
It can be observed that under the same load, power variation among identical system in the same rack can reach up to 7.8%. According to our observations and previous state-of-the-art study, this variation may be caused by different potential factors, such as fabrication process, fluctuating neighboring temperature, way of placement in the rack and source voltage variation. However, we are not allowed to open or to move the servers belonging to Grid5000, the impact of construction will be completed in further research. In the following tests, we investigate the influence of ambient tem-perature, way of placement in the rack and variation of source voltage on power con-sumption of servers.
Fig. 3. Mean power of 12 identical servers and variation of power and performance between
different worklets
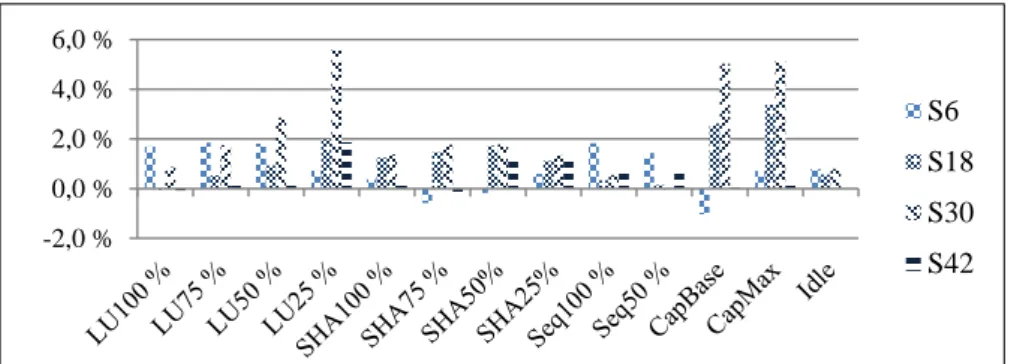
3.3 Power variation for 4 servers in the same altitude of the racks in two circumtances
SUTs are four servers at the same altitude in four racks: S6, S18, S30 and S42 (cf figure 1). Servers are placed in two ways: for S6 and S18, they are placed loosely and keep some distance between each other in rack 1 and 2. While for S30 and S42, they are placed next to other servers in rank 3 and 4. Different way of server placement affects the air circulation and heat distribution in racks. This allows us to compare the impact of placement density to the energy consumption of servers. Test suite is re-peated twice in two cases. In case one, only the SUT is turned on in the rack. In case two, we increase the neighboring temperature by turning on the other servers. Fig. 5 shows the percentage of power variation in two cases for four SUTs. The results turned out that, for the same server under different neighboring temperatures, the power varies from 0 (idle, S42) to 5.6% (LU25%, S30). Comparing the percentage of variation between S6, S18 and S30, S42, we find that the server placement density has no obvious impact on power consumption.
Fig. 5. Percentage of power variation for servers under two circumstances
3.4 The impact of source voltage variation on server power consumption
While performing the tests in section 3.2 and 3.3, source voltage provided by grid varies from 230V to 240V. In order to eliminate the number of variables in this study, we perform another test in a laboratory, where the ambient temperature is controlled and remained at 23°C. The power supplied to the SUTs is delivered by an AC power generator, which can configure stable AC voltage. The tests are performed to two servers with very different characteristics: Gigabyte mw50-sv0 and Dell PowerEdg-eR630, details can be found in table 2. Test suite SERT is repeated for each server on 3 different voltages: 207V, 230V and 253V.
For Gigabyte, the power variation is less than 2% for all the worklets. For Dell, the variation is less than 1.5% for worklets except the “Sequential” (storage, 2.8 %). For conclusion, the voltage variation from power supply doesn’t introduce evident influ-ence on the server power.
-2,0 % 0,0 % 2,0 % 4,0 % 6,0 % S6 S18 S30 S42
4
How thermal effect impacts on the consumption of servers?
Results of the experiments in Section 3 show that, apart from the system load, ambi-ent temperature is the greatest contributor to the server power variation. However, the impact cannot be characterized without controlling precisely the neighboring tempera-ture surrounding the server. In this section, we focus on the thermal impact on the power consumption of servers in system level. The impact of CPU temperature (leak-age current) and the other components are studied separately in section 4.2 and 4.3. Fans, DC power generator and climatic cabins are provided to help controlling pre-cisely the temperature of different components in the motherboard.
4.1 Experiments setup
Four servers equipped with different generations of CPUs from Intel are tested as shown in Table 2:
Table 2. Characteristics of the SUTs.
SUT Gigabyte mw50-sv0 SuperMicro x10sdv-tln4f PowerEdge R630
Processor Intel Xeon E5-2609v3, 6 cœurs, 1.9GHz
Xeon D-1540, 2.0 GHz, 20 cœurs
2 x Intel Xeon E5-2650L v4, 56 cœurs, 1.7GHz Release date Q3 2014 Q1 2015 Q1 2016 Memory 4 x 16Go DDR4 2133MHz 4 x 16Go DDR4, 2400MHz 4 x 32 Go DDR4 2400MHz
Storage 480Go SSD 400Go SSD 400Go SSD
In order to take away the additional electricity consumed by integrated fans, they are removed from motherboard and replaced by external fans powered by a separated DC power supply. The test diagrams are shown in Fig. 6 and Fig. 7, including four parts: measurement system, controller, SUT and temperature control system
─ The measurement system: Fluke 430T a power meter, allows measuring AC (alter-nating current) power provided to PSU (power supply unit) of server, with maxi-mum measurement error less than 1%.
─ Controller: controls SUT by sending commands via a network cable. Power ana-lyzer are connected to controller via USB cables, controller gathers power readings on server power with a sampling frequency at 1Hz.
─ SUT: installed with Linux OS.
─ Temperature control system: Fan powered by independent DC generator and cli-matic cabin.
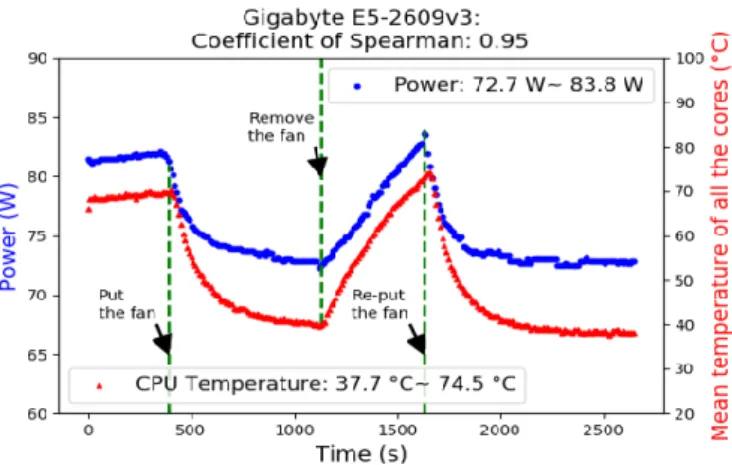
4.2 Impact of CPU temperature (leakage current) to the server power and performance
Benchmark cpuburn[19] was used to stress the SUT in this test. It is a CPU intensive benchmark that keeps the load level at 100% and maximizes the heat production of CPU. We vary the surface temperature of CPU via the external fan by adjusting the air flow between fan and heat sink1. Results of four different servers are shown in
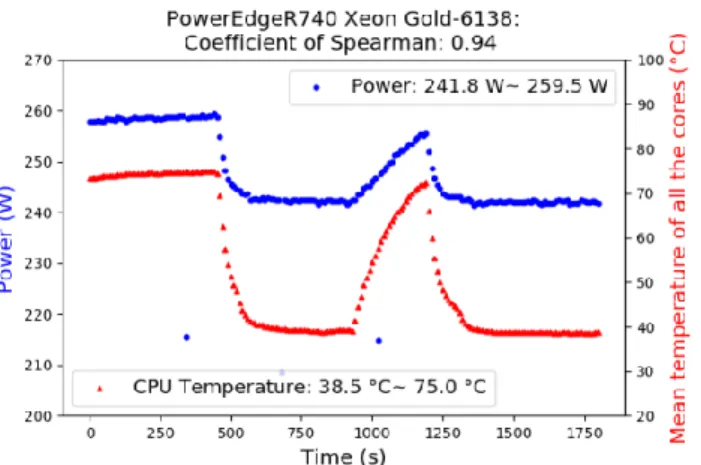
Fig. 8 - Fig. 11. It can be observed that under a constant load, the instant data of CPU
temperature and server power are highly correlated with spearman coefficient larger than 0.93 for all the SUTs. The power varied more than 10 Watt for servers Gigabyte and Dell PowerEdgeR630, R740.
Fig. 8. Relationship between CPU Temperature and server power-Gigabyte
1
Heat sink : or radiator, made in metal, help cooling down CPU
Fig. 9. Relationship between CPU Temperature and server power-SuperMicro
Fig. 10. Relationship between CPU Temperature and server power-PowerEdgeR630
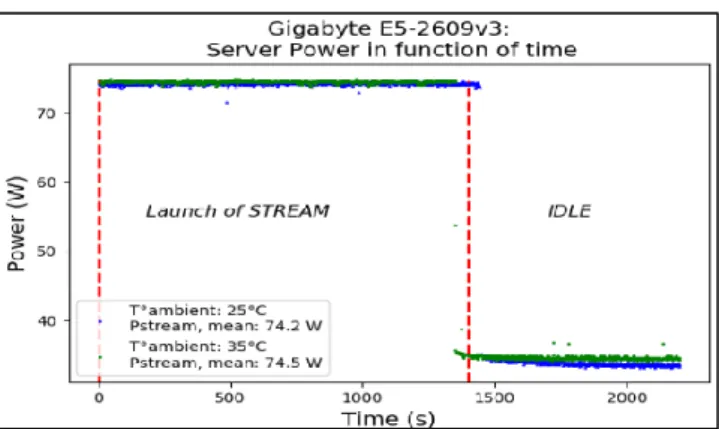
4.3 Impact of the temperature of the components other than CPU in the motherboard to the server power consumption and performance
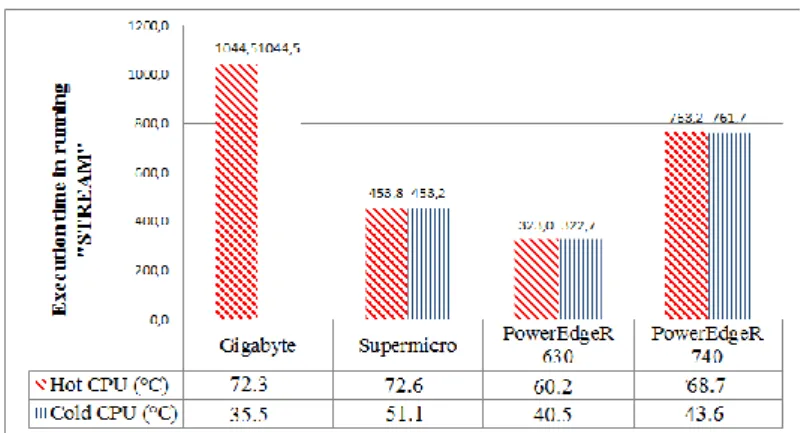
We stabilize the surface temperature of CPU and vary the temperature of the other components by a climatic cabin (cf Fig. 7). CPU and memory intensive benchmark stream[23] is used to stress the SUT. The test is repeated twice with climatic cabin’s temperature configured respectively at 25°C and 35°C. Results of two different serv-ers are shown in Fig. 12 and Fig. 13. Only the server Gigabyte and SuperMicro are concerned in this test limited by the size of the climatic cabin. CPU temperatures are remained at 47°C for Gigabyte and 59°C for SuperMicro during the execution when the ambient (climatic cabin) temperature increases from 25°C to 35°C. The results prove that the power hardly varies when changing only the temperature of the other component than CPU.
Execution time of the benchmark stream is recorded for the two servers under dif-ferent CPU temperatures, as shown in Fig. 14. For the same test, CPU temperature has no obvious impact on server performance.
Fig. 12. Relationship between temperature of other components and server power - Gigabyte
Fig. 14. Impact of CPU temperature on server performance
5
Conclusion
This paper addresses the question: whether identical servers delivery the same energy consumption under the same load. Physical experiments have been conducted in order to investigate the variation and reveal the causes. In Section 3, 7.8% power variation is observed among 12 identical servers running the same test suites. For the same server, fluctuating neighboring temperature can contribute to 5.6% power variation. Thermal effect, turned out to be one of the most contributors to the power variation, is investigated in precisely controlled experiments in Section 4. The results prove that CPU temperature can introduce very important power variation: for the server Giga-byte equipped with an Intel Xeon E5-2609v3 CPU, the power is increased by 16% when the temperature of CPU varies from 37.7°C to 74.5°C. However, the server power barely varies when the CPU temperature remains the same. Therefore, CPU is supposed to be the most temperature sensitive component in servers. The ambient temperature affects the power consumption of servers in two ways: the consumption of fans and CPU (leakage current).
The results presented here are significant for the development of a predictive mod-el to estimate the power consumption of servers. Thermal effect, especially for CPU is turned out to have great impact on server power. This result also emphasize the im-portance of adopting more efficient cooling solutions like liquid cooling, in order to increase the energy efficiency for data centers. In the future work, the study will be completed by charactering the difference brought by fabrication process as mentioned in Section 3. The efforts are also encouraged to propose a method of controlling CPU temperature intelligently to balance the performance and cooling cost.
References
[1] D. L. Beaty, “Internal IT load profile variability,” ASHRAE J., vol. 55, pp. 72–74, 2013. [2] “Energy Efficiency - European Commission.” [Online]. Available:
https://ec.europa.eu/energy/en/topics/energy-efficiency. [Accessed: 20-May-2018]. [3] G. Da Costa and H. Hlavacs, “Methodology of measurement for energy consumption of
applications,” Proc. - IEEE/ACM Int. Work. Grid Comput., pp. 290–297, 2010.
[4] M. Jarus, A. Oleksiak, T. Piontek, and J. Wȩglarz, “Runtime power usage estimation of HPC servers for various classes of real-life applications,” Futur. Gener. Comput. Syst., vol. 36, pp. 299–310, 2014.
[5] E. Kursun and C. Cher, “Temperature Variation Characterization and thermal management of multicore architectures,” IEEE Micro, vol. 29, no. 1, pp. 116–126, Jan. 2009.
[6] D. Moss and J. Bean, “Energy Impact of Increased Server Inlet Temperature,”
Innovation, pp. 1–9.
[7] H. C. Coles, Y. Qin, and P. N. Price, “Comparing Server Energy Use and Efficiency Using Small Sample Sizes Coles,” Ernest Orlando Lawrence Berkeley National
Laboratory, Berkeley(No. LBNL-6831E), CA (US), 2014.
[8] J. von Kistowski, H. Block, J. Beckett, C. Spradling, K.-D. Lange, and S. Kounev, “Variations in CPU Power Consumption,” Proc. 7th ACM/SPEC Int. Conf. Perform. Eng.
- ICPE ’16, pp. 147–158, 2016.
[9] A. C. Orgerie, L. Lerevre, and J. P. Gelas, “Demystifying energy consumption in grids and clouds,” in Green Computing Conference, 2010 International. IEEE, 2010, pp. 335– 342.
[10] W. Torell, K. Brown, and V. Avelar, “The Unexpected Impact of Raising Data Center Temperatures,” Write paper 221, Revision 0. .
[11] S. Sampath, “Thermal Analysis of High End Servers Based on development of detail modeland experiments,” Master Degree Report, no. December. Texas, 2012.
[12] M. K. Patterson, “The effect of data center temperature on energy efficiency,” in
Thermal and Thermomechanical Phenomena in Electronic Systems, 2008. ITHERM 2008,
2008, pp. 1167–1174.
[13] A. M. Haywood, J. Sherbeck, P. Phelan, G. Varsamopoulos, and S. K. S. Gupta, “The relationship among CPU utilization, temperature, and thermal power for waste heat utilization,” Energy Convers. Manag., vol. 95, pp. 297–303, 2015.
[14] W. L. Bircher and L. K. John, “Complete System Power Estimation using processor power events.pdf,” vol. 61, no. 4, pp. 563–577, 2012.
[15] P. Garraghan et al., “A Unified Model for Holistic Power Usage in Cloud Datacenter Servers,” Proc. 9th Int. Conf. Util. Cloud Comput. - UCC ’16, pp. 11–19, 2016.
[16] J. Mair, Z. Huang, D. Eyers, and H. Zhang, “Myths in PMC-Based power estimation,” vol. 8046, pp. 35–50, 2013.
[17] K.-D. Lange, M. G. Tricker, K.-D. Lange, and M. G. Tricker, “The Design and Development of the Server Efficiency Rating Tool (SERT),” in Proceeding of the second
joint WOSP/SIPEW international conference on Performance engineering - ICPE ’11,
2011, vol. 36, no. 5, p. 145.
[18] “Standard Performance Evaluation Corporation (SPEC) Power and Performance Benchmark Methodology V2.2.”
[19] “Ubuntu Manpage: cpuburn, burnBX, burnK6, burnK7, burnMMX, burnP5, burnP6 -
a collection.” [Online]. Available:
http://manpages.ubuntu.com/manpages/precise/man1/cpuburn.1.html. [Accessed: 28-Mar-2018].