DEEP IMAGING OF AX J2019]112: THE LUMINOSITY OF A ““ DARK CLUSTER ÏÏ1 NARCISO BENITEZ,2 TOM BROADHURST,2,3 PIERO ROSATI,3 FRED COURBIN,4,5 GORDON SQUIRES,6
CHRIS LIDMAN,3 AND PIERRE MAGAIN5,7 Received 1998 August 17 ; accepted 1999 July 22
ABSTRACT
We detect a distant cluster of galaxies centered on the QSO lens and luminous X-ray source AX J2019]112, a.k.a. the ““ Dark Cluster.ÏÏ Using deep V and I Keck images and wide-ÐeldKs imaging from the New Technology Telescope (NTT), a tight red sequence of galaxies is identiÐed within a radius of 0.2 h~1 Mpc of the known z \ 1.01 elliptical lensing galaxy. The sequence, which includes the central ellip-tical galaxy, has a slope in good agreement with the model predictions of Kodama et al. for z D 1. We estimate the integrated rest-frame luminosity of the cluster to be LVº 3.2] 1011h~2L_ (after account-ing for signiÐcant extinction at the low latitude of this Ðeld), more than an order of magnitude higher than previous estimates. The central region of the cluster is deconvolved using the technique of Magain, Courbin, & Sohy, revealing a thick central arc coincident with an extended radio source. All the observed lensing features are readily explained by di†erential magniÐcation of a radio-loud active galac-tic nucleus by a shallow ellipgalac-tical potential. The QSO must lie just outside the diamond causgalac-tic, produc-ing two images ; the arc is a highly magniÐed image formed from a region close to the center of the host galaxy, projecting inside the caustic. The mass-to-light ratio within an aperture of 0.4 h~1 Mpc is using the X-ray temperature. The strong lens model yields a compatible MX/L V \224~78`112h(M/LV)
_,
value, M/L V \ 372~94`94h(M/LV)_, whereas an independent weak-lensing analysis sets an upper limit of typical of massive clusters.
M/L V \520h(M/L V)_,
Subject headings : dark matter È galaxies : clusters : general È galaxies : photometry È gravitational lensing È X-rays : galaxies
1
.
INTRODUCTION
Hattori et al. (1997 ; hereafter H97) have recently shown that the well-studied QSO lens Q2016]112 is coincident with an extended X-ray source of hot bremsstrahlung radi-ation, AX J2019]112. The association is based on good positional agreement with high-resolution ROSAT HRI data and also on a plausible consistency in redshift between the central lensing galaxy at z\ 1.01 (Schneider et al. 1985) and an X-ray emission line, interpreted as FeXXV, at z B 1. The detection of enriched gas at high redshift, comparable in iron abundance to local clusters, is puzzling, and exacer-bated by the absence of any obvious cluster of galaxies at this location (Schneider et al. 1985 ; Langston, Fischer, & Aspin 1991) to provide a potential means of IGM enrich-ment.
Other claims of ““ dark ÏÏ cluster-sized objects have been made on the basis of Sunyaev-Zeldovich (SZ) decrements (Jones et al. 1997 ; Richards et al. 1997), indicating cluster-sized plasma concentrations at redshifts in excess of unity (Bartlett, Blanchard, & Barbosa 1998). However, a follow-up deep X-ray observation of PC 1643]4631 limits any such plasma to an unreasonably high redshift (Kneissl, 1 Based on observations collected at the European Southern Observa-tory, La Silla, Chile, proposal number 61.A-0676.
2 Astronomy Department, University of California at Berkeley, 601 Campbell Hall, Berkeley, CA ; benitezn=wibble.berkeley.edu.
3 European Southern Observatory, D-85748, Garching, Germany. 4 UniversidadCatolicade Chile, Department of Astronomy and Astro-physics, Casilla 104, Santiago 22, Chile.
5 Institut dÏAstrophysique et deGeophysique, UniversitedeLie`ge, 5, Avenue de Cointe, B-4000Lie`ge,Belgium ; and URA 173 CNRS-DAEC, Observatoire de Paris, F-92195 Meudon Principal CEDEX, France.
6 Center for Particle Astrophysics, University of California at Berkeley, 301 Le Conte Hall, Berkeley, CA.
7 AlsoMa•ütrede Recherches of the Fonds National de la Recherche ScientiÐque (Belgium).
Sunyaev, & White 1998), and there is no evidence for an excess of galaxies toward that direction (Ferreras, Ben•tez, & Mart•nez-Gonzalez 1998 ; Saunders et al. 1997). There-fore, conÐrmation for the existence of these high-redshift ““ dark ÏÏ clusters should await improved radio data.
In contrast, fairly conventional looking X-rayÈselected clusters have now been identiÐed at redshifts as high as z\ 1.27 (Stanford et al. 1998b; Rosati et al. 1999). These clusters have obvious E/SO color sequences, identiÐed by optical-IR color, and, depending on their masses, are diffi-cult to account for in the standard account of structure formation with high ) (Bahcall & Fan 1998 ; Eke et al. 1998). On purely empirical grounds, the existence of X-rayÈ luminous clusters at z^ 1 is not surprising. Recently com-pleted deep X-ray surveys show no evidence of a decline in the space density ofL X-rayÈselected clusters over a
XDLX*
wide redshift range, 0.2 \ z \ 0.8 (Rosati et al. 1998). Here we show that the low Galactic latitude of AX J2019]112 ( o b o \ 13.6) signiÐcantly impedes the detection of faint galaxies in this Ðeld, due to the extended halos of numerous bright stars and signiÐcant Galactic extinction. In ° 3 we analyze very deep,0A.6images taken with the Low Resolution Imaging Spectrometer (LRIS ; Oke et al. 1995) on Keck II (° 2), and identify a sequence of red galaxies in V[I, centered on the lens. This identiÐcation is bolstered by deepK images, obtained using the new infrared
s-band
spectrograph and imaging camera, SOFI, on the New Tech-nology Telescope (NTT). In ° 4 we reanalyze the archived ROSAT HRI X-ray observations of this Ðeld, possibly resolving three signiÐcant sources of emission, one of which is marginally extended and coincident with the cluster, leading to a signiÐcant revision of the published X-ray lumi-nosity. In ° 5 we provide an independent upper limit to the M/L for the cluster from a weak-lensing analysis using the Keck images. In ° 6 we deconvolve the central region of the 31
Ðeld, Ðnding an arc around the brightest cluster elliptical, and Ðnally in ° 7 we use this and a simple lens model to reconcile the many radio sources and optical/IR lensing features. In ° 8 we summarize the main results and conclu-sions.
Throughout this paper, we assume )0 \ 1, "\ 0, and Mpc km s~1).
h\ H0/(100
2
.
OPTICAL AND NEAR-IR IMAGING AND PHOTOMETRY
Deep V and I images were obtained with LRIS at the Keck II telescope on the night of 1997 June 29. The seeing was good, 0A.62 in the I-band and0A.65 in V . The images cover an area of size 5@.5] 7@.5.
The optical images were debiased and Ñattened with dome Ñats and illumination-corrected using standard pro-cedures. The I-band images are badly a†ected by fringing. This was accurately removed by generating a fringing pattern from combined observations of other Ðelds taken on the same night. Visual inspection does not show any residual fringing pattern. The resulting V - and I-band images were aligned with a small correction for a relative distortion across the Ðeld, requiring a third-order poly-nomial. The Ðnal averaged images have total exposure times of 1480 s in I and 1980 s in V , with a scale of 0A.215 pixel~1, and represent the highest quality optical images of this Ðeld to date. Calibration was obtained in 1998 July by observing the Ðeld and several Landolt standards with LRIS and the same Ðlter. The magnitude zero-point uncer-tainties are 0.03 in both the I and V -bands, and no appre-ciable color term was detected. Due to the low Galactic latitude of the Ðeld (b\ [13.6), the error in the absolute zero point is dominated by the uncertainty in the value of the Galactic extinction. Burstein & Heiles (1982) give an extinction of A(B)\ 0.98 at our position, corresponding to A(V ) B 0.74 and A(I) B 0.44. The more direct and higher resolution estimation of Schlegel, Finkbeiner, & Davis (1998), based on an IRAS/DIRBE map, gives A(B)\ 0.81 ^ 0.12, in marginal agreement with Burstein & Heiles (1982). We adopt the extinction of Schlegel et al. (1998), which yields A(V )\ 0.67 ^ 0.10, A(I) \ 0.36 ^ 0.06, and A(KS) \ 0.08^ 0.01. Therefore, the total zero-point uncertainties are 0.1 in V , 0.07 in I and 0.06 in V[I. The 5 p limiting magnitudes within an aperture of1A.5are I\ 25.32 and V \ 26.65.
In addition, wide-Ðeld Ks-band images were acquired on the night of 1998 July 10 with SOFI, a new wide-Ðeld infrared imager and spectrograph on the ESO NTT (Moorwood, Cuby, & Lidman 1998). SOFI uses a Rockwell 1024 square Hg : Cd : Te device, which gives a Ðeld size of 5@] 5@ in the large-Ðeld imaging mode. The pixel scale is 0A.288.
In total, 90 separate images of Q2016]112 were taken with the Ks Ðlter. Each image is itself a stack of six short integrations, each of 10 s. The telescope was o†set in a random manner by 40A or less between each stack to help in generating an accurate sky background measurement over the full Ðeld.
The data were reduced by Ðrst subtracting the bias with an averaged dark frame, and then dividing out the varia-tions in pixel sensitivity with normalized dome Ñats. The sky was estimated for each image individually by construc-ting a running mean of the adjacent 10 dithered exposures, with suitable clipping to remove objects. The images were then registered and combined. The intensity of the sky
during the observations ranged between 13 and 13.2 mag arcsec~2.
The ÐnalKs image is the average of 68 images, with a resulting seeing ofB0A.7and a total exposure time of 4080 s. This image excludes frames with resolution lower than 0A.9, comprising B25% of the total. The conditions at the time of the observations were photometric. The magnitude scale was determined by observing four standards from the list of Persson et al. (1998). The scatter between the standards is 0.015 mag. The 5 p detection within a 1A.5 aperture is K
S\ 21.25.
3
.
REDUCTION
Due to the low Galactic latitude of the Ðeld, the star density is very high, and most of the area of the Ðeld is covered by the extended halos of the brightest stars, espe-cially in the I-band (Fig. 1a). We Ðnd that the best approach to dealing with this problem is to generate a ““ halo pattern ÏÏ by setting the central parts of the stars and the saturation spikes to the average background level and then applying a broad, 11@@] 11@@ median Ðlter to the image. The pattern thus obtained is subtracted from the original frame, and the resulting image is used for object detection. In a Ðnal step, all the bright cores of the stars, including their saturated trails, are masked out. The initial and Ðnal, ““ de-haloed ÏÏ I-band images are shown for comparison in Figures 1a and 1b.
The exact value of the threshold used to deÐne the bright cores must be chosen by eye. If it is too high, there will be holes around the stars after subtraction ; if too low, the halos will be practically una†ected. The smoothing and masking a†ects the photometry of bright extended objects, but on average it does not a†ect the fainter ones. This is established using similarly deep but much higher latitude Keck I-band observations of a control image (PSR 1640]22) Ðeld (Smail et al. 1995). This Ðeld was scaled so that the background noise level was the same as in our Q2016]112 I image. We then add it to all the halos and bright objects from our cluster Ðeld, i.e., the di†erence between Figures 1a and 1b. In this way, a test image is created with the same halo characteristics as Figure 1a, but with an uncontaminated galaxy background for performing tests. We then apply exactly the same halo-removing pro-cedure as described above. In establishing the errors intro-duced by the halos and the improvement from the halo-removal procedure, we make use of the detection soft-ware SExtractor (Bertin & Arnouts 1996) to produce three catalogs. First, we create a catalog of the photometric properties of the test Ðeld before any changes are made (catalog O). Second, a catalog is created for the halo-contaminated control (catalog H) Ðeld by adding the halos from the cluster frame to the control Ðeld, and Ðnally a catalog (dH) is generated for the halo-subtracted control Ðeld after applying our correction for the halos in exactly the same way as for the cluster Ðeld.
Comparing the test Ðeld catalog (O) with those of the halo-a†ected images of this same Ðeld (H and dH) allows a reliable empirical estimate of the e†ect of the halos on the magnitude estimates, and also measures the degree of improvement achieved by our halo-removal procedure. The comparison of the magnitude di†erences between catalogs H and O, and catalogs dH and O, shows that the presence of numerous stars with extended halos distorts the estima-tion of the background, and is a stronger source of
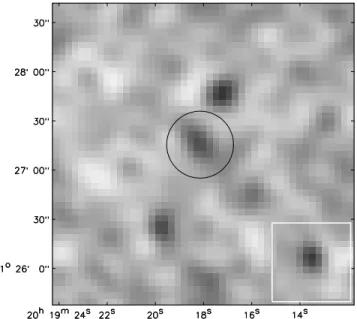
photo-FIG. 1.ÈI-band image of the Ðeld around Q2016]112 (a) before and (b) after the halo-removing procedure. The white circle shows a 0.4 h~1 Mpc diameter aperture (47A) at z\ 1.01 centered on galaxy D.
metric noise than any additional uncertainty introduced in the process of eliminating the halos. These tests also allow us to estimate the percentage of ““ useful surface ÏÏ recovered with our procedure. On the image obtained after adding the halos, we only detect between 35% (at I B 20) and 25% (at I B 25.5) of the objects that were initially present on the PSR 1640]22 image. After the halo-removing procedure, we recover respectively between 30% (I B 20) and 45% (I B 25.5) of the same objects. The maximum possible detec-tion efficiency (found by excluding from the PSR 1640]22 original frame all objects that have at least one pixel in the masked areas) is 44% (at I B 20) and 72% (at I B 25.5), in the last case approaching the percentage of ““ nonmasked ÏÏ area, 74.5%. This means that apart from obtaining slightly more reliable magnitudes, the followed procedure increases by B80% the useful surface for detecting faint objects. For-tunately, as can be seen in Figure 1, the central region con-taining the cluster is one of the least a†ected by halos. But in the rest of the image, in particular for areas close to bright halos, the tests show that apart from the standard photo-metric errors, there is an increased random error in the magnitude estimates of B0.2 in the I-band magnitude com-pared to the halo-free image.
The detection and classiÐcation of objects in the V , I, and K images is made using SExtractor version 2.0 (Bertin & Arnouts 1996). This software smooths the images with a Gaussian of size close to the seeing width, and then locates peaks above a given threshold. To obtain accurate colors, we use the I-band image for detection, and the apertures obtained for each image to perform the V and KS-band photometry. These matched apertures are ideal given the very similar seeing for all three passbands.
It was found that somewhat di†erent deÐnitions of mag-nitudes are required for bright and faint galaxies for best results, due to the approach of all faint galaxies to the seeing proÐle. For the bright galaxies, we adopt the SExtractor Kron-like ““ automatic ÏÏ magnitudes,mau, with a k param-eter of 2.5. These apertures encompass B95% of the total object magnitudes.8 To prevent the magnitudes from being a†ected by crowding, SExtractor masks the pixels belong-ing to neighborbelong-ing objects and replaces their values by those of pixels lying symmetrically opposed to the source center. For faint objects (I [ 23.5), we measure the magni-tude within a Ðxed aperture of 1A.5 and correct it to the automatic magnitude, assuming that faint objects have roughly stellar proÐles. This was established by stacking together many faint objects. The corresponding corrections are 0.14 in the I band and 0.21 in the V band.
SExtractor assigns to each object a value of the param-eter ““ class-star, ÏÏ which ranges from 0 to 1. If the seeing FWHM is well determined, stars obtain values of this parameter close to 1, whereas for extended objects it tends to be close to 0. The classiÐcation, performed using the I-band images, works satisfactorily for objects with I [ 24.7, which corresponds to a detection with a S/N Z 9 within a 1A.5 aperture. At fainter magnitudes, SExtractor assigns similar values of the ““ class-star ÏÏ parameter, B0.4È 0.5 to all objects. One of our main concerns is to avoid the contamination of our galaxy sample by stars, especially since some of them, e.g., disk M dwarfs, would have the same colors as early-type galaxies at the cluster redshift. 8 See the SExtractor UserÏs Manual, available at ftp://ftp.iap.fr/pub/ from–users/bertin/sextractor.
FIG. 2.ÈColor-magnitude diagram for the central 0.4 h~1 Mpc region around Q2016]112 (left) and for the rest of the frame (right). The Ðlled squares indicate the positions of the ““ red sequence ÏÏ galaxies, objects compatible with having V[I \ 3.19 [ 0.07] (I [ 21.20) within errors
FIG. 3.ÈV [I vs. I[K for all the galaxies in the Ðeld. The objects identiÐed as cluster members on the basis of the V[I, I plot are circled. The arrow indicates an upper limit. Note that all but one of these objects lie in a tight bunch in this two-color plane, at the red end of a locus deÐning the passively evolving track of early-type galaxies, strengthening the claim for a cluster at z D 1.
This is achieved by excluding those objects with I [ 24.7 and imposing a very conservative threshold in the class-star parameter, 0.25. The V[I versus I plots of the central region around the lens and the rest of the frame are shown in Figure 2. Objects with V fainter that V \ 27.0, corre-sponding to a 3.5 p detection within a 1A.5aperture, have been excluded. Figure 3 shows V[I versus I[K for all the galaxies in the Ðeld. Objects fainter thatK
corre-S\ 21.60, sponding to a 3.5 p detection within a 1A.5aperture, have also been excluded.
4
.
THE GALAXY CLUSTER
Recent work (Stanford, Eisenhardt, & Dickinson 1998 ; Kodama et al. 1998) has shown that cluster ““ red sequences,ÏÏ the locus in the color-magnitude diagrams of the cluster early-type galaxies, represent a remarkably stable feature, which is detected up to z [ 1 redshifts (e.g., on the z\ 1.2 cluster around 3C 324; Dickinson 1995). The red sequence is an excellent marker of the presence of a massive cluster, since galaxies with the colors and magni-tudes of cluster early types are scarce among the general Ðeld population.
To examine the data for evidence of a cluster sequence, we have divided the frame into two regions, one corre-sponding to a 0.4 h~1 Mpc circular aperture at z \ 1.01, centered on the luminous galaxy D (Fig. 9b, below), and an outer region covering the rest of the image. Using the
mag-nitude of galaxy D as its zero point (I\ 21.20, measured using the deconvolved images obtained in ° 6), and adopt-ing a slope of 0.07 at z\ 1.01 (Kodama et al. 1998), the early-type sequence of such a cluster should lie at V[I \ 3.19 [ 0.07(I [ 21.20). Figure 4 shows the posi-tions of the galaxies with magnitudes compatible within their observational error with this relationship, and those of all the stars in the frame (objects with class star higher than 0.95), independently of their color. It is obvious from this Ðgure that a red sequence of galaxies is clustered around D, and also that galaxy D lies on this sequence. The central region has eight such candidates (excluding galaxy D), whereas there are only three such galaxies on the rest of the frame. The central circle contains 54 stars, against 390 detected in all the frame, i.e., the central region comprises only 13.8% of the useful surface in the frame. Thus, there is a factor of B20 overdensity of red galaxies in the central 0.4 Mpc, clear evidence of the existence of a galaxy cluster. A rough estimation of the signiÐcance of this result can be performed using a binomial distribution. The probability of having k galaxies out of a total of n within a region con-taining a fraction p of the total surface is represented by p(n, k) \ Cnk pk(1 [ p)n~k.With n\ 11, k \ 8, and p \ 0.138, we Ðnd p(11, 8)\ 1.4] 10~5, corresponding to a conÐdence
FIG. 4.ÈSpatial distribution of the cluster early-type candidates, rep-resented by Ðlled squares. The empty squares represent the stars detected on the frame. The circle corresponds to a 0.2 h~1 Mpc radius at z \ 1.
level of [99.998%. Figure 3 shows that all but one of the cluster member candidates selected on the basis of V[I, I are also very red inI[Ks. This further supports the idea that these galaxies are physically associated. Independently, in addition to galaxy D, two of our sequence galaxies have spectroscopic redshifts, and both are claimed to lie at z\ 1.0 (Kneib et al. 1998).
An alternative possibility would be the existence of a patch of increased Galactic reddening roughly centered on the lens, which would create an excess of red galaxies. Although very unlikely, this possibility cannot be totally excluded.
In the remainder of this paper, the galaxies listed in Table 1 (except the one not detected in the K band) will be con-sidered cluster members. To estimate their absolute magni-tudes, MV, we use a K-correction of 3.5 at z\ 1.01 for evolved ellipticals (Poggianti 1997), and a distance modulus of 42.75. Galaxy D has a dereddened luminosity of L VD \ 4.16^ 0.21] 1010 h~2L_,and the total luminosity of the detected cluster candidates isL h~2
V\ 1.33 ^ 0.08] 1011 Our detection limit of V \ 27 corresponds to
L_. MV\
[19.25, so to compare this luminosity with the results of Smail et al. (1997 ; hereafter S97), we correct it by inte-grating a Schechter function up to MV\ [18.5, using a\ [1.25 andM measured by S97
V
*\ [20.75 ] 5 log h,
at SzT\ 0.55. The correction amounts to 20% of the total light, and it is quite robust with respect to the exact value of
ranging from 30% for to 10% for
MV*, MV*\ [20.30 MV*\
[21.60. The adopted total luminosity for the cluster early-type population is thus LVE \ 1.6 ^ 0.2 ] 1011 h~2L_. In the cluster sample of S97, the early types contain typically 50% of the total cluster light. Therefore, the total luminosity of the ““ dark ÏÏ cluster would be LVall B 3.2] 1011h~2L_. This value probably underestimates the cluster luminosity, since the fraction of cluster galaxies with star formation, and therefore bluer than the red cluster sequence, is likely to be higher at z\ 1 than at z [ 0.5.
H97 quote a value ofLB\ 2.75] 1010h~2LB_for galaxy D. Since no other obvious cluster galaxy candidates were known, they adopted that value as the total luminosity. Assuming a color ofB for an elliptical at redshift
J[V B 0.6
z\ 1, their value ofLBwould correspond toLVB3] 1010 h~1 L more than order of magnitude lower than our
_,
estimate of the total cluster light.
5
.
X-RAY ANALYSIS
We have reanalyzed the ROSAT HRI archival obser-vations to examine the spatial relationship between the optical and X-ray emission. The HRI data set consists of TABLE 1
CLUSTER SEQUENCE CANDIDATES r (arcsec) I dI V dV K S dKS V[I I[KS MV 00.0 . . . 21.20 0.024 24.38 0.06 17.12 0.02 3.17 4.08 [21.89 12.0 . . . 23.06 0.072 26.09 0.23 19.31 0.11 3.01 3.75 [20.18 12.2 . . . 22.25 0.033 25.40 0.14 19.25 0.08 2.93 3.20 [20.87 14.3 . . . 22.92 0.049 25.92 0.23 19.49 0.09 2.99 3.43 [20.35 24.7 . . . 21.72 0.024 24.91 0.13 18.17 0.04 3.17 3.55 [21.36 24.8 . . . 22.31 0.032 25.39 0.16 19.15 0.08 3.06 2.26 [20.88 25.9 . . . 23.54 0.082 26.71 0.28 19.85 0.14 3.14 3.69 [19.56 38.4 . . . 23.79 0.095 26.61 0.26 [21.70 . . . 2.81 \2.09 [19.66 39.0 . . . 23.63 0.084 26.77 0.30 19.85 0.11 3.12 3.78 [19.50
three separate pointings with ROSAT ID : rh800811n00, rh800811a01, and rh800811a02, with a total exposure time of 79 ks. The X-ray photon Ðles have been processed with standard IRAF-PROS routines, Ðltering out time intervals with high background rates. The resulting coadded image with 4A pixel size has an e†ective exposure time of 56.0 ks, mostly contributed from the A01 and A02 observations. The astrometrical accuracy is found to be better than 5A using two bright X-ray sources coincident with bright stars. A faint source at the 4 p level is detected within 3A of the position of the elliptical D. A second source (D4.5 p) is found 30A to the northeast. The latter seems to be missing in the original analysis by H97. However, inspection of several images obtained by splitting the observation into two time intervals reveal variations in the Ñux of this source, suggest-ing that it might be either variable or spurious, whereas the central source shows a consistent Ñux. Furthermore, the elliptical morphology of the central X-ray source is present in two independent pointings, suggesting that it is not an artifact of the background noise. This central source is the natural X-ray counterpart of the optical cluster and is likely coincident with the ASCA source of H97. The central 3@ of the HRI Ðeld are shown in Figure 5. Corresponding X-ray contours are overlaid on the V IK color image of the Ðeld in Figure 6.
FIG. 5.ÈCentral region of the ROSAT HRI Ðeld smoothed with a Gaussian Ðlter with p\ 6@@, to match the resolution of the HRI data. The source in the lower right box is a simulated pointlike source with the same Ñux encircled by the central source, to show the difficulty of resolving the central X-ray emission.
FIG. 6.ÈROSAT HRI contours overlaid on the optical-IR (V IK) image of the MG 2016 Ðeld. The contours are drawn at 2 p (dashed line) and 3 p levels (smoothing Gaussian scale p\ 8@@). The boxed objects the cluster galaxies candidates belonging to the red V [I sequence listed in Table 1. This Ðgure demonstrates that the red galaxy overdensity is spatially coincident with the central X-ray emission.
We Ðnd 17^ 9 net counts, or a count rate of (3.0^ 1.6)] 10~4 counts s~1 in the central source within a circle of 20A radius (^85 h~1 kpc at z \ 1). The Ñux within a circle of 1@ falls short of the H97 estimate by a factor of 2. Using a Galactic hydrogen column density of NH \1.5 ] 1021 cm~2 and a Raymond-Smith spectrum with T ^ 8 keV, as measured by H97, the program PIMMS for the HRI yields that 1 count s~1 is equivalent to an unabsorbed Ñux of 6.06] 10~11 ergs cm~2 s~1 in the 0.1È2.0 keV band. The Ñux of the central source is FX(\20@@) \1.8 ] 10~14 ergs cm~2 s~1, or an X-ray luminosity at z \ 1 of ergs s~1 in the observed 0.1È2 keV LX(\20@@)\ 1.1] 1044
band. The K-correction amounts to a factor of 1.4, whereas the conversion factor for the 2È10 keV band is D1.6. There-fore,Ls(\20@@)\ (1.1/1.4] 1.6) \ 1.3 ] 1044ergs s~1 in the 2È10 keV rest-frame band. This value is a factor of 3È4 lower than the estimate by H97, even with extrapolation of the Ñux out to 1@, using their assumed surface brightness proÐle. Given the low signal-to-noise ratio (S/N) of the central source, it is not possible to assess its angular extent. This is shown visually in Figure 5, where the HRI point-spread function (PSF) has been used to simulate a source of 17 counts and added to the central region. The comparison between the surface brightness proÐles of the central object and the pointlike (noiseless) source is shown in Figure 7, although at these low S/N levels, proÐle Ðtting is rather meaningless. The spatial analysis of H97 suggested an extended central source. This might be due to the large smoothing scale (FWHM\ 35@@) used by those authors, or to a higher background of our combined X-ray image.
The fact that the X-ray emission of a cluster at z\ 1 is unresolved with the HRI is not surprising, given the severe surface brightness dimming at this redshift (Rosati et al. 1998). However, we cannot rule out a signiÐcant contribu-tion to the X-ray emission from the two lensed QSO images.
FIG. 7.ÈX-ray surface brightness proÐle of the central HRI source. The HRI noiseless PSF for a source of the same Ñux is superimposed (dashed line). The background is equal to D3.6 counts s~1 arcmin~2. The possi-bility that this emission is unresolved is difficult to exclude.
Therefore, the aforementioned X-ray luminosity should be considered an upper limit. Improved observations, ideally spatially resolved spectroscopy, should help to clarify the relation between the hot thermal spectrum observed by ASCA, with its low spatial resolution, and the patchy nature of the much better resolved ROSAT HRI map.
Assuming that the cluster is isothermal and in hydro-static equilibrium, Hattori et al. (1997) estimate the gravita-tional mass within a radius of 0.5 h~1 Mpc to be M \ h~1 where the errors represent the 1.8~0.6`0.9 ] 1014 M_,
uncertainty in the cluster temperature determination, kT \ keV. Assuming MP r, the mass inside a 0.2 h~1 8.6~3.0`4.2
Mpc radius would beM h~1 This
X\ 7.2~2.5`3.5 ] 1013 M_. gives a mass-to-light ratio for AX J2019]112 of MX/L VE \
and
com-448~153`224h (M/LV)
_ M/L Vall \224~78`112h (M/LV)_, patible with the median values for z [ 0.5 clusters (S97) :
and
M/L VE \330~110`210h (M/L V)_ M/L Vall\ 180~80`140h (M/L V)_.
6
.
WEAK-LENSING ANALYSIS
The observations are of sufficient depth and resolution to allow a useful weak-lensing analysis. The procedure for measuring the lensing signal is standard, and follows that employed in other cluster lensing studies (e.g., Squires et al. 1996). Our object Ðnding and analysis employed the IMCAT software developed by N. Kaiser (Kaiser, Squires, & Broadhurst 1995 ; hereafter KSB). Correction for PSF anisotropy and circularization due to seeing was made with the standard formalism of KSB and Luppino & Kaiser (1997), with corrections noted in Hoekstra et al. (1998). The correction for these systematics is very robust, due to the very regular PSF in the Ðnal coadded images and the over-abundance of stars in this Ðeld. The residual ellipticity in the corrected star catalog is less than 0.1% over the full Ðeld, and so the residual systematic shape distortion in the galaxy catalogs is completely negligible.
Using the standard unbiased inversion algorithm (e.g., Kaiser & Squires 1994 ; Squires & Kaiser 1996) and the f statistic, we determine the cluster surface density from the corrected galaxy shape measurements. For I \ 25, we Ðnd a null detection of the cluster mass distribution, both in a two-dimensional mass map and in the radially averaged mass proÐle.
This null detection allows us to place an interesting upper limit on the cluster mass, albeit in a model-dependent fashion. For example, assuming the cluster follows an isothermal proÐle, o(r)\ pv2/2nGr2,where pvis the line-of-sight velocity dispersion, our data are of sufficient depth to detect the signal from a 1000 km s~1 singular isothermal sphere (SIS) cluster at the 3 p level at r\ 1@ and at the 2 p level at r\ 2@, for b \ 0.2. In terms of mass, for a cluster with p\ 1300 km s~1 (typical of clusters with TXB8.5 keV), this model yields
M 3D\1.6] 1014
A
p 1300 km s~1B
2A
b 0.2B
~1 ]A
r 200 h~1 kpcB
h~1 M_, (1) where b describes the average relative distance between the lens and the source galaxies. For I \ 25 and for plausible cosmologies and star formation models, b ranges between 0.16 and 0.23, so the above result should be quite robust.This result sets the constraintM/L Vall \520h (M/L V)_ inde-pendently of the X-ray and strong lensing estimates.
7
.
IMAGE DECONVOLUTION
The data can also be used to study the immediate environment of the lens, which shows many interesting lensing features. First, we deconvolve the Keck V and I images using the MCS algorithm (Magain, Courbin, & Sohy 1998). Since several individual dithered frames were available, the simultaneous deconvolution capability of the algorithm can be applied to improve not only the resolution of the images, but also the sampling. A total of four images were used in the V and I bands, which allows an e†ective reduction in the pixel size of the data to0A.108in the decon-volved combined image, compared to the intrinsic instru-mental scale of 0A.215 per pixel. In principle, the fundamental limitation in resolution is imposed by the Nyquist frequency set by the adopted sampling in the deconvolved frame, i.e., 2 pixels FWHM. Since the present images show sharp, high-frequency structures, we found it reasonable to limit ourselves to a resolution of 3 pixels FWHM, or 0A.32, in both bands to avoid recovering spu-rious high-frequency spatial structure too close to the
Nyquist limit. Note that this strict adherence of the decon-volution to this fundamental limitation distinguishes the MCS method from other deconvolution procedures, in which sharp noisy backgrounds are formed, generating spurious structure.
The simultaneous deconvolution of the frames was per-formed as in Courbin et al. (1998a, 1998b). The Ðnal decon-volved frames are displayed in Figure 8 together with the stacks of the four original images. Given the low Galactic latitude of Q2016]112, many stars are available in the immediate vicinity of our target. Accurate PSFs can there-fore be constructed for all the images in the stack. The residual maps obtained after deconvolution were satisfac-tory for all frames in the V and I data sets. However, because the central part of the main lensing galaxy (object D) is very sharp in the I band, we choose to model it as a point source plus a di†use background. This certainly does not mean that the core of the lens is actually a point source ; we model it as such to exclude the spurious high spatial frequencies it would otherwise introduce.
The deconvolution procedure returns the astrometry and photometry of the point sources and decomposes the Ðnal image into a sum of point sources plus a di†use back-ground. A major advantage over other deconvolution
algo-FIG. 8.ÈTop: Stack of four I-band Keck/LRIS images of Q2016]112 with a seeing of0A.6and pixel size of0A.215.The simultaneous deconvolution of the four frames is shown on the right with a resolution improved to0A.32and a Ðner pixel size of0A.108.Bottom : Stack of four V -band images and their simultaneous deconvolution. Note the obvious arc feature lying below the two QSO images, which modeling shows is an image of the central region of the host galaxy of the QSO. This arc is resolved in both the radial and tangential directions, indicating a Ñat central potential.
rithms is that the resulting deconvolved images allow accurate aperture photometry for the extended objects, free of signiÐcant light contamination by bright point sources such as QSOs. This decomposition capability allows us to derive accurate magnitudes for the lensing galaxy, especially in the V band, since it is heavily contaminated by image B at this wavelength.
A summary of the photometry is given in Table 2, includ-ing the well-resolved bright arc apparent below the two QSO images, as discussed below.
Recent NICMOS2 archival images (ID 7495 ; PI, E. Falco) are consistent with the above deconvolution in the near-IR, showing very clearly the main arc below the central luminous galaxy, despite the poor PSF of images taken prior to the refocusing of the instrument, indicating that the arc is relatively red. The H-band (F160W) image is shown in Figure 9a for comparison. This extended IR feature was also noted by Langston et al. (1991) in high-quality ground-based IR images. Both the NICMOS2 and
FIG. 9.ÈTop: Figure corresponding to the NICMOS H-band image of Q 2016]112. Bottom: Lens model with the source, critical curve, and caustic superposed on the magniÐcation Ðeld. The colors of the source represent three regions ; the bright central spot indicates the location of the QSO, which must lie just outside the caustic, generating only two images ; the lower surface brightness region crossing the caustic represents the central host galaxy, which forms the optical-IR arc. The center of the arc is coincident with the extended radio source, C ; this radio emission maps back to a region of the source immediately inside the caustic, very close to but distinct from the central QSO.
TABLE 2
OBJECTS AROUND GALAXY D IN THE I-BAND FRAME Object I dI V dV A . . . 22.11 0.03 22.10 0.01 B . . . 22.19 0.03 22.56 0.01 C . . . 22.08 0.03 23.46 0.02 CA . . . 22.80 0.06 25.02 0.07 D . . . 21.20 0.02 24.38 0.05
our Keck images reveal the existence of a faint object to the right of and below the main arc, which we call CA (Table 1).
8
.
LENS MODEL
The lens was originally discovered in the radio, as a close pair of bright Ñat-spectrum sources (Lawrence et al. 1984) separated by 3A. These bright radio components, A and B, are accurately coincident with optical QSOs (Schneider et al. 1985). A third radio image, C, (Fig. 9a) lies nearby and is resolved with VLBI into four knots along a line of only 0A.1. These knots have a Ñatter spectrum than A or B, so that their relation to the QSO is not clear (HeÑin et al. 1991 ; Garrett et al. 1994, 1996 ; Nair & Garrett 1997). In addition, image C is coincident with the center of an arc found in K-band imaging (Langston, Fischer, & Aspin 1991) and clearly conÐrmed in an HST NICMOS exposure shown in Figure 9a. The optical counterpart of their K-band arc is clearly seen in our deconvolved images, which show that it is resolved in the radial as well as the tangential direction. The redshift of the lens and the source were measured by Schneider et al. (1985) to be z\ 1.01 and z \ 3.2, respec-tively.
Here we show that the various images are relatively simply related if the lensed QSO and its host galaxy lie close to the caustic of the lens, so that di†erent parts of the source are magniÐed by di†erent amounts. The lens model is kept as simple as possible. In addition to the usual choice of variables, i.e., position, position angle, surface density nor-malization, and mass ellipticity, we also allow the slope of the mass distribution to vary. This is motivated in part by the recent realization that massive objects have central mass proÐles that depart from the usual scaling solution (Broadhurst et al. 1999), becoming Ñatter in the core than an isothermal model, with a slope c \ 1 for the projected surface mass density distribution, &(h)P h~c. Figure 9b shows our best Ðt for the lens features. All are easily reconci-led in the context of this simple model, provided that the slope of the mass distribution is relatively Ñat (c D 0.4). The tolerance on the slope is roughly ^0.1, depending on the ellipticity. These two parameters can be traded over a limited range and reproduce the location of the three images and the position angle (P.A.) of the arc. Fixing the ellipticity of the arc to match that of the optical light, e\ b/a\ 0.7, requires a slope c \ 0.37. The central position and the P.A. of the mass distribution for the best Ðt are consistent with those of the central elliptical galaxy.
The radial extent or thickness of the arc would be greater for a Ñat proÐle, where the magniÐcation is given by a power law, so the fact that object C is resolved supports a Ñat central slope, assuming that the source is relatively sym-metric. The radio and optical lensing features can be easily reconciled in more detail when the structure of an active
galactic nucleus (AGN) is considered. If the QSO lies just outside the caustic, then only two images of such a small source form in both the optical and the radio. The outer central region of the host galaxy must extend over the caustic, so that the arc is a third image, but only of the region of the host projected inside the caustic. This must also be true of the radio emission that lies in the center of the arc ; image C arises naturally in the context of this model from extended radio emission that originates in a region closer to the QSO than most of the optical arc light, but is spatially distinct from the QSO, since it must project inside the caustic.
The best-Ðt model magniÐcations of the radio and optical images of the QSO images, A and B, are 8.5 and 6, respec-tively. The magniÐcation of the radio source C is much greater. Its location at the center of the arc means that this region of the radio emission straddles the caustic, gener-ating a high overall magniÐcation of D40 for the four knots. The radio emission could arise from within the gen-erally di†use radio emission typically found in the central kpc of an AGN, or it may be an image of a jet. This model is most similar to that of Langston et al. (1991), requiring the source to sit on the caustic, and quite unlike the multiple-component model suggested by Narasimha, Subramanian, & Chitre (1987).
The mass contained within the critical radius is virtually independent of the mass distribution, 1.6^ 0.2] 1013 h~1 depending somewhat on cosmology through the ratio M_,
of sourceÈlens/source distances, due to the relatively high redshift of the lens. Taking into account the luminosity of the central elliptical LVD \ 4.16 ^ 0.21 ] 1010 h~2L the
_, above value deÐnes a very robust value of the mass-to-light ratio within the critical radius M/L D \ 389~45`45h (M/LV)_.
Interestingly, the mass proÐle advocated by Navarro, Frenk, & White (1997) tends to a similar Ñat slope at the critical radius, when integrated in projection &(h)P h~0.3 and normalized to the mass contained within the critical radius, for a reasonable choice of parameters,rs\ 100kpc and d Extrapolating to a larger radius using this
c\ 3000.
proÐle yields a massM\ 1.2~0.3`0.3 ] 1014h~1M_within a radius of 0.2 h~1 Mpc, assuming circular symmetry, con-siderably higher than an extrapolation of a purely isother-mal proÐle, which has a steeper slope within this radius. This mass is compatible with the X-ray estimate of H97, and yields a mass-to-light ratio of M/L V \ 372~94`94h using our estimate of the cluster luminosity, where (M/L V)_
the uncertainty in the mass lies mainly with the unknown ellipticity of the mass distribution at large radius.
9
.
CONCLUSIONS
We Ðnd clear evidence for a distant cluster of galaxies centered on the QSO lens and luminous X-ray source AX J2019]112. A tight red sequence of galaxies is detected within a radius of 0.2 h~1 Mpc of the known z \ 1.01 ellip-tical lensing galaxy, with a color and slope indicative of a cluster at z\ 1. We estimate the rest-frame V -band lumi-nosity of the cluster early types within a 0.4 h~1 Mpc
aperture to be L h~2 and the
V
E \ 1.6 ^ 0.2 ] 1011 L _,
luminosity from all galaxy types to beLVB3.2] 1011h~2 This is an order of magnitude larger than the lumi-L
_.
nosity estimates previously published for this cluster. If we use the X-ray mass estimates of H97 based on the estimated gas temperature, the mass-to-light ratio within 0.4 h~1 Mpc
is M/L V \ 224~66`95h (M/LV) similar to massive
_, z [ 0.5
clusters. From a weak-lensing analysis it can also be estab-lished, independently of the X-ray mass estimate, that for an isothermal cluster, M/L V \ 520h
A
1300 km s~1pB
2A
b 0.2B
~1 ]A
r 200 h~1 kpcB
hA
M L VB
_ .The observation of a radially resolved optical arc in the cluster center and the detailed model Ðt to this and the two QSO images requires that the core of the mass distribution be much Ñatter than isothermal. This analysis allows us to set a robust value of the mass-to-light ratio within the criti-cal radius M/L V \ 389~53`53h(M/LV)_. The inferred surface mass distribution is very Ñat, &P h~0.3, and consistent with the Navarro et al. (1997) proÐle for reasonable choices of the core radius and central density. An extrapolation of this proÐle to larger radius yields a mass-to-light ratio M/L V \within a 200 h~1 kpc aperture. 372~94`94h(M/LV)_
We have reanalyzed the HRI X-ray data and raise the possibility that the X-ray luminosity of the cluster should be
signiÐcantly revised downward. A clear source of emission is spatially coincident with the cluster center. Two other sources of emission are probably unrelated, but are smoothed together in the map of Hattori et al. (1997), com-prising 50% of their X-ray Ñux estimate. Furthermore, we cannot exclude the possibility that the lensed QSO makes a signiÐcant contribution to the X-ray Ñux in the center. Higher quality spatially resolved X-ray spectroscopy is needed to understand the relation between the large beam measurement of a hot thermal spectrum observed by ASCA and the clumpy nature of the higher resolution ROSAT HRI maps. Deeper HST images would also be of interest in obtaining a better mass estimate for this cluster from weak lensing. Less than a handful of massive clusters are known at z^ 1, none of which have secure measurements of mass.
N. B. acknowledges a Basque Government postdoctoral fellowship. T. J. B. and N. B. acknowledge a LTSA grant NASA NAG-3280. F. C. is supported by contracts ARC 94/99-178 ““ Action de Recherche Concertee de la and dÏAttraction Inter-Communaute FrancÓaise ÏÏ Poüle
universitaire P4/05 (SSTC, Belgium). We thank Doug Fink-beiner for providing the high-resolution extinction estimate. REFERENCES
Bahcall, N. A., & Fan, X. 1998, ApJ, 504, 1
Bartlett, J. G., Blanchard, A., & Barbosa, D. 1998, A&A, 336, 425 Bertin, E., & Arnouts, S. 1996, A&AS, 117, 393
Broadhurst, T., Huang, X., Frye, B., & Ellis, R. 1999, preprint (astro-ph/9902316)
Burstein, D., & Heiles, C. 1982, AJ, 87, 1165
Courbin, F., Lidman, C., Frye, B. L., Magain, P., Broadhurst, T. J., Pahre, M. A., & Djorgovski, S. G. 1998a, ApJ, 499, L119
Courbin, F., Lidman, C., & Magain, P. 1998b, A&A, 330, 57
Dickinson, M. 1995, in ASP Conf. Proc. 86, Fresh Views of Elliptical Galaxies, ed. A. Buzzoni, A. Renzini, & A. Serrano (San Francisco : ASP), 283
Eke, V. R., Cole, S., Frenk, C. S., & Henry, J. P. 1998, MNRAS, 298, 1145 Ferreras, I.,Ben•tez,N., &Mart•nez-Gonzalez,E. 1998, A&A, 333, 43 Garrett, M. A., Muxlow, T. W. B., Patnaik, A. R., & Walsh, D. 1994,
MNRAS, 269, 902
Garrett, M. A., Porcas, R. W., Nair, S., & Patnaik, A. R. 1996, MNRAS, 279, L7
Hattori, M., et al. 1997, Nature, 388, 146 (H97)
HeÑin, M. B., Gorenstein, M. V., Lawrence, C. R., & Burke, B. F. 1991, ApJ, 378, 519
Hoesktra, H., Franx, M., Kuijken, H., & Squires, G. 1998, ApJ, 504, 636 Jones, M. E., et al. 1997, ApJ, 479, L5
Kaiser, N., & Squires, G. 1994, ApJ, 404, 441
Kaiser, N., Squires, G., & Broadhurst, T. 1995, ApJ, 449, 460
Kneib, J.-P., Soucail, G., Jaunsen, A., Hattori, M., Hjorth, J., & Yamada, T. 1998, CFHT Inf. Bull. 38
Kneissl, R., Sunyaev, R. A., & White, S. D. 1998, MNRAS, 297, 29 Kodama, T., Arimoto, N., Barger, A. J., &Aragon-Salamanca, A. 1998,
A&A, 334, 99
Langston, G., Fischer, J., & Aspin, C. 1991, AJ, 102, 1253
Lawrence, C. R., Schneider, D. P., Schmidt, M., Bennett, C. L., Hewitt, J. N., Burke, B. F., Turner, E. L., & Gunn, J. E. 1984, Science, 223, 46
Luppino, G. A., & Kaiser, N. 1997, ApJ, 475, 20 Magain, P., Courbin, F., & Sohy, S. 1998, ApJ, 494, 472 Moorwood, A., Cuby, J. G., & Lidman, C. 1998, ESO Mess., 91, 9 Nair, S., & Garrett, M. A. 1997, MNRAS, 284, 58
Narasimha, D., Subramanian, K., & Chitre, S. M. 1987, ApJ, 315, 434 Navarro, J. F., Frenk, C. S., & White, S. D. M. 1997, ApJ, 490, 493 Oke, J. B., et al. 1995, PASP, 107, 375
Persson, S. E., Murphy, D. C., Krzeminski, W., Roth, M., & Rieke, M. J. 1998, AJ, 116, 2475
Poggianti, B. M. 1997, A&AS, 122, 399
Richards, E. A., Fomalont, E. B., Kellermann, K. L., Partridge, R. B., & Windhorst R. A. 1997, AJ, 113, 1475
Rosati, P., Della Ceca, R., Norman, C., & Giacconi, R. 1998, ApJ, 492, L21 Rosati, P., Stanford, S. A., Eisenhardt, P. R., Elston, R., Spinrad, H., Stern,
D., & Dey, A. 1999, AJ, 118, 76 Saunders, R., et al. 1997, ApJ, 479, L5
Schlegel, D. J., Finkbeiner, D. P., & Davis, M. 1998, ApJ, 500, 525 Schneider, D. P., Lawrence, C. R., Schmidt, M., Gunn, J. E., Turner, E. L.,
Burke, B. F., & Dhawan, V. 1985, ApJ, 294, 66
Smail, I., Ellis, R. S., Dressler, A., Couch, W. J., Oemler, A., J., Sharples, R. M., & Butcher, H. 1997, ApJ, 479, 70 (S97)
Smail, I., Hogg, D. W., Yan, L., & Cohen, J. G. 1995, ApJ, 449, L105 Squires, G., & Kaiser, N. 1996, ApJ, 473, 65
Squires, G., Kaiser, N., Babul, A., Fahlman, G., Woods, D., Neumann, D. M., &Bohringer,H. 1996, ApJ, 461, 572
Stanford, S. A., Eisenhardt, P. R., & Dickinson, M. 1998a, ApJ, 492, 461 Stanford, S. A., Elston, R., Eisenhardt, P., Spinrad, H., Stern, D., & Dey, A.
1998b, in ASP Conf. Ser. 146, The Young Universe : Galaxy Formation and Evolution at Intermediate and High Redshift, ed. S. DÏOdorico, A. Fontana, & E. Giallongo (San Francisco : ASP), 514
![FIG. 2.ÈColor-magnitude diagram for the central 0.4 h~1 Mpc region around Q2016]112 (left) and for the rest of the frame (right)](https://thumb-eu.123doks.com/thumbv2/123doknet/6587126.178632/4.918.196.707.71.596/fig-ècolor-magnitude-diagram-central-region-frame-right.webp)