A real-time grading method of apples based on features extracted from defects
V. Leemans* ; M.-F. Destain
Unité de Mécanique et Construction, Gembloux Agricultural University, Passage des Déportés, 2, B-5030 Gembloux, Belgium; email of corresponding author : [email protected]
"http://www.fsagx.ac.be/me/index.htm"
Abstract
This paper presents a hierarchical grading method applied to Jonagold apples. Several images covering the whole surface of the fruits were acquired thanks to a prototype grading machine. These images were then segmented and the features of the defects were extracted. During a learning procedure, the objects were classified into clusters by k-mean clustering. The classification probabilities of the objects were summarised and on this basis the fruits were graded using quadratic discriminant analysis. The fruits were correctly graded with a rate of 73 %. The errors were found having origins in the segmentation of the defects or for a particular wound, in a confusion with the calyx end.
Keywords
Grading, classification, machine vision, apples
1. Introduction
Fresh market fruits like apples are graded into quality categories according to their size, colour and shape and to the presence of defects. The two first quality criteria are actually automated on industrial graders, but fruits grading according to the presence of defects is not yet efficient and consequently remains a manual operation, repetitive, expensive and not reliable.
The grading of apples using machine vision can be arbitrarily divided into four steps : the images acquisition, their segmentation, their interpretation and finally the fruit classification. This paper
presents the three former points on the basis of a literature review, the research results being focused on the last point : having extracted data from images acquired on fruits, the paper describes a grading method which was implemented on an existing machine and tested on Jonagold apples (bi-colour fruits).
1.1. Images acquisition
The first step consists of acquiring images of the surface of the fruit, while it goes through the grading machine. In order to grade apples, two requirements have to be met : the images should cover the whole surface of the fruit; a high contrast has to be created between the defects and the healthy tissue, while maintaining a low variability for the healthy tissue.
On the common systems, the fruits placed on rollers are rotating while moving. They are observed from above by one camera. In this case, the parts of the fruit near the points where the rotation axis crosses its surface (defined as rotational poles) are not observed (Wen & Tao, 1998). This can be overcome by placing mirrors on each side of the fruit lines oriented to reflect the pole images to the camera. Another system was presented by Guedallia (1997). He used three cameras observing the fruit rolling freely on ropes. On more sophisticated systems, two robot arms were used to manipulate the fruit (Moltó, Blasco & Benlloch, 1998). The study stated that it was possible to observe 80% of the fruit surface with four images, but the classification rate remained limited to 0.25 fruit per second (Moltó et al., 1998).
The purpose of the lighting system is to provide radiant light with suited spectral characteristics and a uniform spatial repartition. To be independent from the irradiance variations, Yang (1994) used flooding segmentation algorithms. In the device presented by Wen & Tao (1998) and Tao & Wen (1999), the light came from above the four grading lines. They also developed algorithms to compensate the variation observed from the centre of the fruit to the boundaries (Wen & Tao, 1998 ; Tao & Wen, 1999). Miller & Drouillard (1997) and Leemans, Magein & Destain (1998) used devices elongated along one grading line, equipped with lighting tubes, diffusers and reflectors
to provide a uniform irradiance. Moltó et al. (1998) described a hemispherical lighting chamber. The fruit was placed at the centre of the chamber and the light coming from a circular tube was diffused by the inner walls of the chamber. Yang (1993) used a structured lighting combined with a diffuse lighting system to make clearly visible the calyx or the stem ends of apples.
The cameras used by different researchers were mainly charge coupled devices (CCD) cameras. Yang (1993) used monochrome cameras, Wen & Tao (1998) used a monochrome CCD camera equipped with a 700 nm long pass filter, while many others acquired colour images (Schreven & Raeymakers, 1992 ; Singh, Delwiche, Johnson & Thompson ; 1992, Heinemann, Varghese, Morrow, Sommer & Crassweller, 1995 ; Leemans et al., 1998 ; Moltó et al., 1998). Guedalia (1997) used three monochrome cameras with an optical device projecting four times the same views with different bandwidths on one CCD. Wen & Tao (2000) combined a near infrared camera and a mid infrared camera, in order to point the calyx and the stem ends out. Moltó, Blasco & Aleixos (2000) combined a colour and a near infrared camera.
1.2. Image segmentation
The images resulting from the previous step present from one to four planes. The two most common configurations are the monochrome images (one plane) and the colour images (three planes, the red, green and blue channels). The result of the image segmentation can be expressed as a monochrome image with the different regions having different grey levels. These regions are the background, the healthy tissues of the fruits, the calyx and the stem ends and possibly some defects. The contrast between the fruit and the background should be high to simplify the localisation of the fruit. This is usually carried out by a simple threshold. Nevertheless, as defects or the calyx and the stem ends could present luminances comparable with the background, Moltó et al. (1998) described the fruit as an ellipse which was the region of interest used for the defect detection.
The next step is the separation of the defects from the healthy tissue. It is also necessary to distinguish the defects from the calyx and stem ends, which may present similarities in terms of
luminance and shape.
On monochrome images, as described by Yang (1994) and Yang & Marchant (1996), the apple appears in light grey, the mean luminance of the fruit varies with its colour and decreases from the centre of the fruit to the boundaries. The lenticels look like unevenness which could be assimilated to noise. The defects are usually darker than the healthy tissue but their contrast, shape and size may vary strongly. For these reasons, Yang (1994) reckoned that simple techniques such as thresholding or background subtraction would give poor results while pattern recognition techniques would be unusable. He also declared that a global approach like the computation of parameters (mean or standard deviation for example) on the whole surface of the fruit is more suitable for large and diffuse defects, while textural techniques would be more convenient for spotty defects (Yang, 1994). The global parameters seem however not relevant if other objets, like the stem or the calyx, are present on the image. After a pretreatment consisting of a median filter followed by a Gaussian filter, Yang & Marchand (1996) used the flooding technique to detect the patch-like defects, where the defects were considered as catchment basins. The detection was enhanced by using active contours algorithm (Yang & Marchant, 1996). Some small over-segmentation areas were removed by applying a threshold on the depth or the volume of the basins. These studies (Yang, 1994 ; Yang & Marchand, 1996) did not concern bicolour fruits like Jonagold apples.
Two different statistical techniques were used to segment colour images. In the first group, supervised techniques can be found (supervised techniques tend to reproduce a classification or a segmentation given by an operator while unsupervised technique produce a classification on their own). Nakano (1997) used neural networks (perceptrons) to classify pixels into six classes including a “defect” class. Moltó et al. (1998) used machine vision to measure several external characteristics of fruits (oranges, peaches, apricots, apples or tomatoes), i.e., size, shape, ground colour and blush (for bicolour fruits) and the presence of defects, the size of the biggest defect and the presence of the stem and its position. The segmentation was supervised, based on Bayes'
theorem and multi-normal frequency distributions. Leemans, Magein & Destain (1999) applied the Bayes' theorem on Jonagold apples (bicolour) while the probability distributions of the healthy tissue and the defect were considered as non Gaussian and modelled numerically using the kernel method. A local enhancement was applied to remove some of the over-segmentation.
In the second group, unsupervised methods were proposed. Leemans et al. (1998) detected defects on Golden apples by computing the Mahalanobis distance from the median colour of the fruit and the colour of the considered pixel and by applying a threshold on this distance. Two enhancement steps (on the basis of global information and the second based on local information) were applied. The method was unsupervised since it required once the computation of the statistical parameters characterising the fruits’ colour and consequently did not require to grade pixels into a “defect” or an “healthy” class.
1.3. Image interpretation
The next steps extract the relevant information from the regions segmented earlier and synthesise it for a whole fruit, i.e. for several images.
Studies like those presented by Miller (1995) on citrus or Heinemann et al. (1995) on apples used global measurements (computed on the whole fruit, without segmentation of the defects) to evaluate the fruit’s quality, but these techniques seemed too simple to be efficient if the reflectance of the fruit is uneven, as for bicolour apples or for apples randomly presented to the camera.
Yang (1993) used neural networks to classify segmented areas as patch-like defects, elongated defects or non-defective areas but did not address the question of the fruit grading. Guedalia (1997) and Nakano (1997) used neural classification based on features extracted after defect detection. Leemans, Magein & Destain (2000) classified the defects in classes according to the European standards (major defects, minor defects, russet, scab, calyx or stem ends and over segmentation). The class of the fruit's image was then selected according to the presence of defects, their category and size.
Moltó et al. (2000) considered several images of a fruit and made the fusion at the image level : on each image, the fruits were detected, an area of interest was “cut” for each fruit and accumulated until the fruits had made a revolution. The result was a single image (image strip) representing the skin deployed. However Moltó et al. (2000) did not present precisely the percentage of the fruit surface which was observed. As a single camera (a compound four bands, red, green, blue, infrared) was used and placed at the vertical of the grading line, the areas located at the extremities of the rotation axis were probably not observed.
As it may be seen, most researchers (except the last ones) did not consider how to manage several images representing the whole surface of the fruit. It seems that each image was treated separately and that the fruit was classified according to the worse result of the set of representative images. The objective of this paper was thus to present a method to combine the data extracted from the different images of a fruit moving on a machine in order to dispose information related to the whole surface of the fruit. Therefore it would be possible to build a fruit database from which grading can be operated. The method was applied on Jonagold apples characterised by green (‘ground colour’) and red (’blush’) colours.
2. Materials and methods
2.1. The hardware
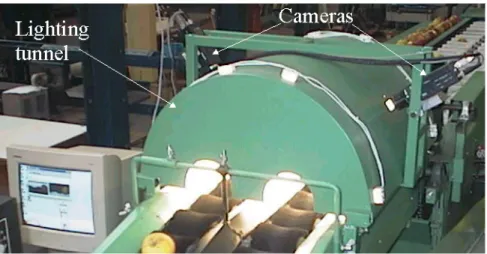
The lighting and image acquisition system were designed to be adapted on an existing double row grading machine (prototype from Agra, Belgium). Four lighting tubes (18W, type 33 from Philips, Netherlands) were placed at the inner side of a lighting tunnel while two cameras (colour 3CCD CX003-P from Sony, Japan) inclined at about 45° observed the grading lines from outside the tunnel, as shown in Figs. 1 and 2. The lighting tunnel is 690 mm in length and 600 mm in width. The images were grabbed using two Picolo frame-grabbers (Euresys, Belgium), the standard image treatment functions were based on the EasyLib libraries (Euresys, Belgium) and the other algorithms were implemented in C++. The central processing unit of the computer was a Pentium
III (Intel, U.S.A.) clocked at 667 MHz.
The fruits were moving on rollers with a rate of 1.53 Hz, the image acquisition rate was 11.1 images per second and per camera. The rotational speed of the rollers was adjusted in such a way that a spherical object having a diameter of 72 mm made a rotation in exactly four images.
2.2. The basic concepts
The program driving the grading machine was designed to work under two modes. During the learning mode, the operator fed the machine with fruits of known categories and representatives of these categories. When all the fruits were presented to the machine the program was instructed to “compile” the data and was then ready for the run mode. The latter attempted to reproduce the classification of the operator when fruits were presented to the machine. The classes were thus not defined once but were instead defined by the user to allow high flexibility.
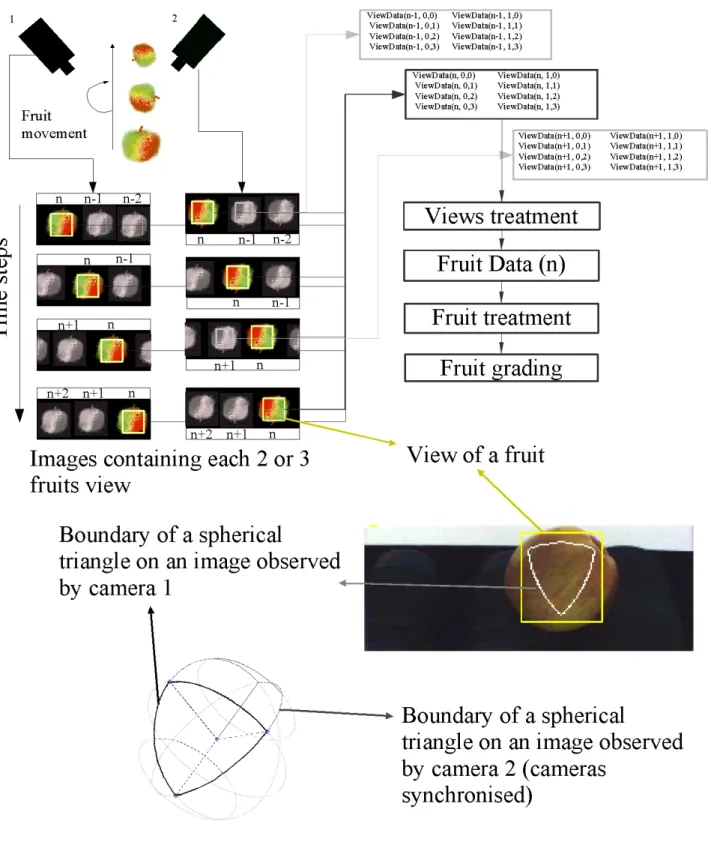
Fig. 3 details the treatment of the information after image acquisition. In the first step the images were segmented to reveal the fruits. The position and diameter of the fruits were measured. On the basis of the diameter, the rotational speed of the fruit was determined. Two regions of interest were attributed to each fruit in the images (up to two fruits could be completely presented in an image). The first region was based on a spherical model of the apple spinning without significantly slipping or rocking on the rollers during one turn. The shape of this region was the projection of a spherical triangle on the CCD. Its base should be placed on the “equator”, dividing the fruit into two hemispheres observed respectively by each camera (see Fig. 3). The apex opposite to this base would be at a rotational pole of the fruit. The width of the base is adjusted to cover the rotation of the fruit between the previous image of the same fruit and the actual one (for the first image, it is adjusted at a theoretical value). The important point is that the set of these triangles computed on several pairs of images should not overlap and should cover the whole surface of the fruit. The second region of interest was rectangular, parallel with the image and was surrounding the triangle by at least 5 pixels in all the directions (Fig. 3). This region is called the view in the rest of this
paper.
The different views present in the image were then segmented as described by Leemans et al. (1999). The regions issued from the segmentation process including the defects, over-segmentation and calyx and stem ends are hereafter called blobs. They were characterised using colour, position, shape and texture features (details follow). The data of the blobs having their gravity centre inside the triangle were accumulated with the data from the other images of the same fruit. When enough views were treated so that the corresponding triangles cover the whole surface of the fruit, the data were processed. In the learning mode, the data were stored with the fruit category. At the end of this mode the discriminant analysis computations (details of the different steps follow) were carried out off line (compilation of the data). In the run mode, the blobs were classified according to their features, based on which the fruit was graded.
2.3. Features extraction and processing
After the segmentation of the views, the blobs were characterised by 16 features describing their : colour : the mean values for the red channel rm, the green channel gm and the blue channel bm ; a
colour index representing the background colour G ; and the Euclidean distance between the fruit background colour and the defect mean colour lG,D ;
shape : the fourth root of the area A¼ ; the square root of the perimeter p½ ; the major inertia moment Imaj ; and the ratio of the inertia moments RI ;
texture : the standard deviations for the red channel rsd , for the green channel gsd , and for the blue channel bsd ; the mean value for the gradient computed on the red channel rgrad ; and the standard deviation for the gradient computed on the red channel rgrad,sd ;
position : the Cartesian co-ordinates of their gravity centre gx and gy, parallel to the view boundaries.
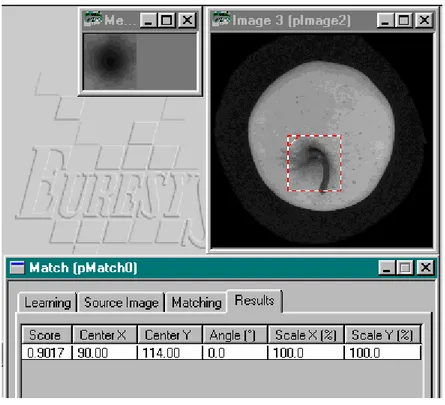
correlation technique (EasyMatch from the Easylib libraries, Euresys, Belgium). The pattern was an average of five calyx images. This algorithm returned the position and a correlation score ranging from 0 (when there was absolutely no correlation) to 1 (when the pattern and the image matched perfectly). The pattern and a sample of detection result is shown in Fig. 4.
At this stage, the blobs extracted from the different views of the fruit were represented in the same database, but their position were measured in co-ordinates systems linked to each view. This situation was hill adapted to compute, for example, distances between blobs. The position of these blobs were thus expressed in a unique coordinate system, linked the fruit. Moreover, the relation between the blobs and the calyx and stem position detected by correlation were unknown. For these reasons, the co-ordinates of all these elements were transposed in a spherical co-ordinate system centred on the fruit's gravity centre and having the calyx and the stem ends on its polar axis. In this system, the co-latitude of the gravity centre of blobs (the angle between the nearest pole and the blob) was a measure of the proximity between a blob and the calyx or the stem end.
2.4. The fruit grading
Each blob was then characterised by 15 parameters : five for the colour, four for the shape, five for the texture and only one for its position. This database was a dynamic table, having a length equal to the number of blobs. The table was quite short for healthy fruits but included more than a hundred parameters for some kinds of defects. Classifiers like discriminant analysis or neural networks do not accept dynamic tables and the data need to be summarised. Several tests using principal component analysis gave only poor results. Defect recognition methods such as those presented by Leemans et al. (2000) are heavy tasks in the sense that an expert has to classify all the blobs of the training set of fruits, which means classifying several thousands of objects. This heavy task was thus made in an unsupervised way, that is, using k-mean clustering on the blob features of all the fruits of the training set, as presented in Leemans, Magein & Destain (2002). The number of clusters nc was fixed by preliminary studies to 16 for the variety Jonagold. When the clusters were
defined, the decision rules to put a blob in a cluster were computed by linear discriminant analysis. For each fruit and for each of these clusters, the sum of the a posteriori classification probabilities and the standard deviation of these probability were computed, giving a static table comprising 2*nc parameters to characterise the fruit. A principal component analysis was carried out and the ncp first principal component representing 97 % of the whole variation were used to compute a quadratic discriminant analysis to finally grade the fruits.
The computation of these parameters (the k-mean clustering, the blob and the fruit discriminant analyses) were made off-line by the program, during the “compilation” at the end of the learning mode. During the “run” mode, the blobs and afterwards the fruits were graded in-line using the parameters of the discriminant analysis.
All the fruits used in this experiment came from the same grower. The fruits were used in only one experiment and each fruit was thus presented only once to the machine, to avoid any additional bruises. Although the program was designed to manage up to four fruits categories, it was found very difficult to obtain enough fruits in intermediate categories and the apples were thus classified into two classes, I (accepted with slight skin defects) or rejected. The experimentation was carried out with a growing sample size for the learning mode from 50 up to 300 fruits and a sample size around 60 up to 100 fruits for the validations. In both cases the two classes were equally shared. The defects encountered on these sets of fruits were hail damages, wounds, russet, bruises and rub damages.
3. Results and discussion
The best results were obtained with a hundred fruits for the learning set. The confusion matrix for the corresponding validation set is given in Table 1. The error rate reached 27 % and most of these were fruits with defects which were accepted. When these errors were analysed, half of the errors were fruits with few small defects, as slight hail damages, which were accepted. This kind of fruits is often encountered in class I. The other half was due to two reasons. Firstly, defects difficult to
segment, like russet or bruises, were observed in class I. This may be explained as russet presented a colour very similar to the healthy tissue of Jonagold apples (particularly to the transition between the ground colour and the blush) while bruises may be difficult to distinguish when they are recent. Secondly, errors were due to wounds probably caused by birds. These defects were rather bright and always present in the upper part of the fruits. They have almost the same appearance as the russet around the stem end and, because of the proximity in position and appearance, were probably confused with the latter.
The sample size influenced the correct classification rate and it was observed that the maximum was reached when analysing 100 fruits during the learning process. For smaller sample size, the correct classification rate was lower, and a standstill was observed above, which could indicate that all the variability observed in these specific conditions (grower and moment) was represented in the sample size of 100 fruits.
4. Conclusions
The grading of apples into quality classes is a complex task involving different stages. The prior step is the images acquisition, which was performed by CCD cameras during the motion of the fruit on an adapted commercial machine. It was followed by a first segmentation to locate the fruits on the background and a second one to find the possible defects. Once the defects were located, they were characterised by a set of features including colour, shape, texture descriptors as well as the distance of the defects to the nearest calyx or stem end. These data were accumulated for each fruit and summarised in order to transform the dynamic table into a static table. The grading was performed using quadratic discriminant analysis.
The correct classification rate of Jonagold apples was of 73 %. The errors were benign for one half. In the second half, errors were due to defects difficult to segment such as russet and bruises. Some wounds located near the stem ends were probably confused with these ends. Enhancement of the grading process should come from every stage, and particularly, from the image acquisition stage.
Indeed, better light repartition and use of specific wavelengths revealing high contrast between defects and healthy tissue should probably enhance the global machine performances.
Acknowledgement
This research was funded by the Belgian Federal Ministry of Agriculture (project D ½ - 5819A section 1).
References
Guedalia, I.D. (1997). Visual based quality sorting of fruit. Sensors for non-destructive testing – measuring the quality of fresh fruits and vegetables. In Proceedings from the ‘Sensors for Non-destructive Testing International Conference and Tour’, Orlando, Florida, U.S.A., 18-21 Feb. 1997, North Regional Agricultural Engineering Service, pp. 232-238.
Heinemann, P.H., Varghese, Z.A., Morrow C.T., Sommer III H.J., & Crassweller R.M. (1995). Machine vision inspection of Golden Delicious apples. Applied Engineering in Agriculture, 11 (6), 901-906.
Leemans, V, Magein, H, & Destain, M.-F. (1998). Defects segmentation on ‘Golden Delicious’ apples by using colour machine vision. Computers and Electronics in Agriculture, 20, 117-130. Leemans, V., Magein, H., & Destain, M.-F. (1999). Defect segmentation on ‘Jonagold’ apples using colour vision and Bayesian method. Computers and Electronics in Agriculture, 23, 43-53.
Leemans, V., Magein, H., & Destain, M.-F. (2000). Quality fruit grading by colour machine vision: defect recognition. Acta Horticulturae 517, Proceedings from ‘XXV International Horticultural Congress’, 2-7 August 1998, Bruxelles, Belgium, pp. 405-412.
Leemans, V., Magein, H., & Destain, M.-F. (2002). On-line apple grading according to european standards using Machine Vision. Biosystem Engineering, 83(4),397-404.
citrus. In Proceedings from the ‘Sensors for Non-destructive Testing International Conference and Tour’, Orlando, Florida, U.S.A., 18-21 Feb. 1997, North Regional Agricultural Engineering Service, pp. 249-260.
Miller, W. M. (1995). Optical defect analysis of Florida citrus. Applied Engineering in Agriculture, 11(6), 855-860.
Moltó, E., Blasco, J., & Benlloch, J. V. (1998). Computer vision for automatic inspection of agricultural produces. In SPIE Symposium on Precision Agriculture and Biological Quality. Nov. 1-6, 1998. Boston, MA, USA.
Moltó., E., Blasco, J., & Aleixos, N. (2000). Multispectral, real-time inspection of citrus using a parallel architecture. In AgEng 2000 – Agricultural Engineering into the Third Millennium, Warwick, UK, 2-7 July. Paper 00-AE-001.
Nakano, K. (1997). Application of neural networks to the color grading of apples. Computers and Electronics in Agriculture, 18, 105-116.
Schrevens, E., & Raeymakers L. (1992). Colour characterization of Golden delicious apples using digital image processing. Acta Horticulturae, 304, 159-166.
Singh, N., Delwiche, M. J., Johnson R.S., & Thompson, J. (1992). Peach maturity grading with color computer vision. In ASAE International Summer Meeting, Charlotte, North Carolina, USA, 21-24 June, Paper 92-3029.
Tao, Y., & Wen, Z. (1999). An adaptive spherical image transform for high-speed fruit defect detection. Transactions of the ASAE, 42(1), 241-246.
Wen Z., & Tao Y. (1998). Brigthness-invariant image segmentation for on-line fruit defect detection. Optical Engineering, 37(11), 2948-2952.
Wen Z., & Tao Y. (2000). Dual-camera NIR/MIR imaging for stem-end/calyx identification in apple defect sorting. Transactions of the ASAE, 43(2), 449-452.
Yang, Q. (1993). Finding stalk and calyx of apples using structured lighting. Computers and Electronics in Agriculture, 8, 31-42.
Yang, Q. (1994). An approach to apple surface feature detection by machine vision. Computers and Electronics in Agriculture, 11, 249-264.
Yang, Q., & Marchant, J. A. (1996). Accurate blemish detection with active contour models. Computers and Electronics in Agriculture, 14, 77-89.
Figure 1 : View of the lighting tunnel and the cameras adapted on the two row grading machine.
Figure 2 : Drawing showing the tunnel and the cameras adapted on the two row grading machine, particularly the position of the lighting tubes. 1, grading machine frame; 2, lighting tubes supports; 3, cameras, 4, tunnel; 5, light diffusers.
Figure 3 : Information flow in the proposed method and definition of the views. The upper part show a diagram of the set of images acquired for a fruit and the information flow related to that fruit. The bottom part of the figure shows the spherical model of the fruit used to compute the projection of the spherical triangle on the image.
Figure 4 : Example of detection of the calyx end by correlation. The left figure is the researched pattern, a mean of five calyx end images; the right image is a graphical example of detection; the bale below gives the correlation score and the position of the detection.
Table 1 : Confusion matrix computed on the validation set.
True groups I (accepted) Rejected
Graded in
I (Accepted) 31 17
Rejected 3 21
Correct classification rate 0.91 0.55