Survie et dynamique de population des caribous
migrateurs du Québec-Labrador
Mémoire
Alexandre Rasiulis
Maîtrise en biologie
Maître ès sciences (M.Sc.)
Québec, Canada
Résumé
L'information sur la façon dont les paramètres démographiques tels que la survie et la reproduction varient au fil du temps est centrale pour comprendre la dynamique de population. Nous avons estimé la survie annuelle de plus de 700 caribous migrateurs marqués chez deux troupeaux du Québec-Labrador entre 1991 et 2012. De plus, nous avons vérifié l'effet de la masse des colliers émetteurs sur la survie des femelles adultes. Nos résultats démontrent que, lorsque la condition physique est mauvaise, un collier lourd peut diminuer la probabilité de survie d'environ 18% par rapport à un collier léger. Par la suite, nous avons élaboré un modèle démographique permettant d'estimer la taille de population annuelle. Nous avons utilisé cette technique efficace et peu coûteuse afin de corriger des inventaires ayant une grande incertitude ainsi que confirmer des inventaires aériens récents. Finalement, nous démontrons l'importance des suivis à long terme d’individus marqués.
Abstract
Information on how demographic parameters such as survival and reproduction vary over time is central to understanding populationdynamics. We estimated annual survival of more than 700 marked migratory caribou in two herds in Quebec-Labrador between 1991 and 2012. In addition, we tested the effect of radio collarmass on adult femalesurvival. Our results demonstrate that when bodycondition is low, a heavy collar can reduce survival byapproximately 18% compared to a light collar. Subsequently, we developed a demographic model to estimate annual population size. We used this effective and relatively inexpensive technique to correct one aerial census with high uncertainty and confirm recent aerial censuses. Finally, we demonstrate the importance
Table des matières
Résumé ... iii
Abstract ... v
Liste des tableaux ... ix
Liste des figures ... xi
Avant-propos...xiii
1. Introduction ... 1
1.1 Le rôle de la survie chez les ongulés ... 1
1.2 Dynamique de population ... 2
1.3 L'effet des radios émetteurs ... 3
1.4 Le caribou comme sujet d'étude ... 4
1.5 Dynamique de population et gestion ... 6
1.6 Objectifs ... 7
2. The effect of radio-collar weight on survival of migratory caribou ... 9
Résumé ... 10 Abstract ... 11 2.1 Introduction ... 12 2.2 Study area... 13 2.3 Methods... 14 2.3.1 Collar Data ... 14
2.3.2 Estimation of Survival Parameters ... 17
2.4 Results ... 17
2.5 Discussion ... 18
2.6 Management implications ... 19
Acknowledgments ... 20
3. Survival and population dynamics: the rise and fall of the Ungava migratory caribou ... 21
Résumé ... 22 Abstract ... 23 3.1 Introduction ... 24 3.2 Study area... 26 3.3 Methods... 27 3.3.1 Caribou monitoring ... 27
viii
3.3.5Estimation of historical population sizes ... 31
3.3.6Evaluation of variability in demographic parameters ... 32
3.4 Results ... 33
3.4.1 Estimation of survival ... 33
3.4.2 Fall calf recruitment ... 34
3.4.3 Deterministic demographic model ... 35
3.4.4 Estimation of historical population sizes ... 36
3.4.5 Evaluation of parameters’ variability ... 37
3.5 Discussion ... 37
3.5.1 Population dynamics of the RAF herd ... 39
3.5.2 Population dynamics of the RG herd ... 39
3.6 Management implications ... 41
Acknowledgements ... 42
Conclusion générale ... 45
4.1 Utilisation de colliers émetteurs en écologie ... 50
4.2 Utilité des paramètres démographiques pour la gestion ... 51
4.3 État des troupeaux de caribous migrateurs du Québec-Labrador ... 51
5. Bibliographie... 53
Annexe ... 61
Liste des tableaux
Table 2.1.Number of new and active collars as well as number of mortalities between 1991-1994 and 2000 for caribou equipped with VHF and satellite collars from the Rivière-George herd. Table 2.2. Model selection results, based on Akaike’s Information Criterion with small sample size corrections (AICc), for analyses examining adult female caribou survival as a function of time and collar type, Rivière-George herd, 1991-1994 and 2000; 3 models were considered. Table 3.1. Number of radio-collared migratory caribou by sex-age classes in two herds in northern Québec-Labrador, and time span of data used in the analysis of survival rates.
Table 3.2. Demographic parameters used in a demographic model to estimate historical population size (1954-1993) for the Rivière-George caribou herd. Parameters represent a rapidly growing population.
Table 3.3. Model selection results, based on Akaike’s Information Criterion with small sample size corrections (AICc), for analyses examining adult female caribou survival as a function of
Liste des figures
Figure 1.1. Estimés de populations issues d'inventaires aériens (avec intervalles de confiance (IC) lorsque disponibles) pour les troupeaux de caribous migrateurs George et Rivière-aux-Feuilles du nord du Québec et Labrador. Notez que les IC pour le troupeau RG en 2010 et 2012 sont trop petits pour être visibles sur la figure.
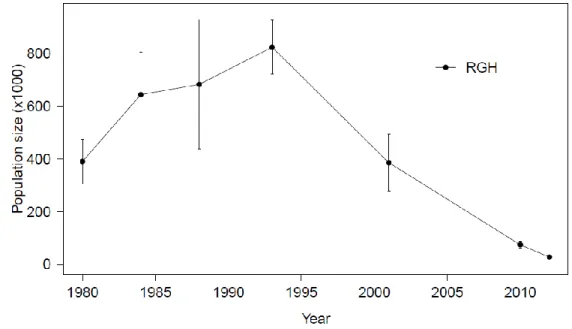
Figure 2.1. Population estimates from aerial censuses, with confidence intervals (CI) when available, for the Rivière-George migratory caribou herd in northern Québec and Labrador between 1980 and 2012. Note that CI in 2012 was too small to be seen on the graph.
Figure 2.2. Annual survival rates with 95% confidence intervals of adult female caribou from the Rivière-George herd equipped with either light VHF or heavy satellite collars (ARGOS) between 1991 and 2000. The number of individuals is indicated for each year.
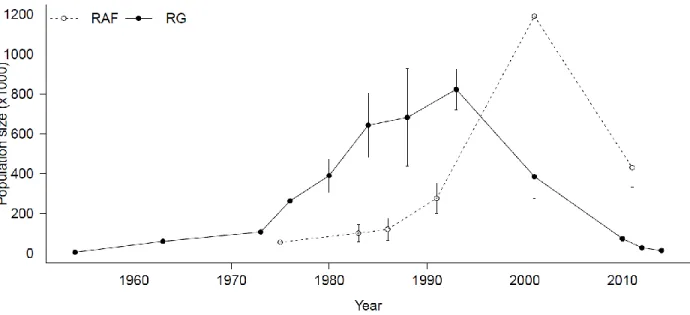
Figure 3.1. Population estimates, with confidence intervals (CI) when available, for the Rivière-George and Rivière-aux-Feuilles migratory caribou herds in northern Québec and Labrador compiled from aerial census counts. Note that there were no CIs for the RGH before 1980, while those in 2010 and 2012 are too small to be seen on the graphic.
Figure 3.2. Life history diagram used to calculate annual population size in October for the Rivière-George and Rivière-aux Feuilles herds of migratory caribou. Boxes are estimates for different sex-age classes, calves (Nc), yearlings (Ny), adult females (Nf) and adult males (Nm).
Boxes are connected by annual harvest of calves (Hc), and females (Hf), the yearling winter
survival rate (Syw), annual survival rate of yearlings (Sy), and females (Sf), and proportion of
females (Prf) and number of adult males to 100 adult female (MFR) used to calculate the
following year's population size. The number of calves in the following year was estimated by multiplying the estimated number of surviving adult females by the fall recruitment rate (R) (adapted from Boulanger et al. 2011).
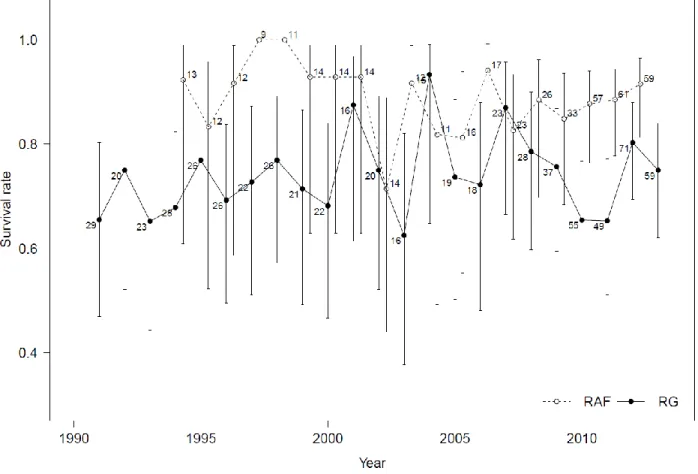
Figure 3.3. Annual survival rate (mean ± 95 % confidence intervals) of radio-collared adult female caribou from the Rivière-George (RG) and Rivière-aux-Feuilles (RAF) herds from 1991 to 2012. Numbers indicate the sample size for each year.
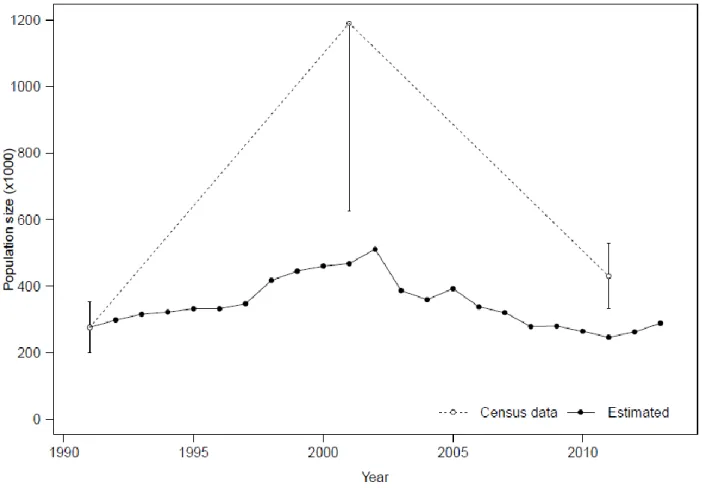
Figure 3.4. Fall recruitment expressed as calves/100 female caribou observed during annual classifications of the Rivière-George (RG) and Rivière-aux-Feuilles (RAF) herds, 1991 to2012. Figure 3.5. Aerial census data (± confidence intervals) and annual population size estimates (± confidence intervals) obtained from a life history model in1991-2012 for the Rivière-aux-Feuilles caribou herd.
Figure 3.6. Aerial census data (± confidence intervals) and annual population size estimates (± confidence intervals) obtained from a life history model between 1993 and 2001 and between2001 and 2012 for the Rivière-George caribou herd.
Avant-propos
Avant tout, ce projet n’aurait pu être réalisé sans la contribution financière d’une longue liste de partenaires, qui ont décidé d’investir dans la recherche sur le caribou par le biais de Caribou Ungava (http://www.caribou-ungava.ulaval.ca/partenaires/). Je les remercie tous sincèrement. J'aimerais remercier deux professeurs lors de mon baccalauréat à l'Université d'Ottawa sans qui je n'aurais jamais fait d'études supérieures. Scott Findlay, une personne pour qui les notes importaient peu qui croyait que la vraie récompense académique était l'acquisition de nouvelles connaissances. Il a vu en moi le potentiel de chercheur et m'a permis de faire une thèse de bac sur le sujet de mon choix, le caribou bien entendu! Et Nigel Waltho, un chercheur et académicien extraordinaire qui m'a montré que la recherche et les études supérieures n'ont rien à avoir avec le baccalauréat. Nigel est probablement la personne qui m'a le plus encouragé à poursuivre des études supérieures.
À mon directeur Steeve Côté, merci premièrement de m'avoir donné ce merveilleux projet et toutes les opportunités qui y étaient reliées, tant sur le terrain que de participer à des conférences ou encore à la gestion du caribou. Merci pour ta confiance en moi, ton dévouement et bien sûr pour les histoires de chasse et de chiens. Merci à Marco Festa-Bianchet, mon codirecteur, ta sagesse est grande oh Grand Fromage. J'ai beaucoup aimé collaborer avec toi et merci pour ton sens de l'humour qui sait détendre même les atmosphères les plus tendues.
Merci à Serge Couturier pour tes nombreuses contributions non seulement tout au long de mon parcourt, mais aussi pour tes travaux depuis plusieurs années qui ont mené à ce projet.
Merci à Caroline Hins pour ton aide sans fin, tu étais toujours là pour m'aider à la rédaction, mettre de l'ordre dans mes idées, comme support moral ou simplement pour jaser avec quelqu'un. Merci aussi à Sonia de Bellefeuille, une personne toujours de bonne humeur toujours prête à aider les autres.
Merci aussi à une longue liste d'étudiants qui m'ont encouragé et soutenu au courant de mon parcours. Merci à tout le labo, aux Français; Mael Le Corre, Glenn Yannic et William Crosmary,
xiv
Castro et Patrick Morissette, à la licorne Amélie Drolet, au caecum Michael Bonin, à Vincent Vallières alias Nicolas Houde et bien sûr à la born-again caribou Sabrina plante. Un gros merci à Joëlle Taillon qui m'a accueilli en tant que matriarche du Labo. Elle m'a aidé à plonger dans le monde du caribou et était toujours là pour répondre à mes questions, relire mes textes ou simplement échanger des idées. Merci aussi à Jo la fonctionnaire qui m'a aidé à m'initier au monde politique du caribou migrateur. Merci aussi à GuillameSouchay et Dominique Fauteux pour leur aide dans le merveilleux monde de MARK.
Merci à mes collègues du 'F', Vincent Brodeur, Julien Mainguy, Charles Jutras un merveilleux partner de terrain et surtout à Stéphane Rivard qui m'a non seulement beaucoup appris sur le terrain, mais qui était toujours prêt à répondre à mes requêtes de données ou d'informations sur la gigantesque base de données de suivi télémétrique.
Sur une note plus personnelle, j'aimerais remercier ma mère Louise Vignault pour sa générosité et ses encouragements tout au long de ma vie. Elle me connaît encore mieux que moi même, ce qui la rend une personne idéale pour discuter de problèmes, réussites... et de modèles mathématiques. Merci aussi à mon père Andrew Rasiulis avec qui j'ai tué mon premier caribou. Merci pour l'enthousiasme que tu démontres envers mes travaux. Merci à Fuego mon meilleur compagnon, l'être le plus jovial qui sait toujours me faire sourire. Finalement merci à l'amour de ma vie, ChrystelLosier, sans qui je n'aurais jamais même fini mon bac. Grâce à toi, je suis une meilleure personne tant d'un point de vue académique que personnel.
L'éducation c'est la seule chose que PERSONNE ne peut t'enlever.
1. Introduction
L'étude de la survie, c.-à-d. la probabilité de demeurer vivant pour un certain intervalle de temps, peut toucher plusieurs aspects de l'écologie d’une espèce et joue donc un rôle clé dans la gestion des populations. La survie d’un individu peut dépendre d'une multitude de facteurs tels que le climat, la prédation, la disponibilité de ressources, la modification de son habitat et son comportement (Hestbeck et al. 1991, Gaillard et al. 2000b). Pour maximiser son aptitude phénotypique (Danchin et al. 2005), un individu doit se reproduire, mais il faut tout d'abord qu’il survive. Chez les ongulés, le succès reproducteur à vie, souvent utilisé comme indice d'aptitude phénotypique, est fortement corrélé avec la longévité (Clutton-Brock 1988, Gaillard et al. 2000a). La plupart des comportements qu'adopte un individu visent à maximiser sa probabilité de survie. La sélection de l'habitat (Morris 2003, Gaillard et al. 2010), la quête alimentaire (Lemon 1991, Bednekoff 1996), la migration (Albon and Langvatn 1992, Alerstam et al. 2003, White et al. 2014) et la dispersion (Tuljapurkar et al. 2009) peuvent avoir un impact direct ou indirect sur la probabilité de survie d’un animal. De plus, à une échelle plus grande, le fait qu'une population soit en croissance ou en déclin sera déterminé par la capacité de ses individus à survivre et à se reproduire.
1.1 Le rôle de la survie chez les ongulés
Chez les ongulés, le taux de survie diffère beaucoup selon l’âge et le sexe des individus (Gaillard et al. 2000b). Les mâles ont généralement une survie inférieure aux femelles, peu importe l'âge (Gaillard et al. 2000b). Ceci peut être attribué à leurs dépenses énergétiques plus élevées lors de la période de reproduction en automne dans les milieux tempérés et boréaux, diminuant ainsi leurs réserves énergétiques juste avant l'hiver (Toïgo and Gaillard 2003). Pour leur part, les juvéniles et les individus sénescents ont une survie inférieure à celle des adultes puisqu'ils sont plus susceptibles aux variations environnementales et à la prédation (Gaillard et al. 2000b). L'importance relative, ou l'élasticité, de la survie de chaque classe d’âge et de sexe dans la dynamique de population est aussi très différente puisque la survie de certains groupes a beaucoup moins d'impact que celle d'autres groupes sur la dynamique de population (Reid et al. 2004). L'élasticité est définie comme l'effet d'un changement proportionnel d'un paramètre
2
Chez les ongulés, la survie des femelles est le paramètre démographique ayant la plus grande élasticité, suivi de la survie des juvéniles (Gaillard et al. 2000b). Les femelles adultes sont plus résilientes aux variations environnementales que les juvéniles, de telle sorte que contrairement à la survie juvénile, la survie des femelles adultes est très stable à travers le temps (Gaillard et al. 1998). Gaillard et Yoccoz (2003) ont suggéré que les femelles adultes allouent plus d'énergie à assurer leur propre survie au détriment de leur reproduction puisque c'est leur survie qui est plus probable d'augmenter leur aptitude phénotypique. Malgré sa faible élasticité, la grande variabilité de la survie des juvéniles fait en sorte qu’il s’agit du paramètre influençant le plus souvent le taux de croissance des populations d'ongulés (Gaillard et al. 1998, Gaillard et al. 2000b, Boulanger et al. 2011). Gaillard et al. (2000b) ont cependant constaté une exception à cette tendance. Lorsque la pression de chasse ou de prédation est élevée sur le segment adulte d’une population, la survie des adultes a alors plus d'influence sur la dynamique de population. En ajoutant une source externe de variabilité, la survie des femelles adultes devient le paramètre influençant le plus la croissance de population.
1.2 Dynamique de population
Les populations de grands herbivores, tels que les ongulés, ont généralement de faibles taux de croissance puisque leur taux de reproduction est relativement faible (Blueweiss et al. 1978). Pour les espèces avec une portée fixe à un jeune, le taux intrinsèque de croissance (λ) maximale varie généralement entre 1.25 et 1.35 (Wolfe 1980, McCorquodale et al. 1988, Reynolds 1998) ce qui veut dire qu'une population peut doubler en 4-5 ans. Afin de bien comprendre la dynamique de ces populations, il est nécessaire d'avoir des informations sur la façon dont les paramètres démographiques tels que la survie et la reproduction peuvent varier au fil du temps (Lebreton et al. 1992, Sandercock 2006). Il existe plusieurs techniques pour mesurer les variations de tailles de population. Par exemple, les séries chronologiques des estimations annuelles des paramètres démographiques permettent une meilleure compréhension des tendances démographiques passées (Arthur et al. 2003) et peuvent également être utilisées pour prédire les tailles de populations futures (Kruse et al. 2004, Heppell et al. 2005). Par ailleurs, les modèles de dynamique de population basés sur les changements temporels des paramètres démographiques peuvent être utilisés pour estimer les variations de taille d'une population au fil du temps, offrant
une alternative aux techniques classiques de suivi de la population, comme les inventaires aériens (Fancy et al. 1994, Arthur et al. 2003).
1.3 L'effet des radios émetteurs
Les radios émetteurs intégrés dans des colliers, des sacs à dos ou des étiquettes d'oreille sont largement utilisés en écologie animale et en gestion des populations pour étudier l'utilisation de l'habitat (Massé and Côté 2013), le comportement (Bleich et al. 1997) et la survie, (Fuller 1989) et ce, sur une très grande diversité de taxa. Lorsqu'on marque un individu afin d’étudier son comportement ou ses composantes biodémographiques, il est nécessaire de s'assurer que ces variables ne soient pas biaisées par le marquage, une supposition très importante des études utilisant des radios émetteurs (Bank et al. 2000, Venturato et al. 2009). Malgré l’importance de connaître l'effet des radios émetteurs sur le comportement et la survie des individus, cet effet est encore mal connu. Si le port d'un émetteur ne respecte pas cette supposition, alors il faudrait obligatoirement en tenir compte.
Les résultats des quelques études qui ont tenté de quantifier l'effet des colliers émetteurs sur la survie des individus sont variables. Chez les oiseaux, certaines études ont démontré une perte de masse plus élevée (Greenwood and Sargeant 1973), et une augmentation de la mortalité (Marks and Marks 1987, Venturato et al. 2009) chez les individus portant des émetteurs. D'autres études, par contre, n’ont trouvé aucun impact des émetteurs sur ces mêmes variables (Hines and Zwickel 1985, Hagen et al. 2006). Cette situation se retrouve également chez les mammifères. Certaines études sur les zèbres des plaines (Equusburchelliantiquorum) (Brooks et al. 2008), les campagnols terrestres (Arvicolaterrestris) (Moorhouse and Macdonald 2005), les jeunes renards nains (Vulpes macrotismutica) (Cypher 1997), les orignaux (Alces alces) (Swenson et al. 1999) et les cerfs de Virginie (Odocoileusvirginianus) (White et al. 1972) ont démontré que les émetteurs radios avaient un impact sur le comportement, la condition physique ou encore la survie. Par contre, d'autres études sur les suricates (Suricatasuricatta) (Golabek et al. 2008), les primates (Gursky 1998), et les campagnols (Microtusspp.) (Johannesen et al. 1997) n'ont pas trouvé d'impact des émetteurs. Certaines études ont obtenu des résultats mixtes, indiquant que dépendamment de l'âge de l'individu ou la durée depuis l'installation de l'émetteur, ceux-ci
4
varient, il est essentiel d’évaluer l'impact potentiel des émetteurs sur les résultats des études avant d’utiliser les indices démographiques mesurés dans des cadres de gestion et d’aménagement (Cypher 1997). L’impact des émetteurs radio peut dépendre de leur masse (Brooks et al. 2008, Venturato et al. 2009) ou leur forme (Marks and Marks 1987). Il est aussi possible qu'il y ait une interaction entre la présence d'un émetteur radio et l'âge de l’animal sur la survie de celui-ci, puisque les jeunes individus semblent moins bien supporter la présence d'un collier (White et al. 1972, Cypher 1997, Swenson et al. 1999). Il est donc essentiel de s’assurer que le marquage des individus à l'étude ne biaise pas les résultats attendus et si oui, il est primordial de tenir compte de ce biais.
1.4 Le caribou comme sujet d'étude
Le caribou (Rangifertarandus) a une grande importance socioéconomique pour les peuples qui utilisent cette ressource (Hummel and Ray 2008). À l'échelle circumpolaire, la majorité des populations de caribou et de rennes (la même espèce) sont en déclin (Vors and Boyce 2009). De plus, il manque d’information sur l'état de plusieurs populations (Vors and Boyce 2009). À partir de l'étude de Vors et Boyce (2009) nous pouvons soulever deux constats: 1) de futures études doivent tenter d’identifier les causes de déclin des populations de Rangiferet 2) une gestion efficace d'une population passe par une bonne connaissance des tailles de populations. Les inventaires de population réguliers sont difficiles à planifier et très coûteux en raison de l’aire de répartition vaste et isolée de la majorité des populations de caribous migrateurs, et du patron de déplacements des troupeaux. Il apparaît donc essentiel d'élaborer des outils de suivi pour remplacer les inventaires aériens de population, classiquement utilisés pour le suivi des populations de Rangifer.
Dans le nord du Québec-Labrador, il existe deux troupeaux de caribous migrateurs, le troupeau Rivière-aux-Feuilles (RAF) et le troupeau Rivière-George (RG). Depuis 1950, ces troupeaux ont connu de grandes fluctuations de leur effectif. À la fin des années 1980 et au début des années 1990, les troupeaux RG et RAF étaient probablement les plus grands au monde totalisant plus de 1 million d'individus (Hearn et al. 1990, Couturier et al. 2004). Depuis ces deux dernières décennies, la taille des deux troupeaux a chuté considérablement (environ 53 et 97 % pour les troupeaux RAF et RG, respectivement). Le déclin récent des deux troupeaux est une incitation à
mieux comprendre les causes de mortalité des individus et les facteurs influençant la survie afin de ralentir et ultimement renverser ce déclin.
Le troupeau RG est supposé avoir augmenté d'aussi peu que 5 000 individus en 1954 (Banfield and Tener 1958) à plus de 823 000 ± 102 000 caribous en 1993 (Couturier et al. 1996), avant de diminuer à 27 600 ± 2 760 individus en 2012 (Inventaire aérien du gouvernement du Québec, données non publiées) (Figure 1.1). L'inventaire de 1954, cependant, a fourni un nombre minimum qui a ensuite été accepté pour un nombre total ce qui a pu laisser croire que cette population pourrait de nouveau croître rapidement à partir d'un très petit effectif. Il est donc important de reconsidérer la dynamique de population du troupeau RG au cours de la deuxième moitié du 20e siècle. De son côté, le troupeau RAF a augmenté d'environ 56 000 individus en
1975 (Henaff 1976) pour atteindre un maximum d'environ 1 193 000 ± 567 100 en 2001 (Couturier et al. 2004), puis a diminué à environ 430 000 ± 98 900 individus en 2011 (Inventaire aérien du gouvernement du Québec, données non publiées). L'incertitude des inventaires et les longues périodes entre certains de ces inventaires rendent la tâche de gestion très difficile.
6
Figure 1.1.Estimés de populations issues d'inventaires aériens (avec intervalles de confiance (IC) lorsque disponibles) pour les troupeaux de caribous migrateurs Rivière-George et Rivière-aux-Feuilles du nord du Québec et Labrador. Notez que les IC pour le troupeau RG en 2010 et 2012 sont trop petits pour être visibles sur la figure.
1.5 Dynamique de population et gestion
Les efforts de conservation de Rangifer sont limités par un manque d'estimations fiables des tailles de populations, qui sont des éléments fondamentaux pour la gestion des populations sauvages (Williams et al. 2002). Les inventaires aériens sur de grands troupeaux occupant des régions vastes et éloignées sont coûteux(Morellet et al. 2007) de telle sorte qu’ils sont rares et ont souvent de larges intervalles de confiance (e.g. Couturier et al. 2004). Les décisions de gestion, cependant, doivent souvent être prises de façon urgente, par exemple concernant les quotas de récolte pour les espèces sauvages exploitées (Nilsen et al. 2012, Strand et al. 2012). Les politiques de récolte constantes peuvent entraîner un déclin des populations lorsque les taux de croissance démographique varient au cours du temps (Fryxell et al. 2010). Compte tenu de l'état de conservation précaire de nombreuses populations de Rangifer, des techniques alternatives aux inventaires de population permettraient une meilleure compréhension de la dynamique de population, et ainsi permettraient de développer et d'appliquer des politiques de gestion plus appropriées. Par exemple, le suivi à long terme des animaux munis de colliers émetteurs fournit des informations à fine échelle sur la survie: avec un échantillon de taille adéquate, les tendances annuelles et saisonnières de la survie peuvent être évaluées (Gaillard et al. 1998). Ainsi, il y a meilleure compréhension de l'état de croissance d'une population et donc une meilleure gestion de celle-ci.
Crête et al. (1996) ont signalé que le taux de survie annuel des femelles adultes du troupeau RG est passé de 0,95 en 1984 à 0,81 en 1991. Cette diminution de la survie aurait coïncidé avec le début du déclin de la population à la fin des années 1980 (Hearn et al. 1990). Malheureusement, depuis ce temps, peu d'efforts ont été mis sur l’évaluation des taux de survie du troupeau RG. La survie des femelles du troupeau RAF n'a quant à elle jamais été examinée à ce jour. Étant donné les questions d’actualité telles que le développement du Nord et les débats sur les quotas de chasse, ainsi que l’incertitude entourant la survie et la dynamique de ces deux populations, il est
nécessaire d'explorer l'état de ces populations et de déterminer quels sont les mécanismes qui ont conduit aux tailles de troupeaux actuelles.
1.6 Objectifs
Ce projet avait pour but d'approfondir nos connaissances sur la dynamique de population des troupeaux de caribous migrateurs Rivière-aux-Feuilles et Rivière-George du nord du Québec-Labrador dans un contexte de gestion de la faune. Nous avons utilisé les données télémétriques issues d’un suivi à long terme des deux troupeaux de caribous migrateurs initié en 1986 par le Ministère du Développement Durable, de l’Environnement, de la Faune et des Parcs du Québec et dernièrement bonifié par le programme de recherche Caribou Ungava. Les individus suivis étaient munis de colliers VHF et satellites nous permettant ainsi de calculer les taux de survie annuels et saisonniers pour les mâles et femelles adultes (≥ 2 ans) et les individus âgés d’un an entre 1990 et 2012.
Notre premier objectif spécifique consistait à vérifier l’effet de la masse d'un collier émetteur sur la survie de son détenteur. Nous avons émis l'hypothèse que les dépenses énergétiques supplémentaires engendrées par le port d’un collier lourd diminuaient le taux de survie de ces individus. Nous avons donc prédit que les individus portant un collier lourd auraient des taux de survie annuelle inférieurs aux individus portant des colliers plus légers.
Le deuxième objectif spécifique était d'estimer la survie des caribous des deux grands troupeaux puis d'explorer l'effet des paramètres démographiques sur la dynamique des populations des deux troupeaux à l’échelle annuelle. Nous avons utilisé les changements temporels des paramètres démographiques pour reconstruire la taille des populations dans le passé. Enfin, nous avons calculé la sensibilité des changements dans la croissance de la population aux différents paramètres démographiques, soit la survie et le recrutement. Nous avons émis l'hypothèse qu’un déclin du taux de survie des femelles était la cause principale du déclin des deux troupeaux de caribous. La variabilité des taux de survie des femelles devrait donc augmenter lors d'un déclin de population, en partie car la variabilité d’une proportion est corrélée avec sa moyenne, avec un maximum à 0.50..
2. The effect of radio-collar weight on survival of migratory caribou
Publié le 18 juin 2014 dans la revue Journal of Wildlife Management, 78:953-956.
ALEXANDRE L. RASIULIS, Département de biologie and Centre d’études nordiques, Université Laval, Québec, QC, G1V 0A6, Canada.
MARCO FESTA-BIANCHET, Département de biologie and Centre d’études nordiques, Université de Sherbrooke, Sherbrooke, QC, J1K 2R1, Canada.
SERGE COUTURIER, Ministère du Développement durable, Environnement, Faune et Parcs
du Québec, 880 Chemin Sainte-Foy, Québec, QC, G1S 4X4, Canada.
STEEVE D. CÔTÉ, Département de biologie and Centre d’études nordiques, Université Laval, Québec, QC, G1V 0A6, Canada.
10 Résumé
Les émetteurs radio sont largement utilisés en gestion de la faune et, par conséquent, il est essentiel d'évaluer les effets qu'ils peuvent avoir sur la survie des animaux. Nous avons comparé la survie de 269 caribous migrateurs (Rangifertarandus) adultes choisis au hasard munis soit de colliers VHF légers ou de colliers satellites ARGOS lourds, au cours de la même période. Les colliers lourds ont réduit la survie annuelle des caribous dans une population en déclin avec une mauvaise condition physique d'environ 18%. La précision des suivis et l'estimation des paramètres démographiques sont cruciales pour la gestion des espèces et il est essentiel de tenir compte des biais possibles lié aux colliers.
Abstract
Radio transmitters are widely used in wildlife management; therefore it is essential to assess any effects that they may have on animal survival. We compared the survival of 269 randomly selected adult migratory caribou (Rangifertarandus) fitted with either light VHF or heavy ARGOS satellite collars during the same period. Heavy collars reduced annual survival of caribou in a declining population with generally poor body condition by about 18%. Accurate estimates of survival are crucial for management decisions and it is essential to consider possible effects of collars on those estimates.
12
2.1 Introduction
Radio transmitters embedded in collars, backpacks or ear tags are widely used in animal ecology and management to study habitat use (Massé and Côté 2013), behavior(Bleich et al. 1997), and survival (Fuller 1989). A crucial assumption often made, but rarely tested, is that the transmitter does not alter the behavior or vital rates of the subject (Bank et al. 2000, Venturato et al. 2009). Although all possible measures are normally taken by wildlife managers to minimize the risks associated with capture and wearing a radio transmitter, some detrimental effects may still persist for some species. Guidelines for the use of radio transmitters are often ambiguous and rarely species-specific. One frequently cited guideline is that they should weigh less than 3% of body mass of the animal instrumented (Kenward 2001), but the basis for that guideline is unclear. Regardless of the weight of radio transmitters, it is essential to consider their potential undesired effects, which may lead to biased vital rate estimates and erroneous management decisions. Although some studies have identified effects of radio transmitters on animal behavior(Brooks et al. 2008), mass loss (Legagneux et al. 2013), reproductive success (Demers et al. 2003), or survival (Swenson et al. 1999), much is still unknown and several results appear contradictory (e.g. Godfrey and Bryant 2003).
The size and weight of the radio transmitter, the species studied and individual characteristics may affect the response to the radio transmitter. For example, heavier devices are more likely to have a negative impact than light ones (Brooks et al. 2008, Venturato et al. 2009). In addition, younger individuals may be more affected than adults (Cypher 1997, Swenson et al. 1999). Migratory species such as greater snow goose (Ansercaerulescensatlanticus) or caribou (Rangifertarandus) that travel hundreds or thousands of kilometers each year may be particularly susceptible to the effects of collars (Demers et al. 2003, Haskell and Ballard 2007), because the energetic costs of long migrations exacerbate the burden of wearing a transmitter.
Although technological advances have reduced the size and weight of radio transmitters, demand for newer and better tools has led to added functions, such as Global Positioning System (GPS) engines, 2-way communication, geofencing and proximity sensors, longer battery life or onboard cameras, adding bulk and weight to the devices. Our objective was to evaluate the effect of radio collar weight on survival of migratory caribou. We compared survival of adult females (≥2 years
old) wearing a light VHF collar (514 g) to that of females wearing a heavy satellite collar (1.63 kg) in a herd in northern Québec and Labrador over 5 years. Although these types of collars were consistently used throughout the 1990's, satellite collars used on migratory caribou today weigh less than 500 g.
2.2 Study area
The range of the Rivière-George (RG) caribou herd extends over several thousand km2 in
northern Québec and Labrador (Boulet et al. 2007). Over the last few decades, the herd's demography has changed. Estimated at about 60,000 caribou in 1963 (Des Meules and Brassard 1964), the herd experienced several decades of growth and was above 500,000 individuals for about 15 years, peaking in the late 1980s and early 1990s (Crête et al. 1996, Bergerud et al. 2008). The RG herd was photo censused at 823,375 individuals (± 102,000) in 1993 (Couturier et al. 1996). It then declined to about 27,600 (± 2,760) individuals in 2012 (Québec and Newfoundland-Labrador governments, unpublished data; Fig 2.1). The recent decline was associated with poor body condition, likely due to overgrazing of the summer range and more extensive movements (Couturier et al. 1990, Crête and Huot 1993).
14
2.3 Methods 2.3.1 Collar Data
In 1986, the governments of Québec and Newfoundland-Labrador initiated a satellite monitoring program using Telonics (Mesa, AZ, USA) ARGOS ST-3satellite collars (hereafter satellite collars) on migratory caribou, mostly adult females. Animals were captured at various times of the year, mainly by net-gunning from a helicopter, but also by boat at river crossings. VHF and satellite collars were fitted on adult females (≥2-year-olds) and both collar types provided large adjustment range so the fit on caribou neck was comparable. The Argos satellite collars used during our study provided a better fit than earlier versions of GPS satellite collars. Collar type did not differ between capture techniques and females to be fitted with each type of collar were selected randomly. Several new adults were captured and collared each year, maintaining a representative age structure of collared animals (Table 2.1). Actual age was not determined. Battery life for VHF collars was longer (4 to 9 years) than for satellite collars (2.5 years), but satellite collared individuals were consistently recaptured and fitted with new satellite collars prior to the end of battery life. VHF radio-collars were monitored from fixed-wing aircraft or helicopter (see Crête et al. 1996). The herd's range was covered 6-8 times/year, with at least 1 field session between January and March over the winter range.
We assumed that the chance of detecting live or dead individuals during these flights did not differ, because large proportions of this herd's range were covered during most flights. It is possible that some individuals with VHF collars died outside of these more frequented zones and were therefore not detected as deceased. Recent data, however, suggest that such bias, if present, was small. In 2011 and 2012 we found that the probability of finding a satellite collar in mortality mode using only the VFH frequency was very similar to the probability of detecting mortality from functioning satellite collars. During this period several satellite collars malfunctioned and could only be found using VHF transmitters. Out of 33 collar malfunctions of adult females, 3 were found dead and 30 alive, suggesting a survival rate of 91%, compared to 90% for individuals with functioning satellite collars. For VHF collars, mortality was determined using pulse rate of VHF frequency as the beats per minute (BPM) were higher (average 187 BPM) for collars in mortality mode than for those in active mode (average 49 BPM). Satellite
monitoring provided the mortality date and location of each individual every ±5 days. For both VHF and satellite collars, mortalities were determined by visiting the presumed mortality site and locating evidence such as bones, fur, or blood on the collar. Unfortunately, in most cases exact time and cause of mortality was not determined because the carcass was visited up to a few months after death.
We analyzed annual survival of caribou fitted with VHF and satellite collars in 1991-1994 and in 2000. VHF collars were substituted for satellite collars after 1995, but many VHF collars were deployed prior to the 2001 census (Couturier et al. 2004). A total of 195 adult females (>2 years) with VHF collars and 96 with satellite collars were monitored over these 5 years. The weight of the 2 collar types differed substantially: VHF collars weighed 514g, whereas ARGOS ST-3 satellite collars weighed 1.63kg.
16
Table 2.1. Number of new and active collars as well as number of mortalities between 1991-1994 and 2000 for caribou equipped with VHF and satellite collars from the Rivière-George herd.
VHF collars Satellite collars Number of new collars
1991 12 26
1992 10 2
1993 26 9
1994 9 14
2000 74 7
Number of active collars
1991 76 29 1992 65 20 1993 67 23 1994 16 28 2000 74 22 Number of mortalities 1991 15 10 1992 13 5 1993 12 8 1994 0 9 2000 9 7
2.3.2 Estimation of Survival Parameters
We compared survival of adult females over a biological year, 1 June to 31 May, according to collar type during the same period. Individuals were included as of their first full year of monitoring (collared no later than 30 June) to eliminate potential biases due to the duration of monitoring during the first year. Individuals with satellite collars that were lost due to collar malfunction were censored after the last transmission. There was, however, no relation between collar malfunction and fate, as we explained above. We used a known-fate model in program MARK version 6.1 to estimate annual survival. We compared a general time dependent model (Sg*t, where S is survival, g is collar type and t is time), a simple time dependent model (St) and a
model with only collar type as independent variable (Sg) and used the corrected Akaike
information criterion (AICc) to select the best model (White and Burnham 1999).
2.4 Results
Females from the RG herd equipped with VHF collars had much higher annual survival rates (86%, SD = 9.79) than females with satellite collars (68.4%, SD = 5.78) (Fig.2.2) between 1991 and 1994 and in 2000. The best model included only collar type as an independent variable (lower 95% CI = -1.4, upper 95% CI = -0.4), with no support for a time effect (Table 2.2).
18
Figure 2.2. Annual survival rates with 95% confidence intervals of adult female caribou from the Rivière-George herd equipped with either light VHF or heavy satellite collars (ARGOS) between 1991 and 2000. The number of individuals is indicated for each year.
Table 2.2. Model selection results, based on Akaike’s Information Criterion with small sample size corrections (AICc), for analyses examining adult female caribou survival as a function of
time and collar type, Rivière-George herd, 1991-1994 and 2000; 3 models were considered.
Modela AIC
c ΔAICcb AICcWeights Model Likelihood no. Par Deviance
{S(group)} 423.3182 0 0.98268 1 2 194.452
{S(group*time)} 431.4269 8.1087 0.01705 0.0174 10 185.7624
{S(time)} 439.6969 16.3787 0.00027 0.0003 5 204.6497
a Parameter description: group = collar type - either VHF of satellite, time = each biological year
(June-Mai) was considered as an occasion.
bΔAIC
c refers to difference in AICc between the most supported and the given model
2.5 Discussion
We directly tested the effect of collar weight and size by comparing individuals with light and heavy collars that experienced the same pursuit, capture, and handling procedures during the same time period and over the same range. There was no difference in the locations of captures according to collar type. Adult females were randomly selected for collaring; therefore, there was no reason to suspect that age structure was different according to collar type. Our results suggested that heavy collars may reduce survival in migratory caribou. The average difference inpoint estimates of annual survival between individuals equipped with light VHF collars and those with heavy satellite collars was 17.7% (yearly range 5 to 32%) over 5 years. Only collar weight and size differed between these 2 groups. It remains possible that survival of animals equipped with light VHF collars may be lower than survival of uncollared caribou, but we had no way to explore this possibility.
Although body condition measurements were not taken on captured individuals during this period, the herd was declining during the study period due, in part, to poor body condition in the late 1980s and early 1990s (Crête and Huot 1993, Couturier et al. 2009a, 2009b, 2010). Furthermore, the herd range had increased considerably during this period, resulting in annual migrations of over 1000 km, likely decreasing body condition (Couturier et al. 2009a, 2010). This suggests that during a population decline, when demographic parameters such as survival and reproduction are already diminished, the added weight of a collar, even within the suggested <3% of total body mass (Kenward 2001), may have important implications. Although the satellite collars only weighed approximately 1.6% of the body mass of an adult female caribou (80-100kg) (Couturier et al. 2009a), compared to approximately 0.5% for the VHF collars, this difference was apparently enough to decrease survival during a population decline. In addition to the detrimental effect of weight, the size or shape of the collar may contribute to the cumulative effect of wearing a heavier radio collar. Although older caribou may be more affected by the added weight of a collar, age estimates of collared individuals were not available. The constant annual addition of newly marked random individuals of both collar types, however, should have maintained an age structure representative of the overall population for both collar groups. Thus, survival rate of animals fitted with each type of collar should not be biased by age. Further research with known age animals, however, is needed to address this question. Since 2000, caribou in the herd are no longer equipped with heavy collars. Recent satellite collars weigh less than 500g.
2.6 Management implications
Given the potential impact of satellite collars on individual survival, it is crucial for studies using heavy transmitter collars, for example those including a video camera, to quantify the effect of these devices on survival, especially when body condition may be low. Ignoring this potential impact may bias results and lead to inappropriate management decisions. For example, an underestimate of adult female survival by only 5% (we found >15%) in migratory caribou demographic models will lead to an underestimate of projected population size by approximately 20% after only 5 years (authors’ unpublished data). Such bias may lead to the establishment of
20
small proportion (< 0.0005%) of caribou carried radiocollars during our study. Our results suggest that it is essential to consider the interaction between collar weight and individual body condition.
Acknowledgments
We thank the governments of Québec and Newfoundland-Labrador, and their biologists and wildlife technicians (past and present), who worked over the past 25 years in the collection of the extensive datasets used in this analysis. The funding provided by Hydro-Québec and the Department of National Defence (Canada) was essential to the satellite radio-tracking program of the 1980s and the 1990s. The writing part of this study was funded by the many partners of Caribou Ungava: Natural Sciences and Engineering Research Council of Canada, Ministère du Développement durable, Environnement, Faune et Parcs du Québec, ArcticNet, Circum Arctic Rangifer Monitoring and Assessment network, Labrador and Newfoundland Wildlife Division, Hydro-Québec, Xstrata Nickel-Mine Raglan, Fédération des pourvoiries du Québec, Makivik Corporation, Fédérationquébécoise des chasseurs et pêcheurs, Fondation de la faune du Québec, Institute for Environmental Monitoring and Research, and Canada Foundation for Innovation. Thanks to C. Hins, V. Brodeur, G. Souchay and G. Yannic for review comments and contributions to this manuscript.
3. Survival and population dynamics: the rise and fall of the Ungava migratory caribou
ALEXANDRE L. RASIULIS, Département de biologie and Centre d’études nordiques, Université Laval, Québec, QC, G1V 0A6, Canada.
MARCO FESTA-BIANCHET, Département de biologie and Centre d’études nordiques, Université de Sherbrooke, Sherbrooke, QC, J1K 2R1, Canada.
SERGE COUTURIER, Ministère du Développement durable, Environnement, Faune et Parcs
du Québec, 880 Chemin Sainte-Foy, Québec, QC, G1S 4X4, Canada.
CAROLINE HINS, Département de biologie, Université Laval, Québec, QC, G1V 0A6, Canada. STEEVE D. CÔTÉ, Département de biologie and Centre d’études nordiques, Université Laval,
22 Résumé
L'information sur la façon dont les paramètres démographiques tels que la survie et la reproduction varient au fil du temps est centrale pour comprendre la dynamique de population. Nous avons estimé la survie annuelle de plus de 500 caribous migrateurs chez les troupeaux de la Rivière-George (RG) et de la Rivière-aux-Feuilles (RAF) au Québec-Labrador entre 1991 et 2012. La survie annuelle étaitplus élevée chez les individus du troupeau RAF que chez le troupeau RG chez tous les groupes d'âge et de sexe. La survie des femelles adultes chez le troupeau RAF était en moyenne 89 % entre 1994 et 2012, alors qu’elle était de 74 % en moyenne chez le troupeau RG entre 1991 et 2012. Nous avons ensuite utilisé un modèle démographique pour estimer la taille des populations annuelles pendant plus de 20 ans. Ces modèles nous ont permis de corriger uninventaire ayant une grande incertitude, ainsi que de confirmer des inventaires plus récents. Cette technique relativement rapide et peu coûteuse est un moyen efficace de surveiller les fluctuations de population entre les inventaires aériens. Nous avons constaté que de forts déclins de population sont souvent reliés à une baisse de la survie moyenne des femelles adultes, ce qui implique une augmentation de la variabilité interannuelle. Ceci démontre l'importance des suivis à long terme d’individus marqués.
Abstract
Information on how demographic parameters such as survival and reproduction vary over time is central to understanding population dynamics. We estimated annual survival of over 500 marked migratory caribou from the Rivière-George (RH) and Rivière-aux-Feuilles (RAF) herds of Québec-Labrador between 1991 and 2012. The annual survival was much higher for individuals of the RAF herd compared to those of the RG herd for all sex and age classes. Survival of adult females of the RAF herd was on average 89 % between 1994 and 2012, while it averaged 74% for the RG herd between 1991 and 2012. We used a demographic model to estimate annual population sizes for the two populations over 20 years. This model allowed us to correct a past aerial census that had high uncertainty, and to confirm recentcensuses. This relatively quick and inexpensive monitoring technique is an efficient way to monitor population fluctuations between aerial censuses. We found that large population declines are likely caused by a decreasein average adult female survival, which leads to increased interannual variability in survival, demonstrating the importance of long-term monitoring of marked females.
24
3.1 Introduction
Information on how demographic parameters such as survival and reproduction vary over time is central to understanding population dynamics (Lebreton et al. 1992, Sandercock 2006).In long-lived species,changes in fecundity and recruitment rates can affect population growth (Blakesley et al. 2010), but changes in adult survival have dramatic impacts on population growth (Gaillard et al. 2000b, Saether and Bakke 2000). Time series of annual estimates of demographic parameters allow an understanding of past population trends (Arthur et al. 2003). In addition, models of population dynamics based on temporal changes in demographic parameters can be used to estimate changes in population size over time (Kruse et al. 2004, Heppell et al. 2005), offering an alternative to other population monitoring techniques such as aerial censuses (Fancy et al. 1994, Arthur et al. 2003).
In large mammals, adult female survival has high elasticity, so that a small change in this parameter would have a major impact on population growth, but often shows low variability over time (Gaillard et al. 2000b). In comparison, other demographic parameters such as juvenile survival often have lower elasticity but greater temporal variability (Gaillard et al. 2000b, Heppell et al. 2000). Adult females are more resilient to environmental variations such that their survival is less variable over time compared to that of juveniles (Gaillard et al. 2000b). Selection may have canalized life-history strategies favouring high adult female survival because that trait is the most likely to increase fitness (Gaillard and Yoccoz 2003). In most populations of ungulates, adult female survival is thus highly stable (Gaillard et al. 1998), and changes in population growth are mostly affected by variability in juvenile survival (Gaillard et al. 1998, Gaillard et al. 2000b, Boulanger et al. 2011).
Although most studies of ungulates report stable survival of adult females, some exceptions exist. Factors such as climate (Owen-Smith and Mason 2005), density (Coulson et al. 2001), anthropogenic disturbances (Courtois et al. 2007), and food limitation (Fryxell 1987) canstrongly affect female survival. In temperate and northern regions, anthropogenic disturbances such as forestry, mineral and fossil fuel extraction as well as habitat fragmentation can decrease the quality and quantity of food resources (Wolfe et al. 2000, Cameron et al. 2005, Festa-Bianchet et al. 2011)and increase predation risk (Briand et al. 2009, Houle et al. 2010), thus affecting
survival. Furthermore, northern species face rapidly changing environments because of climate change, with unknown consequences for their ecology (Gilg et al. 2012). A warming climate along with more precipitations and severe weather events may reduce juvenile and adult survival, for instance, by increasing the prevalence of pathogens (Harvell et al. 2002) and parasites (Brooks and Hoberg 2007), and reducing food availability and quality (Forchhammer et al. 1998).
Many wild reindeer and caribou (Rangifer) populations have recently or are currently declining (Vors and Boyce 2009),with important sociological and economical consequences across their circumpolar distribution (Vors and Boyce 2009, Festa-Bianchet et al. 2011). Conservation efforts for Rangiferhave generally been hindered by a lack of reliable time series of population size estimates, which are fundamental for the management of wild populations (Williams et al. 2002). Aerial population censuses in remote and very large regions are difficult and costly (Morellet et al. 2007) such that population estimates are infrequent and often have wide confidence intervals (CI). Management decisions, however, must often be taken on an urgent basis, creating a lag between the availability of reliable data and decisions on policies or harvest quotas for wild species (Nilsen et al. 2012, Strand et al. 2012). Constant harvest policies may lead to population declines because population growth rates vary (Fryxell et al. 2010). Given the precarious conservation status of many Rangifer populations, alternatives to expensive and often imprecise population censuses would provide a better understanding of population dynamics, leading to better management policies. Long-term monitoring of radio-collared animalsprovides fine-scale information on survival: with an adequate sample size, annual and even seasonal trends in survival can be estimated (Gaillard et al. 1998, Rasiulis et al. 2012).
Available estimates of annual survival for adult female wild migratory Rangifervary between 0.80 and 0.95 (e.g. Fancy et al. 1994, Gaillard et al. 1998, Boulanger et al. 2011). Fall recruitment rates (calves:100 females) generally range between 20 and 50 (e.g. Solberg et al. 2001, Hegel et al. 2010). Declines in Rangiferpopulations have been suggested to be mainly linked to a decrease in adult female survival (Wittmer et al. 2005, Boulanger et al. 2011). There are two large herds of migratory caribou in northern Québec and Labrador: the Rivière-George
26
RG herd (Couturier et al. 2010, Taillon et al. 2012b). Crête et al. (1996) reported that annual survival of adult females of the RG herd declined from 0.95 in 1984 to 0.81 in 1991. Lowered survival coincided with the beginning of the decline which apparently started in the late 1980's (Hearn et al. 1990). Unfortunately, there has since been little effort to measure survival rates of the RG herd. Survival of females from the RAF herd has never been examined. We used a long-term data set of satellite-collared individuals to estimateannual and seasonal survival rates for adult males, females, and yearlings of both herds between 1991 and 2012. Survival, recruitment and sex ratio in each population were quantified annually, and used to build a life history model to estimate annual herd sizes. Here, we assess the effect of demographic parameters on population dynamics of both herds at a fine temporal scale. We then use temporal changes in these parameters to reconstruct past and estimate current population sizes. Finally, we calculate the sensitivity of changes in population growth to the various demographic parameters.
3.2 Study area
The RG and RAF herds range over nearly1 million square kilometres in the northern Québec-Labrador peninsula (Taillon et al. 2012b).These caribou herds do not differ genetically (Boulet et al. 2007), buthave shown large and non-synchronised chancesinbodycondition of individuals and in demographic parametersover recent decades(Couturier et al. 2010). The RG herd is thought to have increased from as few as 5000 individuals in the 1950's (Banfield and Tener 1958) to 823 000 ± 102 000 caribou in 1993 (Couturier et al. 1996), before declining to 27 600 ± 2 760 in 2012 (Québec Government aerial count) (Figure 3.1).The 1954 estimate, however, was a minimum count that was subsequently mistaken for a total count. It is therefore important to reconsider the population dynamics of the RG herd during the second half of the 20th century. Estimates for the RAF herd, on the other hand, suggest an increase from 56 000 individuals in 1975 (Henaff 1976) to 1 193 000 ± 567 100 in 2001 (Couturier et al. 2004), then a decrease to 430 000 ± 98 900 in 2011 (Québec Government aerial count) (Figure 3.1).
Figure 3.1. Population estimates, with confidence intervals (CI) when available, for the Rivière-George and Rivière-aux-Feuilles migratory caribou herds in northern Québec and Labrador compiled from aerial census counts. Note that there were no CIs for either herd before 1980, while those for the RG herd in 2010 and 2012 are too small to be seen on the graphic.
3.3 Methods
3.3.1 Caribou monitoring
Caribou from the RG and RAF herds, captured by net-gunning from a helicopter, have been equipped with ARGOS satellite collars since the late 1980's, and GPS collars since 2007. We examined the survival of 726collared individuals of both sexes aged ≥ 1 year (Table 3.1). Yearling females were captured in early June and aged by size and tooth eruption patterns. Satellite monitoring provides the deathdate of each individual, allowing us to calculate fine scale survival rates.
28
Table 3.1. Number of radio-collared migratory caribou by sex-age classes in two herds in northern Québec-Labrador, and time span of data used in the analysis of survival rates.
Herd Group Years Individuals Caribou-years
Rivière-George Adult females 1991-2013 275 669 Adult males 2009-2013 45 104 Yearling females 2005-2013 107 107 Rivière-aux-Feuilles Adult females 1993-2012 139 428 Adult males 2007-2012 66 135 Yearling females 2007-2012 94 94
3.3.2 Estimation of survival parameters
Annual and seasonal survival rates were calculated using a known-fate model in program MARK version 6.1 (White and Burnham 1999). Only natural mortalities were used to calculate survival rate. If an individual died due to hunting or a capture accident, it was censoredfrom the analysis on June 1st prior to its mortality date. Yearling females were used to estimate survival of
yearlings of both sexes. Two age classes of females were included in the MARK analysis, yearlings and adults. Individuals collared as yearlings were considered adults after their first full year of monitoring, at age 2. We used the biological year (1 June–31 May) for all annual survival estimates. June 1 is the approximate average birth date for caribou in these populations (Taillon et al. 2012a). Individuals were included in the analysis starting from their first complete year of monitoring. Winter survival (1 November–31 May) was also calculated for yearlings over their first winter.
3.3.3 Estimation of fall recruitment and sex ratio
Since 1973 for the GR and 1994 for the RAF herd, several thousand individualswere classified yearly during the rut, generally during the last week of October, when all sex-age classes are together, to calculate the proportion of males, females, and calves. Observations were made on the ground or at times from a helicopter. Observation sites were distributed throughout the herds' ranges in order to obtain a good representation of the composition of each herd. The calves:100 females ratio was used as fall recruitment rate.
3.3.4 Deterministic life history model
To estimate annual population size, we divided the population into 4 segments: calves (identified as c), yearlings (y), adult females (f) and adult males (m). We used a modeling procedure similar to that developed by White and Lubow(2002) to fit a demographic matrix model that considered annual harvest (H) (method for estimating annual harvest can be found in the appendix), annual survival (S), yearling winter survival (Syw) as a proxy for calf winter survival, fall recruitment
(R) and fall adult sex ratio (Pr). Yearling winter survival likely overestimates calf survival. To calculate the total number of calves for a given year, we only used the number of adult females that survived from the previous year and excluded female yearlings which typically do not breed but cannot be distinguished from adult females in the fall (Haskell and Ballard 2007, Bergerud et al. 2008). We used the male to female ratio observed during classified counts to calculate the annual number of males because survival estimates for males were only available from 2008 to 2012, while sex ratio was recorded every year. We used the estimated population size from an aerial census as a starting point (N), then applied the calculated and observed demographic parameters to estimate annual population size in October, the time of estimates derived from aerial censuses, prior to most of the harvest (Figure 3.2).
30
Figure 3.2. Life history diagram used to calculate annual population size in October for the Rivière-George and Rivière-aux Feuilles herds of migratory caribou. Boxes are estimates for different sex-age classes, calves (Nc), yearlings (Ny), adult females (Nf) and adult males (Nm).
Boxes are connected by annual harvest of calves (Hc), and females (Hf), the yearling winter
survival rate (Syw) used as a proxy of calf survival rate, annual survival rate of yearlings (Sy), and
females (Sf), and proportion of females (Prf) and number of adult males per 100 adult female
(MFR) used to calculate the following year's population size. The number of calves the following year was estimated by multiplying the estimated number of surviving adult females by the fall recruitment rate (R) (adapted from Boulanger et al. 2011).
The numbers of adult females, adult males, yearlings and calves were summed to obtain the total population size each year. The same equations were recalculatedevery year using year-specific demographic parameters estimated by monitoring survival of collared females and from classified counts in the fall. Confidence intervals for the models were obtained using the upper and lower confidence intervals from the initial census to estimate the annual upper and lower population size. The model assumes that immigration or emigration do not occur or are balanced between the two herds. Although movement data of collared animals in both herds showed
minimal exchanges between herds in the 1990's (Boulet et al. 2007), none has been observed since the mid 2000's.
For years when estimates of yearling survival were unreliable due to low sample size (RG: before 2005, RAF:before 2007), we used a proxy obtained from comparable data in our data set. For example, RG yearling survival prior to 2005 was estimated by subtracting from the adult female survival for each year the difference between average yearling and adult female survival for 2005-2012. The difference between yearling annual and overwinter survival, for years when data were available, was then used to calculate yearling overwinter survival, extrapolated from the annual survivalof all females in the yearsprior to the monitoring of yearlings.
3.3.5Estimation of historical population sizes
We used the demographic model described above to back-calculate population size in 1954, using the 1993 estimate of 823 000 (Couturier et al. 1996) asstarting point. The 1993 census was the first to use more reliable and modern aerial techniques, and it had a confidence interval of 12.4%, much smaller than the 25-36% of previous estimates (Goudreault 1985, Crête et al. 1991). We used a best-case demographic scenario to assess possible population growth between 1954 and 1993, with optimistic demographic parameters (Table 3.2). Fall recruitment and sex ratio were estimated until 1972based on a scenario of a growing population, afterwards we used rates observedfrom1973 onwards. Annual demographic parameters were randomly selected from a normal distribution of the ranges presented in Table 3.2; 100 iterations of the model were done and the average annual population size was used.
32
Table 3.2. Demographic parameters used in a demographic model to estimate historical population size (1954-1993) for the Rivière-George caribou herd. Parametersrepresent a rapidlygrowing population.
Parameters Average (±standard deviation) Adultfemalesurvival 0.925 (± 0.05)
Adult male survival 0.775 (± 0.05)
Yearling survival 0.8 (±0.06)
Calf wintersurvival 0.85 (±0.03)
Fallrecruitment 55 (±3)calves/100 adultfemales Male proportion in the population 35 (±4)%
Annualfemaleharvest rate 1% of total population Annual male harvest rate 3% of total population
3.3.6Evaluation of variability in demographic parameters
To investigate how variability in female survival affected caribou population dynamics, we calculated the coefficient of variation (CV) of annual female survival and calf recruitment for both herds. The homogeneity of variance was also calculated to compare the variability of female survival and calf recruitment within both herds. Finally, we compared the CV of adult female survival between various caribou herds, with known growth phases, across the Arctic.
3.4 Results
3.4.1 Estimation of survival
Adult female survival remained relatively stable over most years of the study, with a few exceptions for each herd (Figure 3.3). Adult females from the RAF herd had an average survival of 0.89 (CV=0.078) between 1993 and 2012, rarely dropping below 0.85 and falling below 0.75 only in 2002. Adult females of the RG herd had an average survival of 0.74 (CV=0.106) between 1991 and 2013, exceeding 0.80 only in 2001, 2004 and 2007. Between 1994 and 2012, adult female survival in the RAF herd was significantly higher than in the RG herd (t = 5.18, df = 18, P < 0.0001).
Figure 3.3. Annual survival rate (mean ± 95% confidence intervals) of radio-collared adult female caribou from the Rivière-George (RG) and Rivière-aux-Feuilles (RAF) herds from 1991 to 2013 and 2012, respectively. Numbers indicate the sample size for each year.
34
Adult male survival was lower than that of adult females in both herds, but significantly so only for the RG herd (RAF:t5 =1.87, P =0.06; RG: t4 = 4.37. P = 0.006) averaging 0.73 (CV=0.294)
for the RAF herd between 2007 and 2012, and 0.58 (CV=0.193) for the RG herd between 2009 and 2013. Between 2009 and 2012, adult male survival from the RAF herd was significantly higher than that of the RG herd (t3 = 4.47, P = 0.01).Sample sizes anterior to these dates were too
small to estimate adult male survival.
Female yearling survival for both herds was significantlylowerthan adult female survival(RAF: t5
= 2.39, P = 0.03; RG: t8 = 2.28, P = 0.03), and it was lower in the RGthan in the RAF herd
although not significantly so (t5 = 1.62,, P = 0.08). From 2007 to 2012, RAF yearling survival
was 0.75 (CV=0.205), while survival of RG yearlings averaged 0.62 (CV=0.310) between 2005 and 2013.
3.4.2 Fall calf recruitment
Recruitment rates for the two herds were significantly different (t = 2.66; df=17; P = 0.008). Between 1994 and 2009, recruitment for the RAF herd averaged 33.4 (CV=0.327) calves/100 females, while for the RG herd it averaged 29.5 (CV=0.321) calves/100 females (Figure 3.4). However, between 2010 and 2012 calf recruitment increased from 29.5 to 36.7 calves/100 females for the RAF herd, while it decreased from 16.0 to 7.4 calves/100 females for the RG herd (Figure 3.4).
Figure 3.4. Fall recruitment expressed as calves/100 female caribou observed during annual classifications of the Rivière-George (RG) and Rivière-aux-Feuilles (RAF) herds, 1991 to2012. 3.4.3 Deterministic demographic model
Using the 1991 census of 276 000 individuals for the RAF herd (Couturier et al. 2004) as a starting point, we estimated that in 2002 this herd reached about 500 000 individuals, and is unlikely to have included more than 700 000 caribou based on various starting number of individuals in 1991. The population then dropped to less than 250 000 individuals in 2011 before increasing slightly to about 300 000 in 2013 (Figure 3.5).
Figure 3.5. Aerial census data (± confidence intervals) and annual population size estimates obtained from a life history model in1991-2013 for the Rivière-aux-Feuilles caribou herd.