O
pen
A
rchive
T
OULOUSE
A
rchive
O
uverte (
OATAO
)
OATAO is an open access repository that collects the work of Toulouse researchers and
makes it freely available over the web where possible.
This is an author-deposited version published in :
http://oatao.univ-toulouse.fr/
Eprints ID : 9762
To link to this article : DOI:10.1016/j.memsci.2013.07.026
URL :
http://dx.doi.org/10.1016/j.memsci.2013.07.026
To cite this version : Pellegrin, Bastien and Prulho, Romain and
Rivaton, Agnès and Thérias, Sandrine and Gardette, Jean-Luc and
Gaudichet-Maurin, Emmanuelle and Causserand, Christel Multi-scale
analysis of hypochlorite induced PES/PVP ultrafiltration membranes
degradation. (2013) Journal of Membrane Science, vol. 447 . pp.
287-296. ISSN 0376-7388
Any correspondance concerning this service should be sent to the repository
administrator:
[email protected]
Multi-scale analysis of hypochlorite induced PES/PVP ultrafiltration
membranes degradation
Bastien Pellegrin
a,b,1, Romain Prulho
c,d,1, Agnès Rivaton
c,d, Sandrine Thérias
c,d,
Jean-Luc Gardette
c,d, Emmanuelle Gaudichet-Maurin
e, Christel Causserand
a,b,naUniversité de Toulouse, INPT, UPS, Laboratoire de Génie Chimique, 118 route de Narbonne, F-31062 Toulouse cedex 09, France bCNRS, UMR 5503, Laboratoire de Génie Chimique, F-31062 Toulouse, France
cClermont Université, Université Blaise Pascal, ICCF, BP 10448, F-63000 Clermont-Ferrand, France dCNRS, UMR 6505, ICCF, BP 80026, F-63171 Aubière, France
eVeolia Environnement Research and Innovation, Maisons-Laffitte Research Center, Chemin de la digue BP 76, 78603 Maisons-Laffitte cedex, France
Keywords: Ageing Hypochlorite cleaning PES PVP Ultrafiltration
a b s t r a c t
In drinking water production plants, the use of oxidants such as sodium hypochlorite during in-place cleanings may impair the membrane integrity and radically impact the ultrafiltration process efficiency, leading to potential contamination of the permeate water with pathogens. This study investigates the effects of hypochlorite exposure on the properties of a commercially available UF hollow fiber. Mechanical performances and water permeability appeared to be greatly affected by the contact with hypochlorite. Monitoring the molecular changes by X-ray photoelectron spectroscopy (XPS), attenuated total reflectance infrared spectroscopy (ATR-IR), size exclusion chromatography (SEC) and VITA-mode atomic force microscopy (VITA-AFM) revealed high stability of the main polymer constituting the membrane (i.e. polyethersulfone (PES)) and very high reactivity of the additive (i.e. poly(N-vinyl pyrrolidone) (PVP)) towards immersion in aqueous sodium hypochlorite solution with maximal reaction rate for neutral to slightly basic pH. Correlation of those results unexpectedly leads to the conclusion that the overall membrane properties changes are governed by the additive fate.
1. Introduction
The use of hollow fiber ultrafiltration membranes is becoming an increasingly popular method for drinking water production. In order to avoid clogging and bacterial contamination, frequent in-place washings are necessary to clean membranes. Such cleaning can be achieved by backwashing and chemical cleaning proce-dures using hydrochloric acid, sodium hydroxide, and oxidants as hydrogen peroxide (H2O2) or sodium hypochlorite (NaOCl).
Sodium hypochlorite is by far the most commonly used cleaning reagent[1]. However, major water treatment facilities appear to be subjected to membrane failure and integrity loss on a quite regular basis, leading, in some cases, to failure frequency rates as high as one hollow fiber rupture per module and per year[2]. One can suspect, even if on-site data are not officially available, that membrane performances are affected before their rupture. It is then necessary to understand the mechanisms responsible for such a loss of integrity in order to be able to anticipate membrane
failure and to provide advices to drinking water producers con-cerning the cleaning conditions that should be applied or avoided. The chemistry of aqueous NaOCl solutions is pH dependent. In water, sodium hypochlorite is totally dissociated, leading to the formation of hypochlorous acid (HClO) and sodium hydroxide (NaOH). Within the pH range (pH 6–11) commonly encountered during cleaning procedures, the weak acid HClO may then be deprotonated to its conjugate base, the hypochlorite ion (ClO!)
with a pKavalue of 7.58 at 20 1C[3]. HClO species is known to be a
much more effective disinfectant with a higher oxidizing power in comparison to ClO! [4]. For those reasons, pH value of aqueous
hypochlorite solution is of crucial importance regarding the cleaning efficiency and the membrane degradation phenomenon and has to be precisely investigated.
Commonly, PES based membranes are modified with polymeric additives such as poly(N-vinyl pyrrolidone) (PVP) in order to improve hydrophilicity and tune the membrane porous structure. Previous works have shown that sodium hypochlorite has a strong impact on the PVP additive [5–7] leading to an increase of pure water permeability.
PES is commonly considered as a polymer highly resistant to oxidants and tolerant to a wide range of pH (from 2 to 12). Wienk et al. reported for instance PES polymer stability when immerged in a 3000 ppm hypochlorite solution during 48 h under stirring[5,6]. However, a few authors investigated the impact of
n
Corresponding author at: Université de Toulouse, INPT, UPS, Laboratoire de Génie Chimique, 118 route de Narbonne, F-31062 Toulouse cedex 09, France. Tel.: +33 5 61 55 86 90; fax: +33 5 61 55 61 39.
E-mail addresses:[email protected] (B. Pellegrin),
[email protected] (C. Causserand).
sodium hypochlorite on PES membranes and proposed a chain scission phenomenon at the ether–sulfone linkage [8–10]. Tho-minette et al.[8]reported chain scission of PES and an alteration of hollow fiber membranes mechanical properties when exposed to a 400 ppm hypochlorite solution at pH 8 for up to 120 days (1,152,000 ppm h) at room temperature. Similarly, Arkhangelsky et al. [9] studied the impact of hypochlorite exposure (up to 100,000 ppm h–150 ppm at pH 7.2 for up to 28 days at room temperature) on commercial PES flat sheet membranes containing PVP additive. They reported an increase of the pure water perme-ability and a decrease of the mechanical properties of the mem-branes attributed to both PES and PVP degradation. Subsequently, Yadav et al.[11,12] investigated PES composite membrane samples soaked in 700 ppm hypochlorite solutions for up to 36 days (up to 600,000 ppm h) at 55 1C for both pH 9 and 12. They observed by ATR-IR the outbreak of a new band at 1034 cm! 1
and assigned it to the formation of sulfonic acid due to the degradation of the PES layer. On the basis of a PES degradation mechanism suggested by Thominette et al. [8] and Arkhangelski et al. [9] they then proposed a degradation mechanism including chain scissions of the PES and formation of sulfonic acid and phenyl chloride and groups. In the present work, specific experiments and character-izations were designed and used to go further in the under-standing of the molecular mechanisms of degradation induced by hypochlorite on PES/PVP hollow fibers membranes.
In this aim, PES/PVP fibers were put in contact with a bleach solution at various pH values, increasing doses (concentration x exposure time) and constant temperature 20 72 1C. As it is well known that in most cases the deterioration of the macroscopic properties of polymers results from modifications of their chemi-cal structure [13], the goal of this study was to elucidate the degradation mechanisms of the fiber at the molecular level and to correlate those modifications with the macroscopic properties. In this work, the term ageing refers to the modification of the membrane properties. Since no direct correlation between labora-tory ageing and ageing actually happening during regular on-site operation (on-site ageing) has been established yet, the term accelerated ageing is avoided. Consequently, the other objective is to validate the laboratory ageing protocols representativeness regarding the molecular scale degradation mechanisms and the impact on the macroscopic performances as compared to the actual on-site ageing phenomenon.
Fibers have been analyzed with several techniques allowing different levels of analysis. At molecular scale: X-ray photoelectron spectroscopy (XPS) and attenuated total reflectance infrared spec-troscopy (ATR-IR) were used to understand the changes of func-tional groups, allowing therefore to elucidate the degradation mechanisms. At supramolecular scale: size exclusion chromato-graphy (SEC) and VITA-mode atomic force microscopy (VITA-AFM) allowed us to monitor the extent of chain scissions. Finally, regarding macroscopic properties: tensile testing was performed to investigate the mechanical properties, pure water permeability was monitored and morphological changes were observed by scanning electron microscopy (SEM). Evaluation of the depth profile of the degradation was also carried out thanks to a micrometric profilometer. This multi-scale characterization allowed us to propose a degradation mechanism of PES/PVP hollow fibers that has been validated on PES/PVP dense films and published in former work [14] and to correlate it to the evolution of the fibers operating performances.
In previous studies [15], it has been suggested that hydroxyl radicals could be responsible for the degradation of polysulfone membranes in contact with hypochlorite cleaning solutions. Parti-cular efforts have been deployed in the present study to investi-gate the role of free radicals in the case of hypochlorite induced degradation of PES/PVP membrane.
2. Material and methods 2.1. Membranes
The membranes used in this study are commercially available hollow fibers extracted from a new UF module (HYDRACAP 60, LD
HYDRANAUTICSMembrane), widely used for drinking water production.
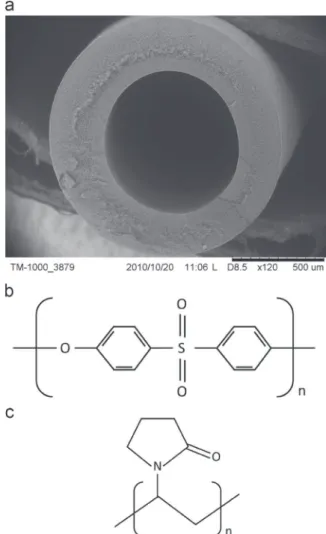
Those hollow fibers present an asymmetric geometry with an inner selective layer, an internal diameter of 0.8 mm and an external diameter of 1.3 mm (Fig. 1a). Manufacturer datasheet also specifies a molecular weight cut-off (MWCO) of 150 kDa, a maximum operating trans-membrane pressure (TMP) of 1.4 bar (0.14 MPa) and a maximum chlorine exposure of 200,000 ppm h (200 g h L! 1
). Membrane mate-rial is claimed to be a “hydrophilized” PES (Fig. 1b). As described in
Section 3.2.1, the additive used for the membrane surface hydrophi-lization has been identified by ATR-IR to be PVP (Fig. 1c), and typically accounts for up to 5–10 wt% of the final membrane material.
After extraction from the module, the hollow fibers were stored in a 1 g L! 1
sodium bisulfite (Na2O4S2 – Technical grade 85%,
Sigma-Aldrich, USA) solution at 5 1C to avoid bacterial prolifera-tion. Prior to using, membrane samples were soaked in a large volume of ultra-pure water for a minimum time of 1 h to remove sodium bisulfite.
2.2. Solutions and chemicals
All aqueous solutions were prepared using deionized ultrapure water (ρ¼18.2 MΩ cm) generated by a PURELAB Maxima system
Fig. 1. Cross-section SEM image of a nitrogen-fractured pristine membrane (a); molecular structure of polyethersulfone (b) and poly(N-vinyl pyrrolidone) (c).
(ELGA LabWater′s, UK). Hypochlorite solutions used for the ageing experiments were obtained by dilution of a commercial NaOCl reagent (NaOCl 9.8 wt% – La Croix, FR). Concentrated sulfuric acid
(H2SO4 – Analytical grade 95%, VWR PROLABO, FR) and sodium
hydroxide (NaOH – Analytical grade, CARLOERBAReagents, FR) were
added to the hypochlorite ageing solutions to adjust their pH value.
Some ageing experiments were performed with the addition of a radical scavenger to the hypochlorite solution. For this purpose, the 2-methylpropan-2-ol (tBuOH – HPLC grade 99.5%, SIGMA
-ALDRICH, USA) was selected for its high reactivity towards hydroxyl
free radicals (HOd).
SEC characterization of the membrane material required to dissolve membrane samples in an effective solvent. N,N-dimethyl-methanamide (DMF – Analytical grade, CARLO ERBA Reagents, FR)
was used as a solvent and as an eluent for membrane dissolutions and the SEC measurements.
2.3. Ageing protocols
2.3.1. Sodium hypochlorite treatment
Ageing experiments were all performed by soaking the mem-branes at ambient temperature (20 72 1C) in hypochlorite solu-tions at a total free chlorine concentration ([TFC]) of 350 ppm (mg L! 1). Exposure times ranged from 1 h to 28 days. [TFC] was
monitored using the so called DPD method (EPA-approved method 4500 CI G): reaction of chlorine-containing samples with N,N-diethyl-p-phenylenediamine sulfate in the presence of a specific buffer producing a pink colored compound, measured at 520 nm using a spectrophotometer (DR/2400, HACH, USA). The pH of the
soaking solutions ranging from 6 to 11 was then adjusted by addition of H2SO4and NaOH. Since pH 8 and 11 values
approxi-mately correspond to onsite back-washing and chemical cleaning pH conditions respectively, they were more extensively investi-gated. In addition, pH 6 was also studied in more detail, since it corresponds to the prevalence of HClO species, whereas pH 11 corresponds to ClO! species predominance and pH 8 leads to the
coexistence of both HClO and ClO!species (Fig. 2). Since [TFC] and
pH were found to be decreasing with time, constant [TFC] (7 30 ppm) and pH ( 70.2) were maintained by daily adjustment of the soaking solutions.
Membrane control samples were similarly soaked in ultra-pure water up to 28 days. Another set of NaOCl ageing experiments was performed using the conditions mentioned above with the addition of 2 g L! 1of tBuOH as a radical scavenger in the soaking solution.
After each ageing experiment, samples were soaked in a large volume of ultra-pure water for 2 h and stored in a 1 g L! 1Na
2O4S2
solution at 5 1C for later analysis.
Usually, for on-site operation, membranes are periodically subjected to free chlorine contact during back-washing and chemical cleaning. Depending on the characteristics of the treated water, water treatment facilities operators may use NaOCl solu-tions with a [TFC] up to 20 ppm during up to 5 min for back-washing process and with a [TFC] up to 400 ppm for up to 2 h for chemical cleaning process. Frequency may reach, for back-washing and chemical cleaning respectively, 1/6 h of membrane operation and 1/month of membrane operation. Even if membranes are only periodically in contact with hypochlorite, the combined amount of NaOCl in contact with membranes can be expressed as a total dose. Hypochlorite dose will then refer to the [TFC] of the NaOCl soaking solution, multiplied by the sample NaOCl exposure time. For convenience, NaOCl dose will be expressed in g h L! 1
(1000 ppm h) in the subsequent paragraphs, which is the most appropriate unit for the range of doses studied. Increasing the [TFC] and reducing the total exposure time can be a direct way to perform accelerated ageing experiments and to predict the impact of hypochlorite on membranes during on-site operation, but this trivial factorization is not entirely above criticism. Additional soaking experiments were performed at various [TFC] to assay the validity of this concept.
Additionally, similar PES/PVP membranes extracted from a module operated on a French water production plant were collected and analyzed. Comparison with the laboratory aged samples was carried out.
2.3.2. Thermo-oxidation experiments
Thermo-oxidation experiments on pristine membranes were performed in a ventilated oven at 100 1C over 60 days.
2.4. Membrane characterization 2.4.1. Permeability measurements
Pure water permeability of pristine and hypochlorite aged membrane samples was quantified with a cross-flow filtration set-up at controlled temperature of 207 5 1C. Ultra-pure water was forced to permeate from the inside to the outside of a 15 hollow fibers laboratory scale module (22075 mm length). The trans-membrane pressure (TMP) was applied by adjusting a pressure valve at the retentate side. To overcome the impact of membrane compaction, each module tested was first subjected to cross-flow filtration of ultra-pure water at maximal TMP of 0.14 MPa until pure water flux stabilization (20 min). After mem-brane compaction, the TMP ranged from 0.05 to 0.14 MPa and taken as the average of the feed pressure and the retentate side pressure readings, upstream of the pressure valve. The pure water permeability at 20 1C (Lp/μ20 in L h! 1m! 2bar! 1, with Lp the
permeability coefficient and μ20the water viscosity at 20 1C) was
then calculated, as described in former work[16], from the Darcy law:
JT¼ Lp μT
ΔP ð1Þ
where JTis the permeate flux density (L h! 1m! 2) calculated using
the inner surface area of the membranes and μTthe fluid viscosity
for the experiment temperature.
The flux density JTwas corrected back to J20using the empirical
Arrhenius law of the fluid viscosity variation as a function of the temperature. J20¼ JT μT μ20 ¼ JTexp E0 RT! E0 293R ! " ð2Þ
Fig. 2. HClO and ClO!species dissociation curve at 20 1C, obtained by calculation,
where E0 is the activation energy of the fluid (for water E0¼ 15
675 J mol! 1), R the universal gas constant and T the temperature
of the experiment.
Lp/μ20was then taken as the slope value of the linear regression
between ΔP and J20values.
2.4.2. Scanning electron microscopy (SEM)
SEM images of the cross-section of membranes were recorded using a HITACHI Tabletop Microscope TM-1000. Prior to analysis,
membrane samples were fractured in liquid nitrogen, dried in a vacuum oven at room temperature for 1 h and coated with a 5 nm silver layer. To obtain an accurate representation of membrane cross-section morphology, a set of 6–10 images was recorded for each condition investigated. Image editing and treatment were performed using IMAGEJssoftware.
2.4.3. Tensile strain at break measurements
Tensile tests were performed on wet membranes using an INSTRON 3342 series tensile apparatus. Tailor-made grips for the
hollow fiber geometry were fitted to the device to avoid stress concentration. Initial distance between grips was fixed to 110 mm and samples were extended at a constant elongation rate of 100 mm min! 1
. Young's modulus E, tensile stress at break sRand
elongation at break εR were calculated from the experimental
stress–strain curves. A set of eight samples was analyzed and averaged for each condition analyzed.
2.4.4. Attenuated total reflection-Fourier transform infrared (ATR-IR) spectroscopy
Infrared spectra of the inner active layer of membranes were recorded using a THERMO-NICOLET Nexus 670 fitted with a DTGS
detector and a diamond ATR crystal. Spectra were obtained by summation of 16 scans between 4000 and 400 cm! 1 with a
resolution of 4 cm! 1
. Spectral analysis was performed on OMNICs
software. Membrane samples were axially cut open to gain access to the inner active layer for analysis. Prior to analysis, samples were dried in a vacuum oven for 2 h at 50 1C and shortly stored in a desiccator. All the IR spectra recorded were corrected by adjusting the 1150 cm! 1 band (which corresponds to SO
2
sym-metric stretching of PES and considered to be invariant during the membrane degradation) to an arbitrary chosen absorbance value of 1. In the subsequent paragraphs, the corrected absorbance is mentioned as relative absorbance. To facilitate the reader's under-standing, when monitoring changes of specific IR bands upon degradation, normalization back to the pristine membrane relative absorbance may be performed. Likewise, when carrying out profile analysis, normalization back to the surface value may be performed.
Note that ATR-IR technique generates a few microns depth penetration of the infrared beam in the sample thickness; there-fore it is commonly considered that infrared spectrum obtained using a diamond ATR crystal provides information regarding the first 3–5 mm underneath the membrane surface. All absorbance values presented are an average of at least four samples.
In addition, ATR-IR profiles of the membrane section were performed. To gain access to the membrane bulk, successive mechanical abrasions from the membrane surface were carried out with a BUEHLERISOMET5000 precision saw. ATR-IR spectra were
then recorded for each abrasion depth according to the aforemen-tioned protocol.
2.4.5. X-ray photoelectron spectroscopy (XPS)
XPS analyses of the inner active layer of membranes were performed using an Escalab 250 (THERMO ELECTRON) device with Al
Kα radiation as the X-ray monochromatic source (1486.6 eV). Unlike
ATR-IR, XPS technique allows chemical characterization of sample surfaces, with an analysis depth in the nanometer range. XPS measurements were repeated on three distinct samples for each condition analyzed. Prior to active layer analysis, membrane samples were dried and axially cut open to gain access to the inner surface. 2.4.6. Size exclusion chromatography (SEC)
SEC chromatograms of membrane material dissolved in DMF at a concentration of 5 g L! 1
were performed using a refractometer fitted apparatus connected to two TOSOH BIOSCIENCEcolumns
(TSK-Gel Alpha 3000 and 5000). Analyses were performed at a flow rate of 1 mL min! 1
and the detector was calibrated with polyethylene glycol standards. DMF was used as the eluent. The peak corre-sponding to the elution time of PES was then analyzed to obtain the molecular mass distribution of PES.
2.4.7. Nanoscale thermal analysis module (VITA)
The changes of the glass transition temperature (Tg) of the
polymers constituting the membrane were followed at the extreme surface of the membrane using an AFM nanoscale thermal analysis module (VITA). This technique allows the determination of the local glass transition temperature of polymers with a nanoscale spatial resolution. The probe temperature increase causes a progressive thermal expansion of the polymer, which leads to a cantilever deflection. When the probe temperature reaches a transition tem-perature of the polymer (such as the Tg), the probe penetrates into the
sample. This penetration causes an opposite deflection that can be detected by the AFM. Temperature recorded for an inverted probe deflection will then correspond to a local Tg. The specific probes used
for this type of measurements are comprised of an electric circuit connected to the Vita module. The temperature of the probe is increased by applying an electric current to this circuit (Joule effect). A relation between the probe temperature and the applied tension can be established by calibrating the probe with several known polymers. The spring constant of the probe was chosen between 0.5 N m! 1and
3 N m! 1
, and its cantilever was 200 mm long. The probe was calibrated using three standard polymers: polycaprolactone (Tm¼
55 1C), polyethylene (Tm¼ 116 1C) and polyethylene terephthalate
(Tm¼ 235 1C).
Measurements were performed on pristine and aged mem-branes to investigate potential changes in the thermal properties of the samples during the degradation. Each measurement was performed five times to ensure good reproducibility. During these experiments, the probe was heated from 45 1C to 230 1C at a heating rate of 10 1C s! 1.
3. Results and discussion 3.1. Macroscopic characterization
The impact of hypochlorite exposure on the global mechanical performances of the hollow fibers was investigated by tensile testing.
Fig. 3 presents typical shapes of stress–strain curves obtained for pristine and hypochlorite treated membranes. The virgin membranes exhibited a Young's modulus E of 8076 N mm! 2, a tensile stress at
break sRof 5.070.3 MPa and an elongation at break εRof 5774%.
After exposure to hypochlorite, the overall envelope of the stress– strain curves remained mostly unchanged in the elastic domain and in the early stages of the plastic domain, while the elongation at break εR
value appeared to be largely affected. That is to say, during tensile testing, sample fracture occurred sooner as the hypochlorite dose was increased. Therefore, choice was made to monitor the changes of εR
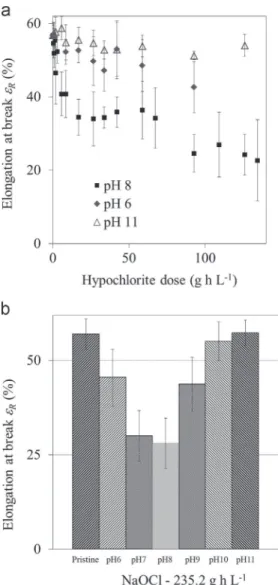
The εRvalues obtained for a wide range of soaking conditions
(various hypochlorite exposure time and pH) are reported in
Fig. 4a. Decrease of the elongation at break εRof membranes arose
from contact with hypochlorite solution, meaning that membrane ductility decreased for aged samples. Same observations were already made by several authors [8,10,11] that all reported PES membranes mechanical properties severely affected by hypochlor-ite exposure. The εR drop was the most significant for the
experiment conducted at pH 8. A few authors also reported the incidence of pH regarding membrane embrittlement rate when exposed to hypochlorite solution.
Fig. 4b presents the results obtained for membrane elongation at break εR as a function of the pH value of the soaking solution
(ranging from 6 to 11) for a hypochlorite dose of 235.2 g h L! 1
(350 ppm – 672 h), just above the 200 g h L! 1maximum chlorine
exposure recommended by the manufacturer. It clearly appears that the most significant εR decrease was undergone by
mem-branes exposed to pH 7 and pH 8 solutions. In other words, the embrittlement of aged membranes strongly depends on the pH of the hypochlorite solution and the closer we get from pH 7 to pH 8 range, the more severe the ductility loss will be. A few authors
[11,15,17] also reported the incidence of pH regarding membrane embrittlement rate when exposed to hypochlorite solution. For instance, Yadav et al. [11] similarly reported higher impact on membrane mechanical performances when exposed to hypochlor-ite solution at pH 9 than at pH 12. Furthermore, according to
Fig. 4a and b, for very high hypochlorite doses, εRvalue reaches a
relative stabilization at 25 710% for pH 8 aged membranes. Impact of hypochlorite in terms of water transfer through the membrane is shown inFig. 5a, where the membrane pure water permeability Lp/μ20is reported as a function of the hypochlorite
dose and the pH value of the soaking solution. For pH 6, 8 and 11, contact with low doses of hypochlorite induced a drastic increase of Lp/μ20. Besides, for early stages of the degradation and at
equivalent hypochlorite dose, the Lp/μ20increase was more
sub-stantial for pH 8 than for pH 6 and 11. For higher hypochlorite doses, this difference tended to lessen and Lp/μ20reached a
quasi-stabilization for all pH values studied.
Fig. 5b reports the permeability values of membranes exposed to the same hypochlorite dose of 235.2 g h L! 1
(350 ppm – 672 h), at pH values ranging from 6 to 11. At this high hypochlorite dose and for all pH values studied, Lp/μ20increased to the same extent, reaching 1.9–
2.2 times the initial Lp/μ20value. As a conclusion, prolonged contact
with hypochlorite induced a pronounced gain in water transfer through the membrane, but, unlike the results regarding the mechan-ical properties, the permeability increase did not show clear depen-dency on the pH of the soaking solutions. Arkhangelsky et al.[9]and Yadav et al.[12]similarly reported a pure water permeability increase for PES and PES/PVP UF membranes and Rouaix et al.[17]reported a comparable increase on PSf/PVP membranes.
Changes of the membrane structure were also monitored by SEM imaging of the membrane cross-section.Fig. 1a presents an example of an image recorded at a magnification of 120 % . A whole set of images were performed on new and severely aged (235.2 g h L! 1
, pH 8) membrane cross-sections and internal surface (not shown here). Even at higher magnification (up to 10,000 % ), SEM imaging failed to detect any noticeable changes regarding the membrane macro-porous structure and surface aspect unlike several authors that observed surface cracking and pitting[10,11].
3.2. Molecular and supramolecular characterizations
Majority of the experiments reported in this section has been obtained with membrane samples soaked in hypochlorite solution at pH 8 since, according to previous results, this pH corresponds to
Fig. 3. Examples of tensile stress–strain curves of pristine membrane and mem-branes exposed to hypochlorite doses of 15.4 g h L! 1 (350 ppm – 44 h) and
92.8 g h L! 1(350 ppm – 265 h) at pH 8.
Fig. 4. Elongation at break εRof membranes exposed to various doses of sodium
hypochlorite at pH 6, 8 and 11 (a); elongation at break εRof membranes exposed to
the most severe modification in membrane mechanical properties and permeability.
3.2.1. PES and PVP degradation products identification
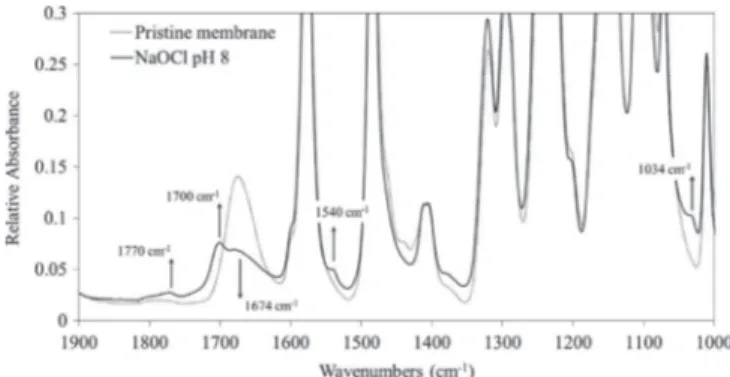
The ATR-IR spectra of pristine membrane and of membranes treated with a hypochlorite dose of 235.2 g h L! 1
(350 ppm – 672 h) at pH 8 are shown inFig. 6. The intensity of the IR band at 1674 cm! 1attributed to the stretching vibration of the amide unit
of the PVP[18], is lower in the hypochlorite-treated membrane than in the pristine one, which indicates either a degradation of the PVP or a decrease in PVP content in the first microns of the membrane surface.
This decrease comes with the appearance of four new bands: three bands at 1540 cm! 1, 1700 cm! 1and 1770 cm! 1ascribed to
PVP degradation products and the last one, at 1034 cm! 1
, attrib-uted to PES oxidation. Oxidation products of PVP were identified as succinimide (1700/1770 cm! 1) and a secondary amide
(1540 cm! 1
)[14]. Yadav et al.[11]similarly observed the appear-ance of a 1034 cm! 1band and they ascribed it to a sulfonic acid
resulting from the PES chain scission mechanism they proposed. In already published study, proof was made that this band does not correspond to a sulfonic acid and the IR band at 1034 cm! 1was
shown to reveal the formation of an ortho-substituted phenol on the PES backbone [14]. No other changes on the characteristic
bands of PES were detected. Those spectra changes contradict the observations made by Arkhangelsky et al. that reported no appearance of new bands, an unchanged PVP amide unit band and a decrease of the 1485 cm! 1
band[9].
The impact of the hypochlorite solution pH value on the decrease of the IR band of PVP was also investigated. Fig. 7
presents the PVP band (1674 cm! 1
) relative absorbance, normal-ized back to the initial value of the pristine membrane (A1674(t)/
A1674(t0)) as a function of the hypochlorite dose. Results are
reported for pH 6, 8 and 11. For all pH values studied, the normalized relative absorbance of the PVP band decreased for increasing hypochlorite dose. The PVP band intensity decrease was prompter and more significant for pH 8 than for pH 6 and 11.
XPS measurements were also conducted to investigate the chemi-cal composition of the membrane surface upon hypochlorite treat-ment. Results in terms of elemental concentration obtained for pristine and 84 g h L! 1
, pH 8 treated membranes are reported in former work [16]. Since PES and PVP monomer units respectively carry only one sulfur atom (S) and one nitrogen atom (N), the N/S atomic ratio is a direct evaluation of the fraction of PVP present on the membrane surface. The N/S atomic ratios were 0.44 for the pristine membrane and 0.30 for the 84 g h L! 1, pH 8 treated membrane. Using
the molar weight of PES and PVP monomers (232 g mol! 1
and 110 g mol! 1respectively), it can be calculated that PVP accounts for
17.1 wt% on the pristine membrane surface and 12.3 wt% on the aged membrane surface. Those results demonstrate that hypochlorite exposure does not only induce PVP degradation as shown by the appearance of new IR bands, but it also affects the PVP content of the membrane. Since no modification of the IR spectra and the N/S atomic
Fig. 5. Permeability of membranes exposed to various doses of sodium hypochlor-ite at pH 6, 8 and 11(a); normalized permeability of membranes exposed to hypochlorite at a dose of 235.2 g h L! 1(350 ppm – 672 h) at various pH values (b).
Fig. 6. ATR-FTIR spectra of the intern surface of a pristine membrane and an aged membrane (235.2 g h L! 1at pH 8).
Fig. 7. Normalized relative IR absorbance of the 1674 cm! 1band measured on
ratio was observed after soaking in water; conclusion can be made that the PVP degradation leads to its release from the membrane. Consequently, the decrease of the 1674 cm! 1
IR band can be imputed to both degradation and loss of PVP within the membrane material. 3.2.2. Molecular analysis within the membrane thickness
The changes of the 1674 cm! 1
band intensity were studied over the thickness of the membrane in order to quantify the initial PVP content within the pristine membrane structure and to correlate it to the PVP oxidation/release for the aged samples.
Fig. 8presents, for pristine and hypochlorite treated membranes, the normalized PVP band relative absorbance as a function of the distance (d) from the membrane internal surface (d0). For both the
pristine and the aged membranes, the normalization of the 1674 cm! 1
band relative absorbance was calculated using the band relative absorbance of the pristine membrane, before abrasion (A1674(d)/
A1674(d0)). Presence of PVP was significantly detected only within the
first 30 μm of the membrane thickness and contact with hypochlorite causes the PVP band to decrease. Additionally, Fig. 7 reports gray values obtained from processing of a membrane cross-section SEM image (presented in the lower part of the figure). The cross-section SEM image of the pristine membrane was binarized using arbitrary chosen thresholds. IMAGEJ software was then used to plot the gray value
graph: the y-axis representing the averaged intensities of pixels along a vertical line within the binarized image and the x-axis representing the distance of the vertical line from the left side of the image.
We define here a structure presenting large voids or pores (larger than 1 mm) easily detectable by SEM imaging as macro-porous. The gray value plot is then used as a macroporosity indicator: high and low gray values will respectively correspond to a macroporous and a denser material. It was found that PVP presence precisely coincides with the non-macroporous portion of the membrane cross-section. Note that the same type of observa-tions can be made regarding the external part of the membrane
cross-section which also presents a relatively dense structure containing PVP (results not shown).
The ATR-IR spectra obtained from the internal surface to a thickness of 77 mm on an aged membrane are reported inFig. 9. It can be observed that the 1034 cm! 1band, corresponding to the
PES oxidation was only present for thickness values where the PVP (1674 cm! 1) and PVP degradation products (1700/1770 cm! 1) are
present (i.e. approximately 30–40 mm). This observation demon-strates that the presence of PVP and/or PVP degradation products is a required condition for PES oxidation to occur.
3.2.3. Impact of membrane degradation at supramolecular scale Modification of the molar weight distribution of the membrane polymers was characterized by SEC. Measurements were carried out on pristine and aged membrane materials dissolved in DMF. Chromatograms exhibited a monomodal distribution, PVP was then assumed to be in too small concentration in the overall membrane material to be detected by SEC. The average molar weight (Mw) and the polydispersity index (Mw/Mn) obtained for
new and hypochlorite treated membranes were reported in former work[16]. Even at high dose (235.2 g h L! 1
) and at pH 8, hypo-chlorite exposure did not show any significant impact on the Mw
and Mnof the PES with a constant Mwof 40,20072200 g mol! 1
and a Mw/Mnof 2.55 70.1. Former work has shown a significant
decrease of Mwof hypochlorite exposed polysulfone (PSf)
mem-branes [17]. PES appears to be more stable as compared to PSf when exposed to hypochlorite. This result was explained by the presence of a labile hydrogen in the PSf structure[14].
To study the impact of hypochlorite exposure on the PVP moieties at the very surface of the membranes, we used the AFM with nanoscale thermal analysis module. This Vita-mode allows us to determine the deflection temperature corresponding to the glass temperature (Tg) of the polymer at the very surface of
the membrane. The Vita-analysis was combined with depth abrasion to study the evolution of the Tgof the polymer within
the thickness of the membrane (from the inner layer to the outer layer). Results are reported inFig. 10.
Curves reported in Fig. 10 show the evolution of the glass transition of the polymer as a function of the distance from the internal surface of pristine and aged membranes. At the very surface of the pristine membrane, the Tgis 165 1C which is in the
range of the Tg values commonly reported for PVP [19–21]. By
monitoring the Tgfrom the inner surface to the membrane bulk, an
increase of Tgis observed till reaching 200 1C (corresponding to
the PES Tg[22–24]) at a distance of 40 mm from the inner surface.
The first 40 mm membrane layer corresponds to high density area of the membrane with high PVP concentration. Same analysis was performed on membranes submitted to hypochlorite exposure (235.2 g h L! 1
, pH 8). Ageing provoked an important decrease of Tg
Fig. 8. PVP profile analysis on membrane thickness (1674 cm! 1band) on pristine
and aged (235.2 g h L! 1at pH 8) membrane samples.
Fig. 9. ATR-IR profile analysis from the internal surface to a thickness of 77 mm on a membrane treated with 235.2 g h L! 1NaOCl at pH 8.
at the very surface of the membrane from 165 1C to 138 1C; this decrease goes along with a significant increase of the standard deviation due to the high degradation of the membrane surface. After ageing, no modification of the Tgin the membrane bulk was
observed, meaning that no chain scission occurred in the mem-brane part exempt of PVP. The decrease of the Tgis a direct proof
that the degradation of the membrane involves chain scissions of the PVP moieties. Chain-scissions in PVP are anticipated to weaken the structure and contribute to the loss of mechanical properties of the membrane.
3.2.4. Identification of the active species: OHdradicals
The ATR-FTIR spectra of pristine membrane and of membranes treated by thermo-oxidation according to the protocol presented inSection 2.3are shown inFig. 11. This type of treatment leads to ageing of polymer by oxidation involving HOdradicals[25].
The evolution of the characteristic IR bands on thermo-oxidized membrane was similar to the one observed on hypochlorite-treated membrane: decrease of the band at 1674 cm! 1and appearance of
three new bands at 1034, 1700 and 1770 cm! 1. From these results,
we assumed that PES/PVP membrane degrades by radical oxidation. To validate the assumption that the membrane degradation may be induced by radical attack, a set of hypochlorite ageing tests (pH 8, 350 ppm) was performed with the addition of an excess of a radical scavenger, the 2-methylpropan-2-ol (tBuOH, 2 g L! 1) in the
soaking bath. This radical trap readily reacts with free radical compounds potentially present in solution[26], slowing down the membrane degradation kinetics if radicals are involved. Mem-brane samples were characterized by tensile testing and ATR-IR measurements for several hypochlorite doses ranging from 7 to 93 g h L! 1, results are given inFig. 12. Regarding the mechanical
properties, the addition of tBuOH significantly inhibited the membrane embrittlement for the whole range of hypochlorite dose studied (Fig. 12a). At molecular scale, the analysis of the PVP band for an exposure of 93 g h L! 1 with and without tBuOH
(Fig. 12b), clearly highlights the inhibiting effect of tBuOH. Indeed, the PVP band drop is drastically limited with the addition of tBuOH. Those results, together with the thermo-oxidation experi-ments, provide strong indications for a radical induced PVP degradation at pH 8.
3.3. Discussion
Ageing of membrane by radical oxidation involving HOd
radi-cals being demonstrated, the maximal degradation observed at pH
8 can be explained. According to Wienk et al., the production of HOdradicals in hypochlorite solution requires the coexistence of
hypochlorous acid (HClO) and hypochlorite ion (ClO!
) species[3]: HClO+ClO! -dClO+Cl!+dOH dOH+ClO! -dClO+OH! dClO+ClO! +OH!-2Cl!+O2+dOH HClO+3ClO! -3Cl!+O2+dClO+dOH
If we refer to the chlorine dissociation curve presented inFig. 2, pH 8 value corresponds to a HClO/ClO!
ratio of 1/3, which is precisely the stoichiometric condition for the mechanism leading to free radicals production reported by Wienk et al. The most severe degradation would then occur when HClO and ClO!species
are non-negligibly present in solution (i.e. for pH 8 and pH 7 values), as it was observed above.
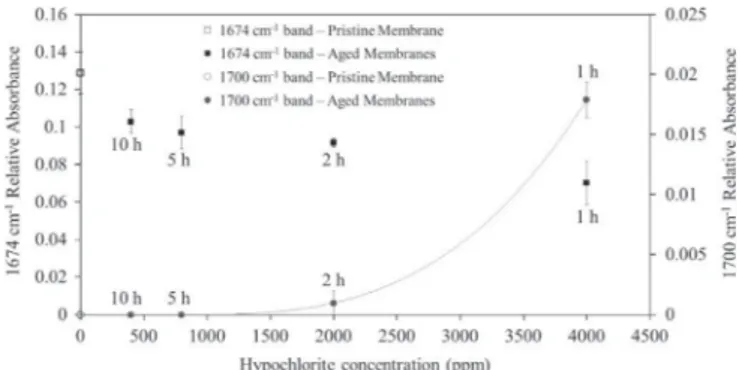
Degradation mechanism being elucidated, question may be raised on the ageing protocols representativeness regarding the actual on-site hypochlorite induced degradation. Two assumptions were made for the design of those experiments: (a) intermittent exposure to hypochlorite over a long period of time is equivalent to a continuous exposure, and (b) the degradation progress is only governed by the hypochlorite dose ([TFC] % exposure time) membranes have been exposed to. Regarding the hypochlorite dose, it appears crucial to confirm or reject such an assumption. To this end, we investigated the effect of the [TFC] on the membrane degradation progress. Pristine membranes were immersed in chlorinated water at various concentrations (ppm) during various durations (h) in order to reach the same total dose of 4000 ppm h (4 g h L! 1): for example 400 ppm
during 10 h and 4000 ppm during 1 h. The degradation of the membranes was then evaluated by the IR-ATR measurement of the relative absorbance of the PVP amide band (1674 cm! 1) and of the
PVP oxidation band (1700 cm! 1) as shown inFig. 13.
Results reported inFig. 13clearly demonstrate that for the same total dose quite different effects can be observed at high and low [TFC]. A high concentration significantly increases the oxidation rate com-pared to a low concentration. Consequently it is not possible to compare two ageings with quite different chlorine concentrations. Nevertheless, one can also observe that for [TFC] of 400 ppm and 800 ppm, membranes underwent the same extent of degradation (same PVP band decrease and no detectable oxidation products) when exposed to the same hypochlorite dose. The assumption that degrada-tion rate is only governed by the hypochlorite dose the membrane is exposed to appears then to be valid on a limited [TFC] range. For high [TFC], the concentration impact on the degradation rate is no longer negligible and has to be taken into account. This is the reason why accelerated ageing experiments using higher concentration and shorter exposure time as compared to on-site operation may over-estimate the membrane degradation for the same hypochlorite dose. In our case, the [TFC] of 350 ppm chosen for the study was selected to be within the concentration range encountered during on-site opera-tion (20–400 ppm).
Fig. 10. Evolution of the deflection temperature (Tg) as a function of the distance
from the internal surface of pristine and aged membranes (235.2 g h L! 1, pH 8).
Fig. 11. ATR-IR spectra of pristine membrane and membranes treated by thermo-oxidation at 100 1C during 60 days.
Based on the performances modification induced by the con-tact with hypochlorite solution, results were analyzed to correlate the macroscopic properties to the molecular changes. Pure water permeability Lp/μ20is an intrinsic membrane characteristic mainly
governed by the size distribution of pores of the selective layer. Dislodgement of PVP from the membrane may also free up access to new pores and enlarge existing pores in the membrane active
layer, leading to an increase of Lp/μ20[27]. For the early stages of
the degradation, results shown that the decrease of the PVP IR band corresponds to an increase of Lp/μ20, meaning that the PVP
removal leads to an increased active layer accessible porosity. As the degradation is more advanced, Lp/μ20reaches a plateau (for a
lower dose at pH value closer to 8). Assumption is made that beyond a given hypochlorite dose (function of the pH of the solution), the degradation and removal of the majority of the PVP accessible within the selective layer (within a thickness of 10– 100 nm) has occurred. This relatively stable state of the membrane skin thus leads to stabilization of the water transfer properties.
Furthermore, it was shown that PVP and PES degradation only occurs in an approximately 30–40 μm thick region under the membrane surface, corresponding to the area where PVP is mainly present in the pristine membrane. Since this region also happened to be free of macrovoids and substantially denser than the membrane bulk, it can be thought that its degradation advancement will impact the mechanical resistance of the overall membrane.Fig. 14presents the changes of elongation at break εRversus the PVP IR band relative
absorbance normalized back to the pristine membrane value. A compilation of the data collected at pH 6, 8 and 11 for a wide range of hypochlorite doses is reported. This figure shows that the mechanical properties of the membrane are not significantly altered until the intensity of the 1674 cm! 1band reaches 80% of its initial
value. For lower intensity corresponding to more severe PVP oxida-tion and/or removal, very severe decrease in elongaoxida-tion at break was observed. At this stage of the degradation, the PVP attack may lead to the outbreak of localized structural weakness. Some of those structural defects might then be considerable enough for facilitating crack propagation.
Autopsy and characterization of similar PES/PVP membranes extracted from an operated industrial module were additionally conducted. In place cleanings of this module were performed using hypochlorite and the module operated over a period of 6 years in a French water production plant. Nevertheless, the exact history of operation, and especially the hypochlorite dose the module was exposed to, is unknown. Samples extracted from the on-site operated module were analyzed by tensile testing and ATR-IR. Results regarding εR and the PVP IR band intensity are
reported inFig. 14. PVP IR band intensity decreases of approxi-mately 28% as compared to the pristine membrane. This decrease goes along with the appearance of the PVP oxidation products at 1700/1770 cm! 1(not presented here). The relationship between ε
R
and the PVP IR band intensity established by laboratory ageing experiments outstandingly predicted the extent of membrane embrittlement observed for the on-site operated samples. Conse-quently, it can be concluded that laboratory continuous hypo-chlorite exposure at 350 ppm and on-site intermittent hypochlorite exposure lead to the same structural and molecular changes of PES/PVP membranes.
Fig. 12. Membrane elongation at break εRas a function of hypochlorite dose when
exposed to 350 ppm NaOCl solutions at pH 8, with and without tBuOH (a); ATR-IR spectra of pristine membrane and pH 8 hypochlorite-treated membranes at 93 g h L! 1, in the presence and in the absence of tBuOH (b).
Fig. 13. Relative ATR-IR absorbance of the 1674 cm! 1 PVP band and of the
1700 cm! 1PVP oxidation band measured on membranes exposed to the same
hypochlorite dose of 4000 ppm h (4 g h L! 1), at various [TFC] at pH 8; for each
measurement, the contact duration (h) is reported.
Fig. 14. Elongation at break versus PVP normalized IR band relative absorbance for various hypochlorite exposure conditions.
4. Conclusion
This study undertook a multi-scale analysis of the degradation of PES/PVP UF hollow fiber membranes when exposed to hypo-chlorite. It was confirmed that hypochlorite exposure induces PVP radical degradation (involving PVP chain scissions) and dislodge-ment from the PES matrix, leading to an increase of the pure water permeability and to an embrittlement of the membrane. A direct relationship between elongation at break and PVP IR band intensity changes was established. Advanced chemical analysis brought direct evidence of PES oxidation without chain scission, occurring only within the first 40 mm of the membrane thickness, where PVP is present. It was demonstrated that the presence of PVP and/or PVP degradation products is a required condition for PES oxidation to occur. The first 40 mm of the membrane thickness were also shown to be substantially denser (free of macrovoids) as compared to the membrane bulk.
PVP additive, accounting for a few wt% in the membrane matrix, is then responsible for the membrane integrity loss. In order to maximize the on-site operation lifetime, membrane formulation and processing parameters may be adjusted to facil-itate PVP migration and concentration to the active layer and minimize the presence of PVP in the 40 mm thick layer. Since this 40 mm thick layer appears to mainly provide the mechanical resistance of the overall membrane, adjustment of processing parameters may also be done to obtain a less asymmetric mem-brane structure, with a macrovoids free bulk, exclusively com-posed of PES polymer.
Hypochlorite exposure conditions and especially the pH were demonstrated to be of crucial importance in the degradation rate. In light of those results, it can be suggested to avoid as much as possible aqueous hypochlorite solutions with pH value between 7 and 8 when performing in-place cleanings.
Acknowledgments
Financial support from the French National Research Agency is gratefully acknowledged. Authors are grateful to Aurelien Tournebize for his help with the VITA-AFM analysis.
References
[1]N. Porcelli, S. Judd, Chemical cleaning of potable water membranes: a review, Separation and Purification Technology 71 (2010) 137–143.
[2]A.J. Gijsbertsen-Abrahamse, E.R. Cornelissen, J.A.M.H. Hofman, Fiber failure frequency and causes of hollow fiber integrity loss, Desalination 194 (2006) 251–258.
[3]J. Carrell Morris, The acid ionization constant of HOCl from 5 to 351, Journal of Physical Chemistry 70 (1966) 3798–3805.
[4]C.G White, Handbook of Chlorination and Alternative Disinfectants, 4th ed., Wiley-Interscience Publication, USA, 1999, 212–287.
[5]I.M. Wienk, Twente University, NL, 1993. (Ph.D. thesis).
[6]I.M. Wienk, E.E.B. Meuleman, Z. Borneman, T. Boomgaard, Chemical treatment of membranes of a polymer blend: mechanism of the reaction of hypochlorite with poly(vinyl pyrrolidone), Journal of Polymer Science 33 (1995) 49–54. [7]J.J. Qin, M.H. Oo, Y. Li, Development of high flux polyethersulfone hollow fiber
ultrafiltration membranes from a low critical solution temperature, Journal of Membrane Science 247 (2005) 137–142.
[8]F. Thominette, O. Farnault, E. Gaudichet-Maurin, C. Machinal, J.C. Schrotter, Ageing of polyethersulfone ultrafiltration membranes in hypochlorite treat-ment, Desalination 200 (2006) 7–8.
[9]E. Arkhangelsky, D. Kuzmenko, V. Gitis, Impact of chemical cleaning on properties and functioning of polyethersulfone membranes, Journal of Mem-brane Science 305 (2007) 176–184.
[10]E. Arkhangelsky, D. Kuzmenko, N.V. Gitis, M. Vinogradov, S. Kuiry, V. Gitis, Hypochlorite cleaning causes degradation of polymer membranes, Tribology Letters 28 (2007) 109–116.
[11] K. Yadav, K.R. Morison, M.P. Staiger, Effects of hypochlorite treatment on the surface morphology and mechanical properties of polyethersulfone ultrafil-tration membranes, Polymer Degradation and Stability 94 (2009) 1955–1961. [12]K. Yadav, K.R. Morison, Effects of hypochlorite exposure on flux through polyethersulfone ultrafiltration membranes, Food and Bioproducts Processing 88 (2010) 419–424.
[13]S.H. Hamid, Handbook of Polymer Degradation, 2nd ed., Marcel Dekker, USA, 2000, 671–698.
[14]R. Prulho, S. Thérias, A. Rivaton, J.L. Gardette, Ageing of polyethersulfone/ polyvinylpyrrolidone blends in contact with bleach water, Polymer Degrada-tion and Stability 98.6 (2013) 1164–1172.
[15]C. Causserand, S. Rouaix, J.P. Lafaille, P. Aimar, Ageing of polysulfone mem-branes in contact with bleach solution: Role of radical oxidation and of some dissolved metal ions, Chemical Engineering and Processing: Process Intensi-fication 47 (2008) 48–56.
[16]B. Pellegrin, E. Gaudichet-Maurin, C. Causserand, Mechano-chemical ageing of PES/PVP ultrafiltration membranes used in drinking water production, Water Science and Technology: Water Supply 13.2 (2013) 541–551.
[17] S. Rouaix, C. Causserand, P. Aimar, Experimental study of the effects of hypochlorite on polysulfone membrane properties, Journal of Membrane Science 277 (2006) 137–147.
[18]F. Hassouna, S. Therias, G. Mailhot, J.L. Gardette, Photooxidation of poly(N-vinylpyrrolidone) (PVP) in the solid state and in aqueous solution, Polymer Degradation and Stability 94 (2009) 2257–2266.
[19]J.E. Mark, Polymer Data Handbook, 1st ed., Oxford University Press, New York, NY, 1999, 962–964.
[20] K. Sakurai, T. Maegawa, T. Takahashi, Glass transition temperature of chitosan and miscibility of chitosan/poly(N-vinyl pyrrolidone) blends, Polymer 41 (2000) 7051–7056.
[21]H. Xu, S.W. Kuo, J.S. Lee, F.C. Chang, Glass transition temperatures of poly (hydroxystyrene-co-vinylpyrrolidone-co-isobutylstyryl polyhedral oligosilses-quioxanes), Polymer 43 (2002) 5117–5124.
[22] J.E. Mark, Polymer Data Handbook, 1st ed., Oxford University Press, New York, NY, 1999, 480–482.
[23] T. Sasuga, H. Kudoh, T. Seguchi, High energy ion irradiation effects on polymer materials—changes in mechanical properties of PE, PSF and PES, Polymer 40 (1999) 5095–5102.
[24] Y. Li, T.S. Chung, C. Cao, S. Kulprathipanja, The effects of polymer chain rigidification, zeolite pore size and pore blockage on PES–zeolite: a mixed matrix membranes, Journal of Membrane Science 260 (2005) 45–55. [25] V.V. Krongauz, M.T.K. Ling, Photo-crosslinked acrylates degradation kinetics,
Journal of Thermal Analysis and Calorimetry 96 (2009) 715–725.
[26] J. Staehelln, J. Hoigné, Decomposition of ozone in water in the presence of organic solutes acting as promoters and inhibitors of radical chain reactions, Environmental Science and Technology 19 (1985) 1206–1213.
[27] S.H. Wolff, A.L. Zydney, Effect of bleach on the transport characteristics of polysulfone hemodialyzers, Journal of Membrane Science 243 (2004) 389–399.
![Fig. 2. HClO and ClO ! species dissociation curve at 20 1C, obtained by calculation, ð2Þ using pK a (HClO/ClO ! )¼ 7.58 at 20 1C [3].](https://thumb-eu.123doks.com/thumbv2/123doknet/3572947.104677/4.892.122.383.852.1116/hclo-species-dissociation-curve-obtained-calculation-using-hclo.webp)