i
UNIVERSITÉ DE SHERBROOKE
Faculté de génie
Département de génie chimique et de génie biotechnologie
DÉVELOPPEMENT D'OUTILS NIR ET DE
METHODES POUR MONITORER DES PRODUITS
DE LYOPHILISATION
DEVELOPMENT OF NIR-BASED TOOLS AND METHODS FOR
MONITORING FREEZE-DRYING PRODUCTS
Mémoire de maîtrise
Spécialité: Génie chimique
Azheruddin MOHAMMED
Sherbrooke (Québec) Canada
Septembre 2020
ii
MEMBRES DU JURY
Ryan GOSSELIN
(Director)
Antoine COURNOYER
(Industrial Supervisor)
Nicolas ABATZOGLOU
(Evaluator & Rapporteur)
François GITZHOFER
(Evaluator)
i
To,
ii
ABSTRACT
The demand to achieve improved drug product quality has been accelerated with the advent of quality by design (QbD) guidance launched by regulatory agencies around the world. This extends to freeze-drying processes, where bio-pharmaceutical products are dried under an extremely controlled environment. Freeze-drying, or lyophilization, is a low-temperature dehydration process that involves multistep transformations making use of the principles of heat & mass transfer. This often renders the process complicated and time-consuming, resulting in large operating costs.
Multiple process analytical technology (PAT) tools have been introduced to monitor product quality attributes in batch dried vials, as these tools help in keeping an eye on the product/process to achieve acceptable product quality attributes. Despite significant advances, many topics remain to be addressed. One of them being the impact of spatial variations in the product attributes, thus rendering the accuracy of in-process results obtained from a single point on the vial surface questionable. Another being the aesthetic appearance of the product, specifically collapse inside the products, which is usually assessed by visual inspection. However, relying completely on human input can be fallible and unrealistic in the production environment as thousands of product vials roll out from the freeze-dryers. Failure to detect an aesthetic defect in the finished freeze-dried product cake may put a patient’s life at risk as any defect might be a result of product collapse or meltback affecting the drug safety and efficacy. This project consisted of two main areas of work. 1) Using NIR Chemical Imaging (NIR-CI) and NIR spectroscopy (NIRS) to investigate the spatial variability of moisture on the surface of the vials undergoing drying. Furthermore, it demonstrates the necessity of using multiple measurement points on the vial surface to quantify moisture inside the freeze-drying products. 2) Using NIRS to identify the physical properties of the product, such as normal or collapsed product. This is performed by leveraging the ability of NIRS to exhibit unique spectra relative to the physical characteristics of the product. Two intensities of collapse were induced in the freeze-drying products, and the potential of NIRS in identifying the collapse during the process and in the finished freeze-dried products was demonstrated.
iii
Results show the promising nature of the NIR-CI and NIRS in combination with the multivariate data analysis (MVDA) methods to monitor product quality attributes and better understand their variability. Overall, this thesis work presents a detailed investigation about the moisture distribution and collapse inside the freeze-dried products.
iv
RÉSUMÉ
La demande d'amélioration de la qualité des produits pharmaceutiques a été accélérée avec l'avènement des directives de qualité par la conception (QbD) lancées par les agences de réglementation du monde entier. Cela s'étend aux procédés de lyophilisation, où les produits biopharmaceutiques sont séchés dans un environnement extrêmement contrôlé. La lyophilisation est un de déshydratation à basse température qui implique des transformations en plusieurs étapes utilisant les principe de transfert de chaleur et de masse. Cela rend souvent le procédé compliqué et long, ce qui entraîne des coûts d'exploitation importants.
Plusieurs outils de technologie d'analyse de processus (PAT) ont été introduits pour surveiller les attributs de qualité du produit dans des flacons séchés par lots, car ces outils aident à garder un œil sur le produit / procédé pour obtenir des attributs de qualité de produit acceptables. Malgré des avancées significatives, de nombreux sujets restent à traiter. L'un d'eux est l'impact des variations spatiales dans les attributs du produit, rendant ainsi la précision des résultats en cours de procédé obtenus à partir d'un seul point sur la surface du flacon discutable. Un autre est l'aspect esthétique du produit, qui est généralement évalué par une inspection visuelle. Cependant, se fier entièrement à l'apport humain peut être problématique et irréaliste dans l'environnement de production, car des milliers de flacons de produit sortent des lyophilisateurs. Le fait de ne pas détecter un défaut esthétique dans le gâteau de produit lyophilisé fini peut mettre la vie d'un patient en danger, car tout défaut peut être le résultat de l'effondrement du produit (meltback) affectant l'innocuité et l'efficacité du médicament.
Ce projet comprenait deux thèmes principaux. 1) Utilisation de l'imagerie chimique NIR (NIR-CI) et de la spectroscopie NIR (NIRS) pour étudier la variabilité spatiale de l'humidité à la surface des flacons en cours de séchage. 2) Utilisation de NIRS pour identifier les propriétés physiques du produit, en tirant parti de la capacité du NIRS à présenter des spectres uniques par rapport aux caractéristiques physiques du produit. Deux intensités d'affaissement ont été induites dans les produits de lyophilisation, et le potentiel du NIRS dans l'identification de l'effondrement pendant le procédé et dans les produits lyophilisés finis a été démontré.
Les résultats montrent la nature prometteuse du NIR-CI et du NIRS en combinaison avec les méthodes d'analyse de données multivariées (MVDA) pour surveiller les attributs de qualité
v
des produits et mieux comprendre leur variabilité. Dans l'ensemble, ce travail de thèse présente une étude détaillée de la répartition de l'humidité et de l'effondrement à l'intérieur des produits lyophilisés.
Mots clés: QbD; PAT; NIRS; NIR CI; Lyophilisation, distribution de l'humidité du produit; Effondrement du produit; MVDA
viii
ACKNOWLEDGMENTS
Throughout this research work I have received a great deal of support and assistance.
First of all, I would like to thank my research director Professor Ryan Gosselin for offering me an opportunity to work on this thesis, I will always be grateful to you. Also, I am thankful to my industrial supervisor Antoine Cournoyer, you both have given me valuable learnings in my life. Special thanks to Jean-Sébastien Simard (Pfizer, Canada) along with Prof. Nicolas Abatzoglou and Prof. Ryan Gosselin for managing Pfizer PAT research chair and providing funding for this project.
A sincere thanks to jury (Ryan Gosselin, Nicolas Abatzoglou, Antoine Cournoyer, François Gitzhofer) for taking out time to evaluate my work.
I am thankful to Henri Gauvin and Valérie Larouche for offering help with my experiments and other logistics. I would like to thank all my colleagues and friends on both the Pfizer and UdeS side for all their contributions and help during my thesis. Charlotte you were my first face to face Pfizer contact, I still remember your humble gesture of welcoming me at the Pfizer-Montreal site and helping me feel comfortable at the office. Barbara, I cannot thank you enough for all your help with Matlab coding and useful discussions we had together. Pierre-Luc, your help with French translation and offering me customized trainings in English is highly appreciated. Weiheng, you have always been like a brother figure for me in Canada, I still remember the day you invited us for dinner and made several delicacies adapting your cooking to match our taste, I owe you for all the favours you have done to me, especially for guiding with the needs of my newborn daughter. Yuwei, Mahamadou, Abdoulah, Frank-you all have been great companions and thanks for being a part of my journey.
On my family side, I would like to thank three special ladies of my life, My Mom for her prayers, My wife for her everlasting support in all the challenging times, and My Daughter for letting me forget the outside world at home and bringing cheer on my face. And special thanks to My Dad for teaching me an important life skill ‘perseverance’ and supporting me throughout my life.
ix
CONTENTS
RÉSUMÉ ... iv
ACKNOWLEDGMENTS ... viii
LIST OF ACRONYMS ...xiii
1. INTRODUCTION ... 1
1.1 Context and the research problem ... 1
1.2 Definition and objectives of the current research project ... 2
1.3 Original contributions ... 3
1.4 Document structure ... 4
2. STATE OF THE ART ... 5
2.1 Freeze-drying operation and the criticality of monitoring moisture inside the freeze-dried products ... 5
2.2 NIR tools used as Process Analytical Technologies (PATs) for monitoring Freeze-dried products ... 8
2.2.1 NIR Spectroscopy (NIRS) ... 8
2.2.2 NIR Chemical Imaging (NIR-CI) ... 9
2.3 Chemometrics and Multivariate data analysis (MVDA) tools... 10
2.3.1 Principal component analysis (PCA) ... 11
2.3.2 Partial least squares (PLS) ... 12
2.3.3. Partial least squares discriminant analysis (PLS-DA) ... 14
2.3.4. Linear discriminant analysis (LDA) ... 14
3. RESEARCH PAPER: An investigation into the spatial distribution of moisture in freeze-dried products using NIR spectroscopy and chemical imaging. ... 17
3.1 INTRODUCTION ... 20
3.2 MATERIALS AND METHODS... 22
3.2.1 Materials ... 22
3.2.2 Freeze-drying and sample collection procedure ... 22
3.3.3 NIR-CI ... 23
3.3.3 NIR Spectroscopy ... 23
3.3.4 Procedure to acquire images and spectra on the surface of the product vial ... 24
3.3.5 Treatment of the NIR-CI images ... 25
3.3.6 Representation of the NIR spectra ... 26
3.4 RESULTS AND DISCUSSION ... 27
x
3.4.2 Quantitative analysis using NIRS ... 31
3.5 CONCLUSIONS ... 34
4. Identifying collapse in freeze-dried products via NIR spectroscopy ... 36
4.1 INTRODUCTION ... 38
4.2 MATERIALS AND METHODS... 40
4.2.1 Sample preparation and NIRS measurement procedure ... 40
4.2.2 Data structure and Chemometric methods ... 41
4.3 RESULTS AND DISCUSSION ... 42
4.3.1 Identifying and classifying collapsed vs normal finished freeze-dried products ... 42
4.3.2 Identifying in-process collapse (meltback) in the products during the freeze-drying process ... 43
4.4 CONCLUSION: ... 45
5. Preliminary experiments to assess the suitability of NIR spectrometers and test formulation for monitoring moisture inside the freeze-dried products ... 46
5.1 INTRODUCTION ... 49
5.2 MATERIALS AND METHODS... 49
5.2.1 Sample preparation: ... 50
5.2.2 Data analysis ... 51
5.3 RESULTS AND DISCUSSION ... 53
5.4 CONCLUSIONS ... 55
6. CONCLUSION ... 56
7. FUTURE WORK ... 59
xi
LIST OF FIGURES
Figure 2-1 Schematic view of a freeze drying equipment (Adapted from Nathaniel Milton, Eli Lilly and Co) ... 6 Figure 2-2 Absorbance overtone bands of water specific to its physical state in the NIR region ... 9 Figure 3-1. Schematic representation of the vial showing the six angular positions and the field of view with the NIRS and NIR-CI tools... 24 Figure 3-2. Typical vial illustrating a typical cake as well as the background reference area used for standardizing the images. ... 25 Figure 3-3. Representation of the averaged and concatenated images using a typical freeze-dried sample (a single vial). The horizontal dimension of the image represents the diameter of the vial; the vertical dimension represents the product height inside the vial. ... 26 Figure 3-4. NIR spectra acquired on the vial surface at six different measurement angles represented in a 3D matrix. ... 26 Figure 3-5. Average images of freeze-dried samples containing moisture in the range of 85% to <1% (w/w). Averages represent all 118 samples divided into 10 different categories. ... 27 Figure 3-6. Histogram of the mean sample moisture vs. mean pixel intensity of NIR-CI images in the range of 85% to <1% (w/w) moisture. ... 28 Figure 3-7. Representative images of the freeze-dried samples containing moisture in the range of 85% to <1% (w/w). ... 29 Figure 3-8. Images of vials in the 3–11% (w/w) moisture range. This range presents the largest spatial variability. These vials are representative of the population. ... 30 Figure 3-9. Images of a few representative vials containing similar moisture levels, i.e., 5 ± 1% (w/w). ... 30 Figure 3-10. PLS VIP. Wavelengths with values >1 are considered important for predicting moisture. ... 32 Figure 3-11. Box and whisker plot of the moisture predictions comparing the RMSEC and REMSEP values. ... 33 Figure 4-1 Representation of collapse in typical freeze-drying samples. (Left) Partially collapsed and (right) fully collapsed/melt-back samples. ... 40 Figure 4-2 Representation of typical finished freeze-dried samples. (Left) Normal cake, (center) partially collapsed, and (right) fully collapsed/melt-back samples. ... 41 Figure 4-3. Scores and loadings plot of finished freeze-dried products. (a) PCA score plot. (b) PLS-DA score plot. (c) LDA score plot. (d) LDA loadings plot. ... 43 Figure 4-4 Scores and loadings plots of freeze-drying (in-process) products. (a) PCA score plot. (b) PLS-DA score plot. (c) LPLS-DA score plot. (d) LPLS-DA loadings plot ... 44 Figure 5-1 (a) NIR-A raw spectra of freeze-dried samples with 0-30% (w/w) Moisture. (b) PCA score plot of NIR-A spectra; spectra and data points in PCA plot are labelled and colored according to theoretical moisture%. ... 53 Figure 5-2 (a) NIR-B raw spectra of freeze-dried samples with 0-30% (w/w) moisture. (b) NIR-B raw spectra of freeze-dried samples with 0-30% (w/w) moisture; spectra are labelled and colored according to theoretical moisture%. ... 54
xii
LIST OF TABLES
Table 2-1 Application of NIR-based Chemometric methods in freeze-drying ... 15
Table 5-1 Working wavelength range of NIR spectrometers and their focused moisture band ... 50
Table 5-2 Proportions of water and glycine required for calibration samples ... 50
Table 5-3 Proportions of water and glycine required for validation samples ... 51
xiii
LIST OF ACRONYMS
Acronym Definition
US FDA United States Food and Drugs Administration
EMA European Medicines Agency
WHO World Health Organization
USP United States Pharmacopeia
ICH International Conference on Harmonization
GMP Good Manufacturing Practices
QbD Quality by Design
PAT Process Analytical Technology
CQA Critical Quality Attribute
CPP Critical Process Parameter
RMC Residual Moisture Concentration
ASTM American Society of Testing and Materials
PARD Processes, Administration, Research and Development
NIRS Near-infrared spectroscopy
NIR-CI Near-infrared chemical imaging
SWIR Short Wave Infra-Red
TDLAS Tunable Diode Laser Absorption Spectroscopy
MVDA Multivariate Data Analysis
SNV Standard Normal Variate
SG Savitzky-Golay
PCA Principal Component Analysis
MCR Multivariate Curve Resolution
CLS Classical Least Squares
AWA Apparent Water Absorbance
PLS Partial Least Squares
PC Principal Component
PLS-DA Partial Least Squares-Discriminant Analysis
LDA Linear Discriminant Analysis
LD Linear Discriminant
RMSEC Root Mean Square Error in Calibration
RMSECV Root Mean Square Error in Cross-Validation
RMSEP Root Mean Square Error in Prediction
RMSE Root Mean Square Error
NIPALS Nonlinear Iterative Partial Least Squares
1
1.
INTRODUCTION
1.1
Context and the research problem
The global biopharmaceuticals market is a multibillion industry and is expected to grow approximately 10% to $446 billion by the middle of the next decade1. Roughly 50% of
biopharmaceutical products approved by FDA and EMA are freeze-dried2. Biotech
formulations containing aqueous solutions and which are sensitive to heat are dried in a highly controlled low-temperature environment. This helps in achieving enhanced product stability for distribution and storage. But freeze-drying is a complex process and may result in in-process and in-storage instabilities if the drying cycle is not properly designed and monitored. To address such issues encountered in different pharmaceutical unit operations, regulatory guidelines such as ICH Q8/Q9/Q10 focused on quality by design (QbD) approach were introduced. Following these guidelines, it is expected that the quality of the product is built into the process rather testing only a few samples or batches at the end of the process. These guidelines answers the questions related the current procedures of the ICH Quality Implementation. Process analytical technology (PAT) tools are a vital part of QbD in achieving the product quality. US-FDA states that the PAT is "a system for designing, analyzing, and controlling manufacturing through timely measurements (i.e. inline/online) of critical quality and performance attributes of raw and in-process materials and processes with the goal of ensuring final product quality"3. The goal to achieve QbD can be achieved using a combination
of PAT tools such as chemometric tools, process analyzers, endpoint monitoring tools, and knowledge management tools4. Since the launch of guidance on the use of PAT, researchers
have put immense efforts in the development and implementation of PAT for monitoring the freeze-drying processes.
PAT tools used in the monitoring of pharmaceutical freeze-drying operations are broadly classified into single vial and batch process monitoring technologies. Single vial focused techniques give information related to a given vial located at a specific position inside the freeze dryer, whereas the batch monitoring techniques yields the information of an overall batch undergoing the drying process. However, it was recently understood that vials exhibit variable
2
temporal drying profiles based on their spatial position inside the freeze-drying chamber, as there is a variability in pressure and temperature effects inside the freeze-dryer5,6,7,8. Neither
single vial focussed, nor the batch monitoring approaches, can account for the spatial variations in the quality attributes of the product. These temporal differences result in variability in quality attributes of the products within a batch, which can be minor variations in the quality of the product or a major product defect. For instance, if the vials in the center of the chamber still contain traces of ice compared to vials on the sides of the product chamber, and if the shelf temperature is increased it will selectively cause collapse or product defects in the vials located at the center of the chamber. Despite significant advances, there is still no in-line monitoring method to monitor defects during the freeze-drying process.
In light of this problem, this thesis centers on the evaluation of non-invasive NIR tools to implement them in-line to monitor freeze-drying processes. NIR chemical imaging and spectroscopy were used for the qualitative and quantitative examination of vials in order to clarify the spatial moisture variations on the surface of the vials during the freeze-drying process. Subsequently, NIR spectroscopy was evaluated to identify the physical characteristics of the product cake during the freeze-drying process. The ultimate objective of this thesis was to explore the potential of NIR tools and deepen our understanding of the freeze-drying products and the processes.
1.2
Definition and objectives of the current research project
Freeze-drying is a dehydration process that plays an important role in stabilizing the pharmaceutical formulations that are unstable in aqueous solutions. Residual moisture content
(RMC) can have a significant impact on the quality of the product. It can alter the physical state of the in-process products resulting in cake defects, whereas in the finished products it may affect product stability via microbial growth. Considering the consequential nature of residual moisture, it is deemed as one of the most significant critical quality attributes (CQAs). Various studies indicate that RMC influences other quality attributes in the finished products9,10,11,12.
RMC inside the product has been a topic of much work and NIR tools were developed and implemented for monitoring moisture inside the products during the process4,7,13,14,15 and inside
3
to be addressed. One of them being the impact of spatial variations in product attributes, thus the accuracy of in-process results obtained from a single point on the vial surface remain questionable. Also, the aesthetic appearance of the product is subject to acceptance by visual inspection. However, relying completely on human input can be fallible in the production environment as thousands of product vials roll out from the freeze-dryers. Failure to detect an aesthetic defect in the finished freeze-dried product cake may put a patient’s life at risk as any defect might be a result of product collapse or meltback affecting drug safety and efficacy. The main goal of this project is to develop tools and methods to monitor quality attributes of the freeze-dried products.
The core objectives of this project are:
1. To determine the spatial variability of moisture in the in-process freeze-dried products. A combination of NIR tools-chemical imaging and NIR spectroscopy were used to investigate spatial moisture variability. This was achieved by studying the intra-vial spatial variability using NIR-CI images acquired at different measurement positions, and the comparative PLS figures of merit obtained using the NIR spectra obtained at multiple measurement positions.
2. To identify the product state of in-process products and identify the characteristics of the finished freeze-dried products using NIR spectroscopy. This was achieved by inducing different degrees of melt back/collapse in products during freeze-drying and studying the product state/characteristics in the in-process and finished freeze-dried products.
1.3
Original contributions
This research work proposes a method to assess spatial variability of moisture within products during the freeze-drying process. This is needed to select an appropriate number of measurement spots on the product vial while working with point focused measurement PAT tools, more specifically while using NIR spectroscopic tools. This work also imparts understanding about the use of the NIR spectroscopy to identify the aesthetic appearance of the product both during the process and in the finished freeze-dried products. Contributions of this thesis work are presented in the form of research articles:
4
Paper 1: Peer-reviewed research article
An investigation into the spatial distribution of Moisture in Freeze-dried products using NIR spectroscopy and chemical imaging.
Paper 2: Research article
Identifying collapse in freeze-dried products via NIR spectroscopy.
1.4
Document structure
This thesis is organized into five main chapters, following is the outline of each chapter Chapter 1 presents introduction and the context, motivation and the defined objectives of this research work.
Chapter 2 consists of a review of the lyophilization process with emphasis on the critical quality attributes (CQA) and a special focus on the state of art tools/methods used throughout this thesis.
Chapter 3 presents the research work detailing an Investigation into the spatial variability of moisture inside in-process freeze-dried samples using near infrared (NIR) chemical imaging (CI) and spectroscopy
Chapter 4 presents the feasibility of using NIR spectroscopy to monitor the aesthetic appearance of in-process and the finished freeze-dried products.
Chapter 5 presents the summary of preliminary evaluation trials using different NIR spectrometers for monitoring the product moisture in in-process freeze-dried products. Chapter 6 presents the overall conclusions and potential future work for this project.
5
2.
STATE OF THE ART
The main focus of this thesis work involves developing NIR based methods to investigate spatial variations in moisture distribution & monitor the aesthetic appearance of the freeze-dried products. This work encompasses the use of NIR tools in tandem with chemometric methods to analyze properties of freeze-dried products, as data generated by the NIR tools alone is not enough to draw conclusions on the targeted properties. The first part of this chapter presents the freeze-drying operation and criticalities involved in monitoring the freeze-drying product/process, this is presented to enable one to understand the background of this research work. Then the basics of NIR based PAT tools, NIR spectroscopy and NIR chemical imaging, and their recent applications in the freeze-drying industry have been presented along with the chemometrics data analysis methods.
2.1
Freeze-drying operation and the criticality of monitoring
moisture inside the freeze-dried products
Freeze drying is an important unit operation in the manufacturing of pharmaceutical injectable-products, as it enhances product lyophilic nature and stability of the formulations19. The
product is subjected to highly controlled process conditions inside the freeze-dryer in order to perform drying20. First, the liquid formulation is filled inside glass vials and the vials are half
stoppered such that vapors can evacuate from the product. The vials are then placed on the trays and loaded on the shelves of the freeze-dryer. The shelves are cooled in a stepwise manner (typically -30 to -60°C) to freeze the product, which results in the formation of ice nuclei called nucleation phase and the solute is maximally freeze-concentrated.
The product is subjected to drying in steps after freezing, ensuring the temperature of the product is below its critical temperature representing the maximum temperature that the product can withstand during drying without melting or collapsing the product. These temperature limits are product specific and are determined beforehand using methods such as freeze-drying microscopy, differential scanning calorimetry and dielectric resistance analysis. For details of these methods following reference could be consulted21. In general, frozen products are
6
defined “eutectic” freezing/melting point that is also its collapse temperature. Amorphous products have a corresponding “glass transition” temperature and their collapse temperature is typically a few degrees celsius warmer than the glass transition temperature. For freeze-drying, the frozen product is exposed to high vacuum to sublimate the ice where the frozen liquid transforms to a gaseous state directly without going through a liquid phase which is referred to as initial drying phase, called as primary drying22. The shelf temperature is elevated in the range
of -30°C to -10°C which is done to provide suitable conditions for sublimation. The duration of the primary drying varies from hours to days depending upon the volume and nature of the product. Once the ice sublimation is finished the residual moisture bounded inside the product interstitial spaces is removed by desorption, also called secondary drying. In this step temperature of the shelf is elevated while maintaining the product temperature below glass transition temperature, typically between 0 to +40°C. Secondary drying usually takes a few hours and is relatively short compared to the whole length of the process. The product chamber is back-filled usually with nitrogen gas, and then vials are fully stoppered by pressing the shelves together hydraulically once the product is dried. Vials are unloaded and further sealed, labeled and packed after stoppering, and then stored under appropriate temperature conditions. Freeze drying equipment includes a temperature control system, vacuum System, product chamber, and condenser.
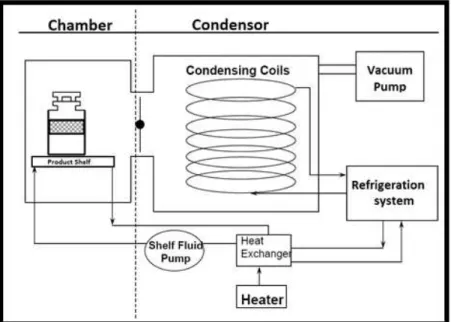
Figure 2-1 Schematic view of a freeze-drying equipment (Adapted from Nathaniel Milton, Eli Lilly and Co23)
7
Figure 2-1 presents different components of the freeze-drying equipment. The temperature is controlled by refrigeration and heating systems. The refrigeration system cools the condenser coils and shelves in the product chamber for adsorbing sublimed vapors on the condenser coils and freezing product inside the vials. The heating system with the aid of heat exchanger applies small amount of heat to the shelves during the drying stages. Advanced shelf freeze dryers consisting of microprocessor-based controllers are capable of controlling the shelf temperature within ±1°C of the set point within the control range of -55°C to 65°C.
The vacuum system consists of a separate vacuum pump connected to both an airtight condenser and a product chamber. Typically, vacuum levels for freeze drying are between 50mTorr and 300mTorr with 100mTorr to 200mTorr being the most common range. The required pressure inside the product chamber is maintained through a controlled flow of nitrogen, called nitrogen breathing.
The purpose of the condenser is to capture the vapors being sublimed off of the product. The condenser is maintained at a lower temperature relative to the product in the chamber, since vapors evacuating from the product chamber flows into the condenser chamber and gets deposited on the condenser coils in the form of an ice. The temperature in the condenser is usually between -55°C and -85°C.
The conditions under which the drying takes place determines the quality attributes in the finished freeze-dried products. Critical quality attributes, such as API state (e.g., protein conformation and stability), residual moisture content, freeze-dried product cake appearance, and reconstitution time are evaluated on randomly selected samples after the completion of the drying2. Studies have shown that moisture content is the most significant attribute that directly
or indirectly affects other mentioned product quality attributes9,10,11,12. A product containing
residual ice when subjected to secondary drying results in product collapse, and this affects the aesthetic appearance of the product10. The stability of the finished freeze-dried formulations is
also affected by their excess residual moisture. The following reference24 presents a review of
8
2.2
NIR tools used as Process Analytical Technologies (PATs)
for monitoring Freeze-dried products
Considering the regulatory requirements for the aseptic manufacturing of biopharmaceutical products, non-invasive and non-destructive testing tools are considered a boon in monitoring the freeze-dried products. Over the last decades, near-infrared (NIR) spectroscopy in combination with the light-fiber optics, new in and on-line probe accessories, and chemometrics evaluation procedures has emerged as a powerful PAT tool in various pharmaceutical applications. The widespread use has been further enhanced with the advancement in technology such as miniaturized optics, small footprints, and wireless functionality, making it a widely used non-invasive and non-destructive tool in in-line monitoring applications25.
Additionally, chemical imaging helps in studying the spatial variations on the surface of the product. Both techniques are complementary as NIR-CI provides spatial information related to moisture on the surface of the product, whereas spectroscopy allows penetrating the surface layers of the product.
2.2.1 NIR Spectroscopy (NIRS)
NIR spectroscopy is one of the most widely used PAT tools in manufacturing several different pharmaceutical formulations, it is embedded as an essential tool in monitoring various stages of pharmaceutical unit operations. The American Society of Testing and Materials (ASTM) defines the NIR region of the electromagnetic radiation as a narrow spectral region ranging in the wavelength range of 780-2520 nm. Many of the NIR spectral bands originate as a result of overtones and a combination of fundamental vibrations of C-H, O-H, N-H and S-H. For details about the principles and theoretical aspects of NIR measurement following reference may be consulted26.
Guidelines specific to the use of NIRS have been published by regulatory agencies like European Medicines Agency (EMA) and FDA considering the increasing use of NIR as PAT in monitoring various pharmaceutical operations 27,28. NIR spectroscopy is used in-line for
monitoring several different attributes such as in-line product moisture15,7, the progress of the
9
process conditions30 during the freeze drying process. NIRS spectra sensitivity to various forms
of water such as ice, liquid or vapour adds to its uniqueness in identifying normal (ice) or deviated (liquid) state of the product during the freeze-drying31. Figure 2-2 shows different
energy levels of absorbance overtone bands of water exhibited with the change in its state31.
The water absorbance band shifts from higher energy levels to lower energy levels when there is a change in the product’s physical state from liquid to ice.
Figure 2-2 Absorbance overtone bands of water specific to its physical state in the NIR region (Reprinted with permission from31.Copyright ©2007,Taylor &Francis Group LLC)
Besides, NIRS has sensitivities to the physical characteristics of products, and also to additional characteristics such as pore structure, which can helps in determining the normal or collapsed nature of the finished dried products. Despite the challenges in monitoring the freeze-drying products/process such as an isolated space, and limited access to the product undergoing drying inside the freeze-dryer, it is possible to monitor product inside the freeze-dryer chamber with the present generation of the miniaturized spectrometers and carry out real time qualitative and quantitative studies.
2.2.2 NIR Chemical Imaging (NIR-CI)
NIR-CI (NIR Chemical Imaging) facilitates visualizing surface of the sample to map the distribution of chemical components at wavelengths between 700-2500nm. A NIR imaging system essentially consists of a light source, optics, a spectrograph, and an array detector26.
NIR-CI is a new technique for the monitoring of freeze-dried products, and only a few studies have been reported for freeze-drying monitoring applications. However, a recent study32
10
specific to spin freeze-dried products, assessed the potential of NIR-CI in monitoring distribution of Mannitol solid form and moisture inside the freeze-dried products. Whereas, in the other pharmaceutical areas, researchers have successfully demonstrated the feasibility of using NIR-CI for different applications, a few of them include pharmaceutical powder blend concentration monitoring33, tablet uniformity34, and identifying the product polymorphic
forms35. The advantage of chemical imaging lies in the ability to demonstrate qualitative surface
heterogeneities with the quantitative information of the sample.However, the selectivity of the measurement method depends on the nature and distribution properties of samples.
2.3
Chemometrics and Multivariate data analysis (MVDA) tools
The biggest challenge in implementing analytical tools for monitoring any chemical processes is studying the vast number of variables to find the right variables that help to efficiently monitor and control processes. This is possible using Chemometrics, which is the science of extracting information from the acquired data with the use of mathematical and statistical procedures. Chemometrics is indeed an interdisciplinary branch that utilizes the knowledge from other sectors like multivariate statistics, applied mathematics, and computer sciences. Because of its multidisciplinary nature, chemometrics has emerged as an important subject in extracting information from the process data helping in enhanced process understanding thus enabling efficient process control.
Chemometrics include36: 1) data preprocessing, 2) classification, 3) calibration, and 4)
prediction and validation of the data. Statistical multivariate projection methods, also called multivariate data analysis (MVDA) methods are often used for the data exploration and calibration. These methods are being increasingly used in the PARD (Processes, administration, research and development).36 Several MVDA methods have been developed in the recent years,
review of these methods and their applications in various pharmaceutical processes has been presented by Rajalahti et.al. 37
Vibrational spectroscopic methods such as NIR and Raman spectroscopy in combination with multivariate data analysis methods such as PCA and PLS are most commonly used to monitor the freeze-drying processes.7,38 In two separate studies published by Beer et.al4,29 simultaneous
11
products during the freeze-drying process. In freeze-drying applications, PCA is generally used for data visualisation, and PLS is used for data interpretation.37 Other methods such as, partial
least squares discriminant analysis (PLS-DA), linear discriminant analysis (LDA), multivariate curve resolution (MCR) and classical least squares (CLS) have also been reported for studying the attributes of freeze dried products and processes.4,38,39
A few of the MVDA methods used throughout this project are discussed in the following sections.
2.3.1 Principal component analysis (PCA)
Principal component analysis (PCA) is one of the most widely used multivariate statistical method that forms the basis for multivariate data analysis.40 It transforms the large number of
original variables into a set of new orthogonal variables called principal components such that most of the information is contained in the first few components explaining maximum variance in the data.41 The first principal component (PC1) explains the largest variation in the data set,
PC2 explains the second largest variation and so forth. In PCA analysis, a data matrix is modelled as42
= + (2.1)
Where, T (N×A) is Scores, P (K×A) is loadings and E (N×A) is an error.
The product of T and PT is equal to the sum of the considered PCs and E is an error matrix
calculated after subtracting original matrix by the matrix originated after PCs were considered. E matrix has the same size as original matrix or X. The equation is given by
12
The matrix product TPT models the structure and the residual matrix E contains the noise. The
principal component scores of the first, second, third components (t1,t2,t3…) are columns of the
score matrix T. The scores are coordinates of the observations in the model hyper plane. Alternatively, these scores may be seen as new variables which summarises the old ones and they are sorted in order of descending importance. The meaning to the scores is given by loadings. Loadings of the first, second, third components (p1,p2,p3…) build up the loading
matrix PT. Loadings define the orientation of PC plane with respect to the original X-variables,
and informs the magnitude of correlation (large or small) and the manner in which the measured variables contribute to the scores.
Prior to carrying out PCA analysis, data is typically pre-processed by centering and scaling to unit variance. Plots of the PCA show the relationship among observations’ including the outliers.
2.3.2 Partial least squares (PLS)
PLS is the regression extension of PCA, PLS stands for projection to latent structures by means of partial least squares. It is used to connect the information in two blocks of variables X and Y to each other by linear multivariate model43. PLS is mainly useful in dealing with the noisy,
co-linear and incomplete variables in both X and Y36. PLS models the relations between the X and
Y blocks by means of score vectors, and it decomposes the (N×K) matrix of variables X and the (N×M) matrix of variables Y into the form represented as43
= + (2.3)
= + (2.4)
Where the T, U are (N×A) matrices of the p extracted score vectors respectively, the columns of P and C represents the matrices of loadings. E and F are just model residuals. In PLS, summary of the importance of X-variables for both Y and X is given by variable influence on projection (VIP) plot. The VIPs are a weighted sum of squares of PLS weights that are calculated by explained Y-variance in each dimension36. The attraction of VIP lies in its mode
of providing information in the simplest form with only vector summarizing all the components and Y-variables.
Several methods have been developed to calculate PLS model such as the NIPALS algorithm, SIMPLS and Kernel algorithm. However, the NIPALS algorithm developed by Wold et.al is
13
known to be simplest. Using this iterative approach, scores (T), loadings (P) and additional weights (W) which has the same dimensionality as loadings are calculated. The addition of weights in PLS is required to maintain the orthogonal scores. For the details about the NIPALS algorithms Wold et.al43 work could be consulted.
To validate the model fit and predictive ability of the developed calibration models following root mean square errors must be evaluated44:
Root Mean Square Error of Calibration (RMSEC) – It gives a measure of the average difference
between predicted and measured response values at the calibration stage; a model with a perfect fit will yield a RMSEC of zero.
= − − 1−
(2.5)
where, ̂ is the model-estimated Y-values whereas i is the known Y-values; A = number of
PLS factors; N is the number of samples in the test set
Root Mean Square Error of Cross Validation (RMSECV) – It gives a measure of the average
difference between predicted and measured response values of samples from the calibration subset that were placed aside; this provides more realistic estimates of the model’s prediction and optimal complexity performance of the model.
= , −
(2.6)
where, ̂ , = model-estimated Y-values without the calibration subset i.
Root Mean Square Error of Prediction (RMSEP) – It gives a measure of the average
difference between predicted and measured response values at the validation stage; it can be used to provide a reasonable assessment of the model’s prediction performance on future samples.
14
= −
(2.7)
Here, N is the number of samples in the test set.
2.3.3. Partial least squares discriminant analysis (PLS-DA)
PLS-DA is a supervised classification method developed with an objective to separate different classes of observations on the basis of their X-variables. Similar to the PLS, in this method Y-matrix encodes observations into different categories by means of dummy variables. Each class of observations in the dummy Y-matrix is denoted with ones and other classes as zeros, number of vectors in Y-matrix increases with the increase in the number of classes of observations. As presented in the example below, an X-matrix with three different classes of observations are attributed to the three variables of the Y-matrix.
The PLS model is fitted between the (N×K) matrix of X and the dummy (N×M) matrix of Y, this way a discriminant plane is found in which observations are separated according to their respective classes45. More specifically, PLS-DA finds a linear regression model by projecting
the predicted dummy variables and the observed variables into a new space46. Through the
obtained weights and loadings insights related to discrimination are achieved. PLS-DA holds well for the classification of samples based on their properties such as origin, activity and other physical characteristics36.
2.3.4. Linear discriminant analysis (LDA)
LDA, synonymously called Fischer’s LDA is an established supervised classification method for classification and discrimination of observations belonging to different classes. The main objective of LDA is to find a new dimension that best segregates different groups of the samples
15
projected onto it, maximizing the ratio between the sum of squares between and within the group46.
Formally the projection matrix (PLDA) is calculated as following
= det det (2.8)
Where, P is the eigenvector, Sb is between class variance and Sw is within class covariance.
LDA works well if all the observations are homogenous and the number of variables is much smaller than number of samples in the training set 47.
The following table (Table 2-1) summarizes the recent studies that have reported the use of chemometric methods specific to the pharmaceutical freeze-drying processes and products monitoring.
Table 2-1 Application of NIR-based Chemometric methods in freeze-drying
Application Chemometric
method
Analysis Type Year & Reference number
Design of Experiments based Near-Infrared Spectroscopy models to monitor moisture content in the freeze-dried products.
PCA, PLS Qualitative and Quantitative
2020 (48)
Demonstration of NIR based multivariate model to obtain information on liposome structure and integrity, and determination of endpoints of primary and secondary drying.
PCA Qualitative 2018 (49)
Determination of endpoint of primary drying using in-line Near-Infrared Spectroscopy and mechanistic model produced using temperature as an input during the continuous freeze-drying.
PCA Qualitative 2018 (50)
Monitoring moisture content and distribution inside the spin freeze-dried vials using Near-Infrared Chemical Imaging
PCA, PLS Qualitative Quantitative
2018 (32)
Demonstration of reliability of multi-vial Near-Infrared approach in
16 monitoring product moisture during the
freeze-drying process
Monitoring of changes induced in the multicomponent formulation, identification of solid state form of mannitol and sublimation of solvents during the drying process
PCA Qualitative 2014 (30)
Using NIR based models to distinguish formulations with varying virus pretreatments and virus volume.
PCA, PLS-DA
Qualitative 2013 (51)
Using Near-Infrared probes to monitor moisture content inside multiple vials during the freeze-drying process.
PCA, PLS Quantitative 2013 (15)
Monitoring interactions between protein and lyoprotectant, and detection of protein unfolding during the freeze-drying process.
AWA Qualitative 2012 (15)
Using DOE approach and combination of multiple PAT tools for freeze-drying process and formulation optimization: NIR for investigation of drying phase and selection of optimal process step temperatures
PCA Qualitative 2011 (52)
Study on complementary properties of Raman and NIR: NIR for monitoring drying steps and solid state characterization of mannitol
PCA Qualitative 2009 (4)
Study on complementary properties of multiple PAT tools: NIR for detection removal of hydrate water, determination of drying end point and solid-state characterization of mannitol
17
3.
RESEARCH PAPER: An investigation into the
spatial distribution of moisture in freeze-dried
products using NIR spectroscopy and chemical
imaging.
Title in French
Une étude de la distribution spatiale de l'humidité dans les produits lyophilisés par spectroscopie NIR et imagerie chimique
Authors and affiliations
Azheruddin Mohammed,(Student M.Sc.Chemical Engineering), Université de Sherbrooke, Département de génie chimique et génie biotechnologique, 2500 boul. de l’Université, Sherbrooke, Québec, Canada, J1K 2R1.
Ryan Gosselin, Ph.D., Associate Professor, Université de Sherbrooke, Département de génie chimique et génie biotechnologique, 2500 boul. de l’Université, Sherbrooke, Québec, Canada, J1K 2R1
Antoine Cournoyer, M.Sc., Manager PAT projects, Process Monitoring Automation and Control Group, Pfizer Global Supply, 17300 Trans-Canada Highway, Kirkland, Quebec H9J 2M5
Date of submission: 20th October 2020
Status: In review
Submitted to Journal: PDA Journal of Pharmaceutical Science and Technology. Contributions to the thesis: This paper allowed to determine the distribution of moisture on the surface of the freeze-dried products using near-infrared chemical imaging, and spatial variabilities in the distribution of moisture on the surface of the vials have been confirmed. Using NIR measurements from multiple spots on the surface of the vial it was confirmed that to obtain robust quantitative results measurements from multiple spots on the surface of vial must be acquired.
18
ABSTRACT
Near-infrared spectroscopy (NIRS) is a widely accepted method of measuring moisture in pharmaceutical freeze-dried products, both during the process and in the finished products. Multiple NIR measurement approaches have been introduced to monitor product moisture in freeze-dried vials. However, the spatial moisture gradients within a vial have not been investigated in depth. Like any other point-focused process analytical technology (PAT) tool, a spectrum produced by NIRS represents an average over a given area of the product vial. Implementing a point-focused NIR on any random position without proper understanding of spatial moisture variations within the vial may severely impact the reliability of the results. The present work focuses on understanding the moisture distribution within freeze-dried vials. We performed an investigation using NIR tools, NIR chemical imaging (NIR-CI), and NIRS to understand the spatial variations in moisture on the outer surface (i.e., periphery) of the freeze-dried vials. To achieve this, the moisture distribution within individual vials was mapped using NIR images. Then, NIRS was used to determine the necessity of using multiple measurement points to produce robust models quantifying moisture inside freeze-dried products. Overall, the results confirm the non-homogenous distribution of moisture, as well as the non-uniform drying front, in the products undergoing freeze-drying. The findings from the NIRS-based partial least squares (PLS) models indicate that, to achieve reliable product/process information, measurements must be drawn from multiple measurement points on the surface of the freeze-dried products.
19
RÉSUMÉ FRANÇAIS
La spectroscopie proche infrarouge (NIRS) est une méthode largement acceptée pour mesurer l'humidité dans les produits pharmaceutiques lyophilisés, à la fois pendant le procédé et dans les produits finis. Plusieurs approches de mesure NIR ont été introduites pour mesurer l'humidité du produit dans les flacons lyophilisés. Cependant, les gradients d'humidité spatiaux dans un flacon n'ont pas été étudiés. Comme tout autre outil de technologie d'analyse de procédé (PAT), un spectre produit par NIRS représente une moyenne sur une zone donnée du flacon de produit. La mise en œuvre d'un NIR ponctuel sur n'importe quelle position aléatoire sans une bonne compréhension des variations spatiales d'humidité dans le flacon peut gravement affecter la fiabilité des résultats.
Le présent travail se concentre sur la compréhension de la distribution de l'humidité dans les flacons lyophilisés. Nous avons effectué une enquête à l'aide d'outils NIR, d'imagerie chimique NIR (NIR-CI) et de NIRS pour comprendre les variations spatiales de l'humidité sur la surface externe (c'est-à-dire la périphérie) des flacons lyophilisés. Pour ce faire, la distribution de l'humidité dans les flacons individuels a été cartographiée à l'aide d'images NIR. Ensuite, le NIRS a été utilisé pour déterminer la nécessité d'utiliser plusieurs points de mesure pour produire des modèles robustes quantifiant l'humidité à l'intérieur des produits lyophilisés. Globalement, les résultats confirment la répartition non-homogène de l'humidité, ainsi que le front de séchage non-homogène, dans les produits en lyophilisation. Les résultats des modèles des moindres carrés partiels (PLS) basés sur le NIRS indiquent que, pour obtenir des informations fiables sur les produits / procédés, les mesures doivent être effectuées à partir de plusieurs positions sur la surface des produits lyophilisés.
20
3.1 INTRODUCTION
Freeze-drying, or lyophilization, is a low-temperature dehydration process that involves freezing a product, placing it in a relative vacuum, and then removing the resulting ice by sublimation53. It is often used in the pharmaceutical industry to dry thermally sensitive products,
such as biopharmaceutical formulations54. During the freeze-drying process, liquid
formulations are subjected to controlled multistep transformations, making use of the principles of heat and mass transfer. This is done to achieve a uniform, amorphous dry cake, which often renders the process complicated and time-consuming, resulting in high operating costs55,2. It is
therefore crucial to monitor the product during the process to ensure that the desired critical quality attributes (CQAs) of the product are achieved56.
In general, CQAs are related to the physical, chemical, biological, or microbiological properties of the drug product that define the final product quality57. The most common CQAs associated
with freeze-dried products are potency and purity, reconstitution time, aesthetic appearance and residual moisture concentration (RMC) in the finished drug product58. Among these, RMC
within the product has been the topic of much work, both in the products undergoing drying and also in the finished freeze-dried products. Various studies indicate that RMC influences the other quality attributes in the finished products9,10,11,12. Considering the importance of RMC in
freeze-dried products, several process analytical technology (PAT) tools have been developed to directly or indirectly monitor product moisture during the freeze-drying process.
Monitoring RMC is done on two levels: the individual vials (vial-focused monitoring) or the overall freeze-drying unit (batch monitoring). A review of both types of applications can be found elsewhere59. In contrast to vial-focused monitoring tools, batch monitoring tools have so
far been preferred, as they comply with good manufacturing practices (GMP) requirements and provide information on the complete batch of vials19. Among the different batch monitoring
tools, tunable diode laser absorption spectroscopy (TDLAS) shows promising results for the quantitative moisture characterization of a batch of vials10,60,61,62. However, research has shown
that vials exhibit variable temporal drying profiles based on their spatial position inside the freeze-drying chamber, as there is variability in the pressure and temperature effects inside the freeze dryer5,6,7,8. Although TDLAS promises to obtain information related to the overall
21
batch monitoring tools, point-focused tools such as near-infrared spectroscopy (NIRS) have successfully been demonstrated to monitor the moisture of specific vials during freeze-drying13,4. In these works, the NIRS probe was implemented only on a single vial among the
whole batch, and cannot account for variations between vials undergoing drying. Going a step further, Kauppinen et al.7,15 introduced an in-line multi-vial NIRS approach to study the
variability in product moisture in several vials located in different positions throughout the freeze dryer shelf. Such an approach occupies a middle ground between single-vial and whole-batch monitoring and enables increased understanding of product variability specific to the spatial locations inside the freeze dryer over the entire lyophilization run.
Considering the potential of IR imaging to monitor spatial variations in the physical and chemical properties of the sample, several tools have been developed and implemented as PATs. IR thermal imaging has been used to monitor temperature gradients on the surface of individual vials as well as on the bulk product spread over the entire tray of a freeze-drying unit63. In both cases, spatial temperature variations were observed between the vials and within
the bulk product. This further strengthens the rationale behind using the multi-vial NIR approach for monitoring moisture during the freeze-drying process, as the temperature is closely related to the residual moisture inside the vial. In another work, thermal imaging was used to show variability in the axial and radial temperature profiles of the vial throughout the drying process64. With the recent use of NIR chemical imaging (NIR-CI) in continuous
freeze-drying, the presence of an axial moisture gradient within the vials was observed as the product was deposited on the vial wall as a film32.
The present study aims at investigating spatial moisture variations in freeze-dried vials and at determining the suitability of acquiring measurements on a single measurement spot using point-focused probes. This is because the product presentation in freeze-dried vials is significantly different from that in spin-dried vials, resulting in markedly different drying profiles. Here, we used NIR-CI and NIRS to accomplish these objectives. These techniques are complementary, as NIR-CI provides spatial information related to moisture on the surface of the product, whereas spectroscopy enables penetration into the surface layers of the product. The use of NIRS in combination with a partial least squares (PLS) regression is an established approach for quantifying moisture in freeze-dried products15,32. Images acquired using NIR-CI
22
were used to examine the spatial variability in the distribution of moisture on the surface of the product. NIRS data through quantitative moisture prediction was used to confirm the spatial moisture variabilities in the freeze-dried products. The images and spectra were acquired on the surface of the sample on six different sides (every 60° angle) by rotating the vial on a rotation stage. This allows inspection of the spatial variability in moisture around the whole circumference of the vial. Here, we show the spatial variability of moisture within the vials during the shelf freeze-drying process. Furthermore, we determine the robustness of single-point NIR measurement while the product is undergoing batch freeze-drying. In the end, this work seeks to provide tools, and methods, to better understand spatial variations within freeze-dried products.
3.2 MATERIALS AND METHODS
3.2.1 Materials
Glycine (≥98.5%), a common pharmaceutical excipient, was purchased from Fischer Scientific Canada and was used without further treatment prior to the experiments. Deionized water was used as a solvent to prepare 15% (w/v) glycine solution. The solution was filled in 50-ml capacity glass bottles (DWK Life Sciences, Millville, NJ, USA), where 120 samples were prepared by pouring 20 ml glycine solution into the glass vials, resulting in a 1-inch product fill height in liquid form.
3.2.2 Freeze-drying and sample collection procedure
Prior to drying, the samples were first frozen in lab freezer (16.6 ft3 upright freezer, Frigidaire,
Charlotte, NC, USA) at -18°C for 4 hours, then transferred to a -86°C freezer (MDF-U700VXC-PA, Panasonic, Kadoma, Osaka, Japan) and frozen for another 4 hours. A stepwise freezing procedure was carried out to avoid vial breakage due to thermal shock and to allow complete crystallization of the product formulation65.
Drying was performed using a ModulyoD laboratory-scale freeze dryer (Thermo Electron Corporation, Waltham, MA, USA). A total of 120 vials were used for the experiments. The samples were collected at different time points to achieve samples with moisture in the range of 85% to <1% (w/w). To produce samples with differing moisture levels while minimizing interruptions to the process, the vials were collected at 4-hour intervals to achieve samples with
23
a moisture spacing of ≈5% between the 85% and 20% (w/w) moisture range. In the latter stages of drying, the samples were collected more frequently, reducing the time to 2-hour intervals to achieve moisture spacing of ≈2% (w/w).
Two vials were damaged during the drying process, and the remaining 118 vials were used in this study. The moisture content from the collected samples was determined using gravimetry, where the difference in the initial and final product weight was calculated66,67. All collected
samples were stored in an -18°C freezer for further analysis.
3.3.3 NIR-CI
A NIR greyscale InGaAs area scan camera (Bobcat 320, Xenics Infrared Solutions, Leuven, Belgium) with a 25-mm infrared lens (Navitar, Rochester, NY, USA) was used as an imaging tool. The resolution of the camera was 320 × 256 pixels, and the operating wavelength range was 900–1700 nm. The shortwave IR (SWIR) camera was not equipped with a spectroscope, but a 1460 ± 11 nm selective wavelength bandpass filter (Spectrogon Inc., Mountain Lakes, NJ, USA) was mounted in front of the camera lens. This was done to selectively capture the images in the water combination overtone band region (1450–1500 nm) exhibited by water in near freezing and ice states31. These overtone bands are a result of stretching vibrations in the water
molecule. The output from the NIR camera was a 2D greyscale image with varying pixel intensities relative to the moisture content on the surface of the vial. Thus, the image pixels representing moisture would have lower pixel intensities and appear darker than the pixels representing the dry product inside the vial. The sample presentation to the camera was controlled by optimizing parameters such as lighting, relative distances, and angles between the camera and the vial, as well as the acquisition parameters. To ensure image-to-image comparability, all parameters were kept constant throughout the measurements.
3.3.3 NIR Spectroscopy
A diffuse reflectance NIR spectrometer (MicroNIR 1700, Viavi Solutions, Inc., Milpitas, CA, USA) covering the wavelength range of 900–1700 nm was used. Each spectrum acquired by the probe consisted of an average of 128 spectra obtained with an integration time of 12 ms. Before acquiring the spectra, the NIR spectrometer was calibrated for 0% and 100% reflectance. For 0% reflectance (D), a spectrum was acquired in the absence of IR light; for 100%
24
reflectance (B), the NIR spectrum was recorded by shining the light on a white reflectance standard. Every raw spectrum (R) acquired from the sample during the measurements was internally corrected using the 0% and 100% reflectance spectra according to the following equation:
= −− (3.1)
Where, C is the corrected spectra.
3.3.4 Procedure to acquire images and spectra on the surface of the product
vial
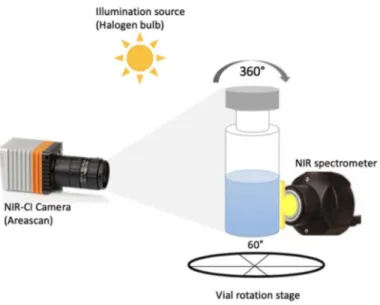
To better understand spatial variability, NIR-CI and NIRS acquisitions were carried out at different positions on the vials. Measurements were carried out at 60° intervals around the cylindrical vials (Figure 3-1). Using both the NIRS and NIR-CI systems separately, spectra and images were acquired at different positions of the vial by rotating them on a fixed stage. Whereas the NIRS probe was positioned in direct contact with the vial, as the probe head size was equivalent to the product height inside the vial, the NIR-CI camera was located approximately 40 cm away to acquire a full picture of the vial. For illumination with the NIR camera, a 75-W halogen bulb was used. At each position on the vial, three replicate measurements were acquired and averaged prior to the analysis.
Figure 3-1. Schematic representation of the vial showing the six angular positions and the field of view with the NIRS and NIR-CI tools.
25
3.3.5 Treatment of the NIR-CI images
To correct for minor variations in the lighting conditions, the raw images were standardized based on the intensity of the image background with the following equation:
= 100 (eq2),
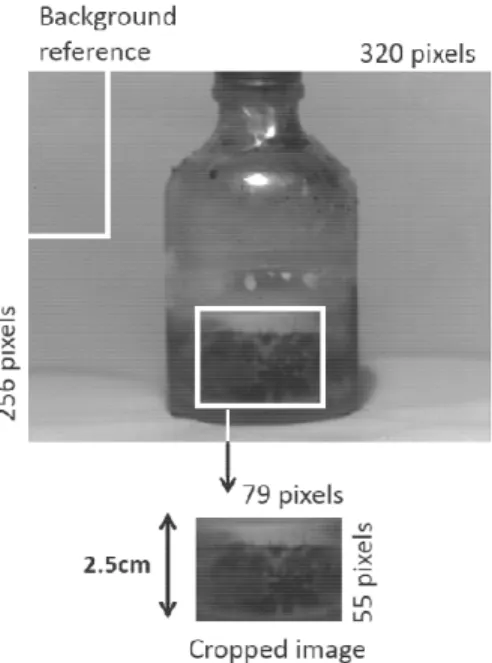
Where, is the corrected image, X is a raw image, and b is the mean pixel intensity of the given portion (100 × 50) of the image background in the top corner (Figure 3-2).
Figure 3-2. Typical vial illustrating a typical cake as well as the background reference area used for standardizing the images.
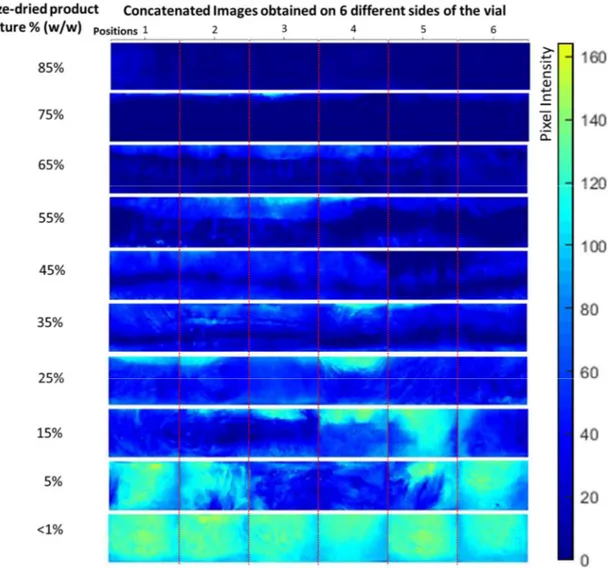
After standardizing the images, the portion of the image representing the cake was cropped and used for the analysis. This area is based on the fill height (approximately 1 inch) and limited to a 60° window of the vial (Figure 3-2). Each cropped image consists of 55 × 79 pixels. As mentioned, NIR spectra and images were acquired at six positions (at 60° intervals) to capture the overall moisture of the vials. These six images could be averaged into a single image representing the drying front of a cylindrical vial (Figure 3-3). Otherwise, the six images could be concatenated into a larger (55 × 474) pixel image representing the full periphery of the vial (Figure 3-3). The NIR images were colored using a gradient coloring scheme, where the color bar increases with the dryness of the product; dark blue represents wet products whereas pale blue and yellow represent the dry product.
26
Figure 3-3. Representation of the averaged and concatenated images using a typical freeze-dried sample (a single vial). The horizontal dimension of the image represents the diameter of the vial; the vertical dimension represents the product height inside the vial.
3.3.6 Representation of the NIR spectra
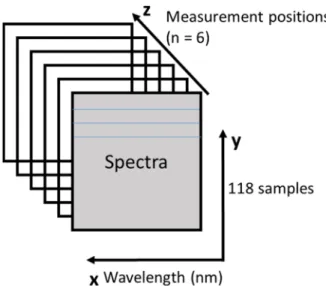
Spectra were obtained at six different angles on the surface of the samples; the combined dataset can be represented as a 3D matrix (Figure 3-4), where the x-axis represents the wavelength (nm), and the y- and z-axis represent sample spectra respective to the position/angle on the product vial.
Figure 3-4. NIR spectra acquired on the vial surface at six different measurement angles represented in a 3D matrix.
27
3.4 RESULTS AND DISCUSSION
3.4.1 Qualitative analysis of the NIR images
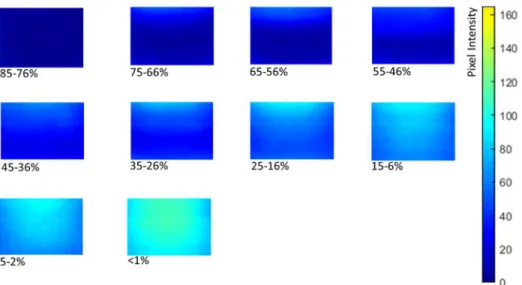
Figure 3-5 represents average images of 10 categories of freeze-dried samples containing moisture in the range of 85% to <1% (w/w). These were obtained by averaging the images of the vials in each moisture category. As the products dried, a decrease in pixel intensity could be observed (from dark blue to pale blue), and the lighter pixels gradually moved from the top to the bottom of the product. The symmetric color gradients observed on the sides of the images may be linked to the curvature of the vials. This observation is in line with the mathematical models of top–down drying in vial freeze-drying68,69. In Figure 3-6, the histogram shows a
linear relationship between product moisture, gravimetric measurement, and the average pixel intensity of the NIR-CI images, a surface measurement. This relation serves to strengthen the hypothesis that, on average, non-invasive measurement of the product at the vial periphery can be representative of the bulk of the powder within the vial. However, as illustrated in Figure 3, the moisture gradients imply that no single position at the periphery of a given vial can be a reliable indicator of the overall moisture content of that vial.
Figure 3-5. Average images of freeze-dried samples containing moisture in the range of 85% to <1% (w/w). Averages represent all 118 samples divided into 10 different categories.