HAL Id: hal-00297835
https://hal.archives-ouvertes.fr/hal-00297835
Submitted on 24 Jul 2006HAL is a multi-disciplinary open access
archive for the deposit and dissemination of sci-entific research documents, whether they are pub-lished or not. The documents may come from teaching and research institutions in France or abroad, or from public or private research centers.
L’archive ouverte pluridisciplinaire HAL, est destinée au dépôt et à la diffusion de documents scientifiques de niveau recherche, publiés ou non, émanant des établissements d’enseignement et de recherche français ou étrangers, des laboratoires publics ou privés.
Nitrogen assimilation and short term retention in a
nutrient-rich tidal freshwater marsh ? a whole ecosystem
15N enrichment study
B. Gribsholt, E. Struyf, A. Tramper, L. de Brabandere, N. Brion
To cite this version:
B. Gribsholt, E. Struyf, A. Tramper, L. de Brabandere, N. Brion. Nitrogen assimilation and short term retention in a nutrient-rich tidal freshwater marsh ? a whole ecosystem 15N enrichment study. Biogeosciences Discussions, European Geosciences Union, 2006, 3 (4), pp.1081-1119. �hal-00297835�
BGD
3, 1081–1119, 2006 Nitrogen retention in a tidal freshwater marsh B. Gribsholt et al. Title Page Abstract Introduction Conclusions References Tables Figures J I J I Back CloseFull Screen / Esc
Printer-friendly Version Interactive Discussion
EGU Biogeosciences Discuss., 3, 1081–1119, 2006
www.biogeosciences-discuss.net/3/1081/2006/ © Author(s) 2006. This work is licensed
under a Creative Commons License.
Biogeosciences Discussions
Biogeosciences Discussions is the access reviewed discussion forum of Biogeosciences
Nitrogen assimilation and short term
retention in a nutrient-rich tidal
freshwater marsh – a whole ecosystem
15
N enrichment study
B. Gribsholt1, E. Struyf2, A. Tramper1, L. De Brabandere3,*, N. Brion3,
S. van Damme2, P. Meire2, F. Dehairs3, J. J. Middelburg1, and H. T. S. Boschker1
1
Netherlands Institute of Ecology, Center for Estuarine and Marine Ecology, P.O. Box 140, 4400AC Yerseke, The Netherlands
2
University of Antwerp, Department of Biology, Environmental Management Research Group, Universiteitsplein 1C, 2610 Wilrijk, Belgium
3
Vrije Universiteit Brussel, Department of Analytical and Environmental Chemistry, Pleinlaan 2, 1050 Brussel, Belgium
*
now at: University of Florida, Department of Fisheries and Aquatic Sciences, 7922 NW 71st Street, Gainesville FL 32653, USA
Received: 18 May 2006 – Accepted: 6 June 2006 – Published: 24 July 2006 Correspondence to: B. Gribsholt (b.gribsholt@nioo.knaw.nl)
BGD
3, 1081–1119, 2006 Nitrogen retention in a tidal freshwater marsh B. Gribsholt et al. Title Page Abstract Introduction Conclusions References Tables Figures J I J I Back CloseFull Screen / Esc
Printer-friendly Version Interactive Discussion
EGU
Abstract
We conducted two (May 2002 and September 2003) pulse additions of15NH+4 to the flood water inundating a tidal freshwater marsh fringing the nutrient-rich Scheldt River (Belgium) and traced the fate of ammonium in the intact ecosystem. Here we report in detail the15N uptake into the various marsh components (leaves, roots, sediment, leaf
5
litter and invertebrate fauna), and the15N retention on a scale of 15 days. We particu-larly focus on the contributions of the rooted macrophytes and the microbial community in the sediment and on plant litter. Assimilation and short term retention of15NH+4 was low on both occasions. Only 4–9% of the added15N trace was assimilated, correspond-ing to 13–22% and 8–18% of the processed15N (i.e. not exported as 15NH+4) in May
10
and September, respectively. In May nitrogen assimilation rate (per hour inundated) was >3 times faster than in September. Macrophytes (above- and below ground) were of limited importance for short term15N retention accounting for <6% of the total15NH+4 processed by the marsh. The less dominant herbaceous species were more important (on an area basis) than the dominant reed (Phragmites australis). The microbial
com-15
munity colonizing the sediment and litter surfaces were responsible for most nitrogen assimilation and short-term retention in the marsh. The large reactive surface area available for microbial colonization together with direct plant uptake, are the crucial components for nitrogen assimilation, retention and transformation in nutrient-rich tidal freshwater marshes.
20
1 Introduction
Tidal freshwater marshes are periodically inundated wetlands fringing rivers. These distinct features of inner estuaries often occur where estuaries are most enriched in particles and nutrients. High nutrient concentrations and regular tidal inundation re-sults in highly productive macrophyte and algal communities, with potential to play an
25
at-BGD
3, 1081–1119, 2006 Nitrogen retention in a tidal freshwater marsh B. Gribsholt et al. Title Page Abstract Introduction Conclusions References Tables Figures J I J I Back CloseFull Screen / Esc
Printer-friendly Version Interactive Discussion
EGU tenuate river borne nitrogen load to adjacent coastal waters. The dynamics of nitrogen
cycling in tidal freshwater marshes is not well known and most of what is known about nitrogen dynamics in tidal freshwater marshes comes from plant tissue analysis, tidal input/output balance studies, and analogy to more intensively studied salt marshes (Odum, 1988; Bowden, 1986, Bowden et al., 1991; Merrill and Cornwell, 2000;
Verho-5
even et al., 2001; Hansson et al., 2005).
Net marsh nitrogen retention, i.e. less nitrogen is leaving the marsh system than entering, is governed by the balance of loss processes (gaseous emissions of nitrous oxide and dinitrogen, and tidal export) and processes which import and retain nitrogen within the system (nitrogen fixation, precipitation, tidal imports, plant uptake, recycling,
10
and accretion) (White and Howes, 1994b; Mitch and Gosselink, 2000). While particu-late deposition (sedimentation), plant nitrogen uptake and denitrification are generally reported to be the most important sinks for watershed derived nitrogen in (tidal freshwa-ter) wetlands (Bowden, 1986; Hansson et al., 2005), methodological restrictions have limited our understanding of interactions between the various marsh compartments
15
and of the functioning of these ecosystems as a whole.
The Scheldt estuary (Belgium – the Netherlands) is a macrotidal, heterotrophic, low-oxygen, nutrient-rich system (Soetaert et al., 2005). Although many tidal marshes of the Scheldt basin have been reduced to very small size today (mainly by embankment and polder reclamation), this is one of the few European basins where fringing, tidal
20
freshwater marshes are still a prominent feature. Yet the importance of these marshes as a nutrient sink remains largely unassessed. We conducted two temporally sepa-rated (May 2002 and September 2003) pulse additions of15N-ammonium to the tidal marsh flood water, and traced the (short term) fate of riverine ammonium in a freshwa-ter marsh fringing the Scheldt River. Using this relatively new technique of deliberate
25
additions of trace amounts of heavy nitrogen (15N) to aquatic systems allowed us to simultaneously study the dynamics, uptake and transformation of watershed derived ammonium by the marsh biota in an intact marsh ecosystem.
season-BGD
3, 1081–1119, 2006 Nitrogen retention in a tidal freshwater marsh B. Gribsholt et al. Title Page Abstract Introduction Conclusions References Tables Figures J I J I Back CloseFull Screen / Esc
Printer-friendly Version Interactive Discussion
EGU ally variable factors, such as nutrient loading, developmental stage of macrophytes and
associated microbes, and temperature. To maximize contrasts we therefore scheduled our two experiments in spring (May), when plants were young and building up biomass, and late summer (September), when macrophytes were in a flowering or early senes-cent state, respectively. The detailed results of the water-phase component of these
5
studies have been described previously (Gribsholt et al., 2005, 2006). In both May and September, nitrification accounted for the largest fraction of ammonium transformation (30 and 17% in May and September, respectively), and the large reactive surface area of the marsh played a crucial role in nitrogen transformation. A significant part of the added 15N-NH+4 was assimilated and stored within the marsh. Collectively, the di
ffer-10
ent marsh compartments (sediment, root, leaves and litter) accounted for 8–22% of the15N-transformations (Gribsholt et al., 2005; 2006). In this paper we report in detail the15N uptake into these different marsh compartments and subsequent 15N reten-tion on a time scale of days, with particular focus on the relative importance of rooted macrophytes and the microbial community. Our results show that short term (days)
15
nitrogen retention in these nutrient rich marshes occurs mainly via microbial pathways associated with the litter and sediment.
2 Methods
2.1 Study area
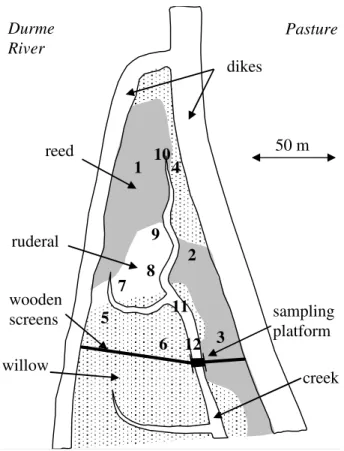
The study site is located in the northern end of the Tielrode tidal freshwater marsh
20
(51◦0600N, 4◦1000E) fringing the Scheldt and the Durme rivers, Belgium. This triangular shaped area of 3477 m2 is bordered on two sides by dikes, while the remaining side was closed off by 1m wooden boards during the experiments (Fig. 1). Boards were dug 10–20 cm into the sediment, allowing water flow only through a 4.5 m wide open span across the tidal creek. A 4.5 m long sampling and labelling bridge was placed across
25
BGD
3, 1081–1119, 2006 Nitrogen retention in a tidal freshwater marsh B. Gribsholt et al. Title Page Abstract Introduction Conclusions References Tables Figures J I J I Back CloseFull Screen / Esc
Printer-friendly Version Interactive Discussion
EGU region, with the common reed Phragmites australis dominating the lower elevations
and willows (2–6 m high specimens of Salix sp). and patches of ruderal vegetation (dominated by Policeman’s helmet Impatiens glandulifera, Hairy Willow-herb Epilobium
hirsutum and Stinging Nettle Urtica dioica) at the higher elevations (Fig. 1). Although
the vegetation cover is very dense with reed and Policeman’s helmet growing to heights
5
of up to 4 m, benthic microalgal mats (dominated by filamentous yellow-green algae
Vaucheria sp.) were a conspicuous feature on the sediment surface, particularly in
the creek bank and willow sites during early summer. Twelve sampling stations were placed within the study site (Fig. 1), three within each vegetation types (reed, willow and ruderal) and three in the unvegetated creek banks (four habitat types in total).
10
Stations were chosen to represent different distances from the labelling platform as well as differences in elevation within each of the four habitats (Table 1). All stations were made accessible by walking boards, keeping disturbance of the marsh during sampling to a minimum.
2.2 Isotopic labelling
15
The marsh was labelled with 15NH+4 on two separate occasions, 25 May 2002 and 11 September 2003, by adding the label to the flood water in the tidal creek as it entered the study area. The15N addition was deliberately scheduled in early (May) and late (September) summer, respectively, to represent seasonal variation in macrophyte growth and associated variation in microbial activity.
20
In May 1.97 mol15N-NH+4 was added while 1.41 mol15N-NH+4 was added in Septem-ber. This increased the15N content of the ammonium pool from 0.37% to 1.3% and 4.5% and increased the average total NH+4 concentration by 14 and 73% in May and September, respectively. The higher degree of labelling in September compared to May was due to a combination of significantly lower ammonium concentrations in the flood
25
water (Fig. 2a) and lower tidal height (see Discussion; Gribsholt et al., 2006). Thus only half the volume of water flooded the marsh during September labelling compared to May (Table 2). The label solution consisted of 1 kg 10%15N labelled (15NH4)2SO4
BGD
3, 1081–1119, 2006 Nitrogen retention in a tidal freshwater marsh B. Gribsholt et al. Title Page Abstract Introduction Conclusions References Tables Figures J I J I Back CloseFull Screen / Esc
Printer-friendly Version Interactive Discussion
EGU and 50 kg NaBr (conservative tracer) dissolved in 250 L of water. In May nearly all
la-bel solution was added, while only 180 L was added in September. 15N release was initiated when the first flood water arrived at the labelling platform and ended at the turn of the tide, and the label solution was released proportional to the volume of water entering the marsh as described in detail in Gribsholt et al. (2005). This ensured an
5
even distribution of15NH+4 over the entire study area, as was confirmed by evaluation of the conservative tracer (Br−) distribution.
2.3 Marsh sampling and analysis 2.3.1 15N and total nitrogen
Marsh stations were sampled before labelling (T−2) to establish natural abundance
lev-10
els of 15N and just after labelling (T0). In May samples were also collected after two subsequent tides (T5and T31), while T1, T2, T4 and T29 were sampled in September. The subscript denotes the tide relative to tracer addition. As there were two tides per day, this means that label retention was followed for about 15 days. At all stations sam-ples of sediment, above ground vegetation (live macrophyte stems and leaves, onwards
15
collectively referred to as leaves), below ground vegetation (roots), dead macrophyte material on the sediment surface (litter), invertebrate macrofauna (benthic infauna and epifauna) and suspended matter settling on the sediment surface (sedimentation traps) were collected for analysis of total nitrogen and15N content.
The surface layer (0–0.5 cm, including benthic algae) of three sediment cores
(inter-20
nal diameter 6 cm) were pooled while one additional core was sectioned into 0.5–2.5, 2.5–5 and 5–10 cm depth intervals. In May, a sub-sample (∼4 g) of the surface sedi-ment was immediately transferred to 10 ml 2 M KCl and extracted the next day (shaken 1 h). Following centrifugation the supernatant was removed and the sediment was rinsed in milliQ water and subsequently centrifuged three times before the remaining
25
sediment pellet was frozen. Sediment samples (untreated and KCl extracted) were frozen and then freeze dried. Sorbed nitrogen was inferred from Ntot=Nsob+Norg;
as-BGD
3, 1081–1119, 2006 Nitrogen retention in a tidal freshwater marsh B. Gribsholt et al. Title Page Abstract Introduction Conclusions References Tables Figures J I J I Back CloseFull Screen / Esc
Printer-friendly Version Interactive Discussion
EGU suming Norg equals nitrogen remaining after KCl extraction, where Ntot is total nitrogen
determined in untreated samples, Nsob and Norg are sorbed and organic nitrogen (as-suming that all immobilization is due to microbial incorporation), respectively.
Suspended particulate matter settling on the sediment surface was trapped on 60 mm diameter GF/A filters placed on the sediment surface. Each filter was placed
5
on top of a 100 mm diameter filter paper (to keep undersides clean) and held down by three wire clips. New filter traps were placed at each station before each tide and collected immediately at low tide. Filters were dried at 60◦C for 24 h.
Leaves and roots were sampled by gently pulling three specimens (per station) out of the sediment. Triplicates were pooled after separating leaves and roots. Reed top
10
shoots were collected separately (St. 1–3; May only), while the two most dominant species were sampled separately from ruderal stations (St. 7–9). In addition to ran-domly handpicking willow leaves, the dominant scrub (Policeman’s helmet) covering the sediment floor below willows was collected (St. 4–6) when applicable. In May, sam-ples of the small macrophyte watercress (Rorippa sp.) which covered the otherwise
15
unvegetated creek banks were also collected. Watercress was not present in Septem-ber. All samples were dried to constant weight (70◦C) before further handling.
Litter was collected randomly from the sediment surface of all stations except creek banks St. 11 and 12 in May. The litter composition reflected local vegetation consisting of reed leaves and stems (St. 1–3), willow leaves (St. 4–6), and herbs (St. 7–10), and
20
no distinction was made between old and new litter. In May additional sub-samples of all litter fragments incubated in nylon litterbags (mesh size 300 µm, filled with local litter at T−2) were collected at stations 2, 4 and 7 at T−2, T0and T5.
For macro-invertebrate infauna, 3 sediment cores (0–5 cm depth, internal diameter 6 cm) were collected from 4 representative stations (St. 2, 5, 8 and 11) in September
25
only. Triplicates were pooled and immediately preserved in formalin (4%) with Rose Bengal. After sieving (1 mm mesh) invertebrates were identified under a dissecting microscope to the taxonomic class or order and quantified. Samples were rinsed in water and freeze dried for subsequent isotopic signature analysis of pooled material
BGD
3, 1081–1119, 2006 Nitrogen retention in a tidal freshwater marsh B. Gribsholt et al. Title Page Abstract Introduction Conclusions References Tables Figures J I J I Back CloseFull Screen / Esc
Printer-friendly Version Interactive Discussion
EGU from each group. Similarly, invertebrates handpicked from the sediment surface and
vegetation covering an area of several m2at each station were identified to taxonomic class or order and analyzed separately for15N. Abundances were not quantified.
All samples described above were analyzed for isotopic composition and total ni-trogen. Sub-samples of (freeze) dried leaves, roots, and sediment were grinded to a
5
fine powder before total nitrogen analysis on a Carlo Erba Elemental Analyzer EA fol-lowing Nieuwenhuize et al. (1994), and15N analysis on a Fisons elemental analyzer (EA-1500) coupled on line, via a Finnigan CONFLO II interface, with a Finnigan Delta S isotope ratio mass-spectrometer (EA-IRMS). Sub-samples of invertebrate infauna were analyzed without further treatment. Ground litter and handpicked invertebrate samples
10
were analysed on a Thermo Finnigan DeltaPLUSXL mass spectrometer connected on line to an elemental analyzer (EA, Flash series 1112) via a continuous flow interface (Finnigan Conflo III).
2.3.2 Biomass estimates and sediment characteristics
Standing biomass was determined by harvesting all plant material in three 30×30 cm
15
plots at each station. In September leaf material was separated into live and dead, counted and dried separately, while no distinction was made in May. Although a strik-ing feature of the marsh, willow biomass was neglected due to methodological restric-tions. Litter biomass was determined by collecting all material lying on the sediment surface in triplicate 30×30 cm plots. No distinction was made between old and new
20
litter. Dry weight was determined by drying at 70◦C till constant weight. Root biomass was not quantified in this study; instead values from similar habitat types just outside the study area determined in May and September 2002 were used for budget calcula-tions (Gribsholt, unpubl.). Sediment density was obtained from wet weight of a known sediment volume. Porosity was calculated from water loss of a known sediment
vol-25
ume after freeze drying. Molar C:N ratio was determined according to Nieuwenhuize et al. (1994). Separate surface sediment (0–0.5 cm depth) samples were collected for pigment analysis. Samples were freeze dried and stored at −80◦C before
analy-BGD
3, 1081–1119, 2006 Nitrogen retention in a tidal freshwater marsh B. Gribsholt et al. Title Page Abstract Introduction Conclusions References Tables Figures J I J I Back CloseFull Screen / Esc
Printer-friendly Version Interactive Discussion
EGU sis. In May total Chl a was extracted and determined spectrophotometrically following
Jeffrey and Humphrey (1975), while pigments were extracted and analyzed by high performance liquid chromatography (Rijstenbil, 2003) in September.
2.4 Discharge characteristics and creek water sampling
Advective water fluxes in and out of the study area were determined for all the tides
5
except Sept T29(Gribsholt et al. 2005, 2006). Creek water nitrogen concentrations and
15
N in dissolved (NH+4, NO−3+NO−2, N2O and N2) and suspended (SPN) inorganic ni-trogen pools, as well as Br− (conservative tracer) were determined 12 times over each main tidal cycle and three times during seepage (Gribsholt et al., 2005, 2006), and wa-ter column stock size for all components subsequently calculated from concentration
10
and discharge measurements (mass balance budget). Dissolved oxygen, specific con-ductivity, temperature, pH and turbidity were recorded continuously (2 min intervals) using a Hydrolab Datasonde 3. Detailed descriptions of the water phase sampling, analysis and results can be found in Gribsholt et al. (May 2005; September 2006). 2.5 Calculations
15
For nitrogen standing stock calculations, measurements of total nitrogen content (%N) of the various compartments as well as bulk sediment density were grouped by station (n=4–6) within each year. Repeated-measures analysis of variance (ANOVA) was used to determine any effects of tide, sampling station and season.
Nitrogen isotopic ratios were measured as delta values (δ15N, ‰) relative to
atmo-20
spheric nitrogen and given as∆δ15N (isotopic enrichment), which were corrected for natural abundance levels of15N by subtracting the δ15N value of similar samples col-lected at T(−2). For stations where more macrophyte species were sampled (St. 7–9) a weighted mean enrichment (according to the relative species abundance) was used for calculations. Furthermore, the label content (excess15N) in each pool was determined
25
BGD
3, 1081–1119, 2006 Nitrogen retention in a tidal freshwater marsh B. Gribsholt et al. Title Page Abstract Introduction Conclusions References Tables Figures J I J I Back CloseFull Screen / Esc
Printer-friendly Version Interactive Discussion
EGU constructed for each tide. Surface sediment nitrogen and excess15N concentrations,
respectively, were converted to pool size (g m−2; 0–0.5 cm depth) using corresponding bulk sediment density. Plant tissue (leaves, roots, litter) concentrations were converted to pool size (g m−2) using corresponding biomass estimates. Each compartment ni-trogen standing stock and15N content at the different tides was weighted by factors
5
proportional to the area represented by each station and habitat class using a GIS based digital terrain model (Gribsholt et al., 2005) to derive the average marsh value for each component (Table 1).
Retention and export of 15N were calculated by mass balance of 15N added. In addition, for each sampling station compartment-specific (leaves, roots, litter, and
sed-10
iment), 15N-ammonium uptake rates (µmol15N m−2h−1i ) during T0 flooding were cal-culated by dividing the amount of15N recovered (µmol15N m−2) by the inundation du-ration (hi) at each station (determined from GIS based digital terrain model). Habitat specific (reed, willow, ruderal, and creek bank) and whole ecosystem15N uptake rates into each component were calculated as weighted mean according to the area
repre-15
sented by each sampling station (Table 1, determined as described above). Finally, to allow appropriate comparison of both spatial and temporal uptake rates (T0) between the May and September experiments, habitat and whole ecosystem total nitrogen up-take rates (µmol N m−2h−1i ) were determined by dividing the 15N uptake rate by the average percentage of15N labelling of the floodwater ammonium pool.
20
3 Results
The appearance of the study area was very different between the two campaigns. In May the reed (St. 1–3) was approximately 2 m high while the ruderal vegetation (St.7-9) reached heights of approximately 1m. There was no (St. 4–5) or limited (St. 6) herbaceous vegetation present under willows (Table 1). Generally the vegetation
ap-25
es-BGD
3, 1081–1119, 2006 Nitrogen retention in a tidal freshwater marsh B. Gribsholt et al. Title Page Abstract Introduction Conclusions References Tables Figures J I J I Back CloseFull Screen / Esc
Printer-friendly Version Interactive Discussion
EGU pecially on creek bank and willow sites, and creek banks were covered by watercress.
Sediment Chl a content was high ranging from 263–1022 mg m−2. In September, the herbaceous vegetation was considerably taller than in May, reaching up to 3–4 m and both reed and the ruderal key species (Policeman’s helmet, Hairy Willow-herb and Stinging Nettle) were flowering. The reed appeared more light in colour compared to
5
May. Some ruderal vegetation (Policeman’s helmet) reaching up to 2 m was present at the willow sites (Table 1). No vegetation covered the creek banks, and the sediment surface appeared bare. Thick algal mats observed in May were generally absent in September, and sediment Chl a concentrations were considerably lower ranging from 17–169 mg m−2.
10
3.1 Hydrodynamics and label distribution (waterphase components)
Details of the similarities and differences in the water-phase component of the system between the two campaigns have been discussed previously (Gribsholt et al., 2006). Thus, only the main differences and similarities between the two campaigns will be highlighted here as they add to the understanding of the labelling experiments and
15
the functioning of the system. On both occasions the timing of the label addition was carefully selected based on the predicted tidal heights, and while there was very little difference in predicted and observed heights in May, the September tides were much lower than predicted. Thus the maximum water height in the creek and the total vol-ume entering the study site were generally much reduced in September compared to
20
May (Table 2). Consequently the inundation durations were shorter, and a significantly smaller reactive litter and plant surface area was inundated in September, potentially limiting periphyton mediated N processing compared to May (Gribsholt et al., 2006). Especially critical is the relatively low September-T0 tide (label addition) where only half as much water flooded the study area as in May-T0. While no part of the 3477 m2
25
study marsh surface escaped labelling in May, the most elevated marsh area (St. 6) was not exposed to labelled flood water in September.
BGD
3, 1081–1119, 2006 Nitrogen retention in a tidal freshwater marsh B. Gribsholt et al. Title Page Abstract Introduction Conclusions References Tables Figures J I J I Back CloseFull Screen / Esc
Printer-friendly Version Interactive Discussion
EGU much higher in May than in September. The combination of lower tidal volume and
low ammonium concentrations resulted in a higher degree of labelling (4.5%) of the ammonium pool in September compared to May (1.5%). Similarly, the label addition increased the total T0NH+4 pool 73% in September, compared to 14% in May. The flood water was hypoxic (<50 µmol L-1) during most of the main tide (Fig. 2d). O2saturation
5
was inversely correlated with [NH+4], which showed a bell shaped distribution pattern over the tidal cycle and matched the main river only at maximum tidal height (Gribsholt et al., 2005, 2006).
3.2 Marsh N standing stock
Surface sediment (0–0.5 cm) and especially macrophyte biomass were the major
ni-10
trogen pools in the marsh, with the above and belowground plant biomass contributing about equally (Table 3). Surface sediment (0–0.5 cm) nitrogen content ranged from 0.32 to 1.06 wt%, with highest values observed at St. 4 and St. 10 in May. There was no significant difference in average sediment nitrogen content between May (0.64±0.16%) and September (0.61±0.14%), and surface sediment pool size (0–0.5 cm) was similar
15
between habitats as well as between seasons (Table 3). Average sediment nitrogen content decreased with depth (0–10 cm) to 0.48±0.08 wt% (May and September). Mo-lar sediment C:N ratio was 12–14, with no significant difference among habitats or be-tween seasons (data not shown). Root nitrogen content ranged from 0.72±0.22 wt% in reed to 1.50±0.44 wt% in the ruderal vegetation. No significant difference was
ob-20
served in reed root nitrogen content between May and September, while ruderal roots had a significantly (P<0.01) higher nitrogen content in May. Root nitrogen pool was 6 (May) and 2 (September) times higher in reed compared to ruderal (Table 3), but total marsh root nitrogen pool was relatively similar in May (8.5 g m−2) and Septem-ber (10.3 g m−2). The nitrogen pool size in leaves varied greatly among habitat types,
25
ranging from none in the creek bank to 26.2 g m−2 in the reed habitat. The weighted average nitrogen pool in leaves was 38% higher in September (15.6 g m−2) than in May (11.3 g m−2), while the spatial distribution was similar. Note, however, that willow
BGD
3, 1081–1119, 2006 Nitrogen retention in a tidal freshwater marsh B. Gribsholt et al. Title Page Abstract Introduction Conclusions References Tables Figures J I J I Back CloseFull Screen / Esc
Printer-friendly Version Interactive Discussion
EGU biomass was not included in our estimates (see methods), thus total marsh nitrogen
standing stocks are underestimated. Average marsh litter nitrogen stock was similar (4.6 g m−2) in May and September, but while the reed litter nitrogen pool was highest in May the opposite was observed in the other habitats (Table 3). Mean litter nitrogen content ranged from 0.9 to 1.2 wt% with no significant difference between habitats.
5
3.3 Marsh15N labelling
Isotopic enrichment (∆δ15N, Fig. 3), as well as the absolute amount of15N assimilated (excess 15N) per unit surface area (Fig. 4), varied greatly among stations, habitats and marsh compartments in both May and September. In May, the ruderal vegetation (leaves and roots) assimilated added15N and the isotopic enrichment increased with
10
time (up to 8‰), while very little enrichment occurred in reed (Fig. 3a). No significant difference in isotopic signature was observed between top shoots and the remaining leaves, thus the reed data have been pooled. Highest enrichment (up to 32‰) was observed in the small watercress (Rorippa sp.) covering the otherwise un-vegetated creek banks in May. However, since the watercress biomass was very low, the impact
15
for total ecosystem15N-content was negligible (Fig. 4a). A similar enrichment pattern was observed in the leaf compartment in September (Fig. 3e), except watercress was absent at creek banks, and 50% less enrichment occurred in the ruderal vegetation. In spite of lower biomass, leaves15N content per unit area was one order of magni-tude higher in ruderal (24.3±11.0 µmol m−2) compared to reed habitats (2.2±2.2 µmol
20
m−2) in May (Fig. 4a). Patterns were similar but less clear in September, due to large heterogeneity in the reed15N content between tides. Enrichment to the root compart-ment was observed in the ruderal habitat with highest enrichcompart-ment (up to 11‰) in May (Fig. 3b,f). While excess15N content was much higher in ruderal compared to reed in May (Fig. 4b), no clear difference was observed in September (Fig. 4f).
25
Except for watercress on creek banks (see above), litter (Fig. 3c, g) was generally the most enriched compartment at all stations in both May and September. Generally the isotopic enrichment decreased with time. There was no significant difference between
BGD
3, 1081–1119, 2006 Nitrogen retention in a tidal freshwater marsh B. Gribsholt et al. Title Page Abstract Introduction Conclusions References Tables Figures J I J I Back CloseFull Screen / Esc
Printer-friendly Version Interactive Discussion
EGU
15
N in in situ litter and litter incubated in litterbags (data not shown). Litter15N content was generally the most important pool in reed and the litter compartment in reed was higher than in other habitats (Fig. 4c, g).
The sediment compartment (0–0.5 cm) was more enriched in May (Fig. 3d) than in September (Fig. 3h), with little temporal variation between tides in both May and
5
September. No15N enrichment was detected in deeper sediment layers and only data for the top layer are reported. While the sediment15N enrichment and total 15N was similar (and low) in all habitats in September (Figs. 3h and 4h), the enrichment of the sediment was much higher in the willow and creek bank compared to the other habitats in May. This was, however, largely due to a very high enrichment at willow St. 4 (up
10
to 30‰) and creek bank St. 10 (up to 33‰), which were both covered by a dense algae mat (Chl a>500 mg m−2). The spatial-temporal pattern in enrichment (Fig. 3d) was directly reflected in the15N content of the surface sediment (Fig. 4d) as sediment nitrogen stocks were similar among stations. The creek bank and willow sediments were the largest pools in May (on a surface area basis).
15
After T0 the 15N enrichment to the sediment was largely due to sorption while al-most all of the15N was found in the organic N pool (remaining after KCl treatment, see methods) after T5 (Fig. 5). Following T31most enrichment was again found in the KCl extractable pool, especially in the most enriched stations. We speculate that15N was initially sorbed to the surface sediment (T0), then assimilated by living algae and
bac-20
teria (T5), and eventually transferred to a different pool (T31) which probably consists of extractable organics (such as dead microbes). More studies are needed to elucidate the dynamics of sediment nitrogen pools.
The particulate matter settling on the sediment surface (filter traps) was highly en-riched in15N after T0(Figs. 6a, b). Contrary to the sediment compartment, the
enrich-25
ment in the settling particles was higher (up to 8 times) in September (Fig. 6b) than in May, especially on the creek bank. This suggests that relatively more sediment15N was acquired directly from the dissolved15NH+4 pool in May. Generally the settling PN was only enriched after the first tide, consistent with observations in the suspended
BGD
3, 1081–1119, 2006 Nitrogen retention in a tidal freshwater marsh B. Gribsholt et al. Title Page Abstract Introduction Conclusions References Tables Figures J I J I Back CloseFull Screen / Esc
Printer-friendly Version Interactive Discussion
EGU particulate nitrogen (SPN) (Gribsholt et al. 2005, 2006). Enrichment (∆δ15N) of settled
particles was similar to that observed in SPN (up to 80 and 100‰ in May and Septem-ber, respectively; Fig. 2c), except for the much higher September creek bank values. The total amount of15N settling on the sediment surface was relatively similar among habitats in May (Fig. 6c), and 3–9 times higher than in September, except for the creek
5
bank where 2.4±2.2 µmol15N settled per m2after T0-September (Fig. 6d).
The invertebrates collected from leaves, litter and sediment surfaces in September were identified into twelve groups classified according to their taxonomic class or order (Fig. 7a). Not all groups were represented on all stations and/or tides. Gastropods (Gastropoda-prosobranchia) and arachnids (Arachnida) were the only groups found at
10
all stations and on most occasions. Significantly enriched δ15N-values were only ob-served after T4in the sap-sucking aphids (Aphididae) at the willow St. 6 (37.0‰) and in one caterpillar (Lepidoptera) (31.1‰) from willow St. 4. Even in the biofilm-grazing gastropods clear enrichments were only observed on few occasions (Fig. 7b). Like-wise, no significant 15N enrichment was observed in the macro-invertebrate infauna
15
(Fig. 7c), which was numerically dominated by Tubificidae (5072±2692 m−2) and Ne-matodae (1555±2837 m−2). Specimens of Hirudines, Trichoptera, Lumibricidae and Talitridae were also present. Considerable heterogeneity occurred in natural abun-dance15N values for all macro-invertebrates, and from our (limited) dataset no clear relationship between neither natural abundance15N or subsequent∆δ15N and habitat
20
type or topographic level (inundation duration) could be determined for any macro-invertebrate group.
3.4 15N mass balance and uptake rates
Overall, 79–135 and 53–126 mmol15N was recovered in the marsh compartments in May and September, respectively (Table 4). On both occasions a similar small
frac-25
tion (4%) of the added label was assimilated at T0. Total marsh 15N pools, however, varied by more than a factor 2 among tides, and within compartments the 15N pool
BGD
3, 1081–1119, 2006 Nitrogen retention in a tidal freshwater marsh B. Gribsholt et al. Title Page Abstract Introduction Conclusions References Tables Figures J I J I Back CloseFull Screen / Esc
Printer-friendly Version Interactive Discussion
EGU size varied by up to a factor 5 (September roots). In May the highest15N content was
observed after T5.This increase was largely (87% of the increase) due to very high (total) sediment uptake in the willow St. 4 and creek bank St. 10, where a thick algal mat covered the sediment surface. Initially most (81%) of the sediment uptake in May was due to sorption, but after T5microbial assimilation accounted for 81% (57 mmol) of
5
the15N uptake to the sediment compartment. After T31 the organic pool decreased to 28%. The root and leaf compartments were also more enriched after T5than after T0 in May. In September, the highest total marsh enrichment was observed after T1. This was mainly due to a high enrichment in the litter, accounting for 54% of the increase compared to T0.
10
In May the sediment and the litter were the most important sinks for 15N account-ing for 40–52% and 20–40% of the assimilated15N, respectively. In September the litter was the most important pool accounting for 29–50% of marsh 15N assimilation, while only 5–16% was assimilated by the sediment and associated microbes. In total 1.2 mmol15N settled on the marsh surface (September T0filter traps), corresponding to
15
0.1% of the added label or 13% of the T0sediment15N content. Eight times more15N was exported as suspended particulate matter (9.5 mmol) during T0-September, than settled on the marsh surface (data not shown).
Average marsh 15N uptake rate (weighted by factors proportional to the area rep-resented by each station) in the first tide (T0) normalized to per hours inundation
20
(hi) was relatively similar in May (11.8 µmol15N m−2h−1i , Fig. 8a) and September (12.6 µmol15N m−2h−1i , Fig. 8b). On both occasion the total 15N uptake rate was higher in ruderal > reed > willow habitats. The creek bank habitat revealed the high-est 15N uptake rates in May, but the lowest in September. This discrepancy was due to a high average sediment uptake rate (14.9 µmol15N m−2h−1i ) caused by high
25
(39 µmol15N m−2h−1i ) uptake in the algal covered St. 10. Excluding St. 10 the total creek bank sediment uptake rate is reduced from 14.9 to 2.8 µmol15N m−2h−1i (and the average marsh uptake rate to 10.2 µmol15N m−2h−1i ), revealing a ranking in total
BGD
3, 1081–1119, 2006 Nitrogen retention in a tidal freshwater marsh B. Gribsholt et al. Title Page Abstract Introduction Conclusions References Tables Figures J I J I Back CloseFull Screen / Esc
Printer-friendly Version Interactive Discussion
EGU uptake rate similar to September among habitat types (ruderal > reed > willow > creek
bank). Within each habitat type, however, the relative importance of the four compart-ments (sediment, roots, leaves, and litter) varied among habitats as well as sampling occasions. While15N assimilation by roots only occurred in the ruderal habitat in May, roots of both reed and ruderal assimilated15N at a similar rate in September (the root
5
compartment in the willow habitat was omitted for logistic reasons, as described previ-ously). Uptake rate into litter in the reed habitat was similar among sampling occasions, but 2–6 times higher in September compared to May in the other habitats. Macrophyte uptake rate was generally low (<1.2 µmol15N m−2h−1i ), except in the ruderal habitat. On average (weighted according to habitat distribution) the relative contribution of the
10
different compartments was relatively similar between May and September, except that the root uptake was more important in September.
Total nitrogen uptake rate per hour inundated, estimated from the 15N uptake rate and taking the average degree of labelling in the ammonium pool (1.3% and 4.5% in May and September, respectively) and flooding duration at each station into account,
15
varied greatly between May and September, mainly because of the differences in the degree of labelling of ammonium (Figs. 8c, d). Thus in May average marsh nitro-gen uptake rate (908 µmol N m−2h−1i ) was more than 3 times faster than in September (280 µmol N m−2h−1i ).
4 Discussion
20
4.1 Whole ecosystem15N labelling
Several studies have used deliberate15N additions to trace nitrogen flow in freshwater (e.g., Kling, 1994; Peterson et al., 1997; Hamilton et al., 2001; Webster et al., 2003 and references therein) and estuarine (e.g. Hughes et al., 2000; Holmes et al., 2000; Tobias et al., 2003) ecosystems. In fringing marshes stable isotopes have been applied
25
BGD
3, 1081–1119, 2006 Nitrogen retention in a tidal freshwater marsh B. Gribsholt et al. Title Page Abstract Introduction Conclusions References Tables Figures J I J I Back CloseFull Screen / Esc
Printer-friendly Version Interactive Discussion
EGU al., 2001); however our study is the first to use this approach to elucidate the fate of
wa-tershed derived nitrogen in tidal marshes. Here, the label was added in a short pulse, mainly due to the constraints of periodic, two-directional water-flows and the complete drainage of the marsh between tides. While adequate for tracing short term processes such as nitrification (Gribsholt at al., 2005, 2006), the feasibility to trace transfer into
5
higher trophic levels and to investigate long term (years) retention is limited. However, even within this relatively short period of labelling, a significant amount (4–9%) of the added tracer was assimilated and retained by the marsh biota. Moreover, the15N label addition method allowed us to identify the microbial community (bacteria, algae, fungi) colonizing the surfaces of the sediment and plant litter as the main sink for watershed
10
derived 15NH+4. While higher organisms were less important for short term nitrogen retention, considerable species specific uptake was revealed, with ruderal vegetation being more important than reed per unit surface area.
The timing of the label addition was carefully selected based on the predicted tidal heights, and while there was very little difference in predicted and observed
inunda-15
tions in May, the September tides were much lower than predicted. Unfortunately this resulted in a significantly shorter marsh inundation time in September compared to May, and less contact between surfaces of standing vegetation, litter and sediment and labelled floodwater. Combined with low ambient ammonium concentration this also re-sulted in a relatively high degree of labelling (4.5%) and a substantial (73%) increase
20
in the total average ammonium concentration in September. Thus the basic assump-tion (see below) that the added15N label does not accelerate in situ rates but merely substitute for ambient14N may not be entirely met in the September experiment and ammonium process rates may have been slightly accelerated (Gribsholt et al., 2006). We expect, however, any perturbation caused by this relatively excessive label
addi-25
tion in September to be of minor importance, since ammonium is likely not limiting in this very nutrient-rich system. Furthermore, our assimilation estimates are prone to errors due to 1) heterogeneity in labelling degree owing to temporal heterogeneity in in situ ammonium concentrations (Fig. 2a); 2) within compartment heterogeneity in
BGD
3, 1081–1119, 2006 Nitrogen retention in a tidal freshwater marsh B. Gribsholt et al. Title Page Abstract Introduction Conclusions References Tables Figures J I J I Back CloseFull Screen / Esc
Printer-friendly Version Interactive Discussion
EGU
15
N natural abundance values (which are subtracted to estimate enrichment (∆δ)); 3) heterogeneity in standing stock (biomass and N wt%) estimates and 4) uncertainties in determination of relative coverage represented by each station. Nevertheless, the value of using in situ label additions to study ecosystem nutrient dynamics is that the processes can be examined in intact systems under ambient conditions, without the
5
artefacts resulting from stimulation of process rates by temporarily increasing nutrient concentrations (nutrient enrichment studies) or artefacts associated with the use of en-closures (microcosm studies) (Schindler, 1998; Mulholland et al., 2000). Moreover, no a priori assumptions about the relative importance of compartments are required. Our results clearly revealed that microbial communities on the sediment surface and on
10
plant litter contribute similarly to15N assimilation despite the predominance of macro-phyte biomass (reed, ruderal and willow) and expected high nitrogen demand. The relatively low uptake by the vegetation likely reflects that nitrogen is not limiting their growth in these marshes fringing the heterotrophic, nutrient-rich Scheldt River (Van Damme et al., 2005; Soetaert et al., 2006). Plant nutrient uptake is usually also not
15
the major pathway of nitrogen removal in most natural wetlands (Verhoeven and Van der Toorn, 1990) and especially not in high-nutrient treatment wetlands where it often accounts for only 1–4% of nutrient removal (e.g., Peterson and Teal, 1996; Huttunen et al., 1996; Brix, 1997). However, macrophyte and tree tissues may be more important for long-term (months) retention (Drake et al., 2006).
20
Although direct uptake by vegetation generally played a minor role in short-term retention, the marsh plants are crucial for nitrogen cycling and marsh ecosystem func-tioning. Plants provide a large surface area for microbial growth, as well as a source for carbohydrates for microbial consumption (Brix, 1997). They release O2 into the sediment promoting coupled nitrification-denitrification (Bodelier et al., 1996; Gribsholt
25
and Kristensen, 2002), influence hydrology and promote sedimentation of particles and subsequent retention. Furthermore, most plant material produced is retained and decomposed by microbes within the marsh system. The presence of higher plants therefore has a significant but indirect impact on nitrogen cycling in tidal freshwater
BGD
3, 1081–1119, 2006 Nitrogen retention in a tidal freshwater marsh B. Gribsholt et al. Title Page Abstract Introduction Conclusions References Tables Figures J I J I Back CloseFull Screen / Esc
Printer-friendly Version Interactive Discussion
EGU marshes.
4.2 Species composition and nutrient retention
Many wetlands are dominated by one or a few vascular plant species, and while the capacity of the strongest competitors such as reed (P. australis, the dominant plant of many European marshes) (Cronk and Fennessy, 2001) to extract nutrients from its
5
environment has been the subject of numerous studies (e.g. Meulenman et al., 2002), the importance of less abundant species is often overlooked as nutrient sinks in input-output studies of wetlands. Although direct15N uptake by vegetation was lower than expected given the high biomass, the isotopic15N-tracer technique revealed interest-ing differences in species functionality. Both the limited importance of direct uptake
10
(leaves and roots) in total15N-processing and the species-specific15N enrichments of macrophytes confirm previous findings on a low order, forested stream (Ashkenas et al., 2004).
In our study the ruderal vegetation proved to be more important for (short term) nitrogen retention than previously assumed. On both occasions15N uptake into both
15
leaves and roots was largely due to uptake by the tall, fast growing annual Policeman’s helmet. Other ruderal species were also enriched, while reed uptake was undetectable or low (Fig. 3). Apparently reed relies less on external and more on internal nitrogen resources than ruderal species, and/or nitrogen turnover rate is much slower in reed compared to ruderal. In addition to differences in life-history strategies, we speculate
20
that higher15N uptake by ruderal vegetation are influenced by a shallower root system in these species compared to reed, thus promoting contact with labelled nitrogen from the flood water.
While a positive relation between the species richness of macrophytes and phos-phorous retention has e.g. been reported for experimental ponds by Engelhardt and
25
Ritchie (2001), it remains to be demonstrated whether species diversity enhances the long term nutrient retention in tidal freshwater marshes. Clearly, species diversity has a role in the short term assimilation of watershed-derived ammonium, but differences
BGD
3, 1081–1119, 2006 Nitrogen retention in a tidal freshwater marsh B. Gribsholt et al. Title Page Abstract Introduction Conclusions References Tables Figures J I J I Back CloseFull Screen / Esc
Printer-friendly Version Interactive Discussion
EGU in internal recycling and release processes, litter decomposition and long term burial
needs further attention. Furthermore, Policeman’s helmet is an exotic, invasive species and is expected to reduce species diversity and to out-compete native light-demanding species in riparian habitats (Naiman and Decamps, 1997).
4.3 Immobilization on litter and sediment surfaces
5
The majority of 15N assimilated by the marsh ecosystem was recovered in the litter and surface sediment compartments. These compartments are dominated by micro-organisms and account for most of the N-assimilation: 70–83% and 41–62% in May and September, respectively. Higher organisms (macrofauna and macrophytes) con-tributed little to the short term 15N retention. Even during the active growing season
10
(May) uptake by vegetation (roots and leaves) was trivial compared to microbial as-similation into the surface sediment and the litter compartment. This dominance of micro-organisms in short-term nitrogen retention confirms previous findings on low or-der streams (Webster et al., 2003, and references therein; Ashkenas et al., 2004). But while the importance of microbes relative to macroorganisms could be expected
15
in relatively pristine streams where adjacent macrophyte vegetation is not subject to flooding, this is far from self-evident in nutrient rich, diurnally flooded wetlands.
Immobilization on litter was quantitatively the most important sink for15N. Plant litter provides an excellent substratum for microbial colonization, and increases the reactive surface areas manifold. Due to its refractory composition, reed litter accumulates in
20
these marshes, providing countless surfaces for biofilm development. Tracer immobi-lization on litter and sediment may, however, be due to both microbial (bacteria, algae and fungi) assimilation and physical sorption. Our sediment KCl extractions suggest that active assimilation by microbes is important, and we speculated the same is true for the litter. Similarly, external N incorporation into decaying Spartina alterniflora has
25
been demonstrated to be at least partly due to biological incorporation (White and Howes, 1994a). The fact that label recovery changes only little over the tides sub-sequent to addition further supports active incorporation rather than physical sorption
BGD
3, 1081–1119, 2006 Nitrogen retention in a tidal freshwater marsh B. Gribsholt et al. Title Page Abstract Introduction Conclusions References Tables Figures J I J I Back CloseFull Screen / Esc
Printer-friendly Version Interactive Discussion
EGU alone. In a laboratory15N dilution study Bowden (1986) found that litter was a net sink
for ammonium with immobilization exceeding mineralization under aerobic conditions.
5 Whole ecosystem15N budget
The combined data set presented in this and companion papers (Gribsholt et al., 2005, 2006) allows us to establish an integral marsh ecosystem nitrogen processing budget
5
(Table 5). Here we present only the total budget after T0, as the cumulative bud-gets changes only slightly after subsequent tides (Gribsholt et al., 2005, 2006). In both May and September the majority of 15NH4 added was exported with the outgo-ing tide (69 and 51% in May and September, respectively). Nitrification was the most important transformation pathway, accounting for 8.7 and 7.7% of the added label,
cor-10
responding to 30 and 17% of the15N-transformation in May and September, respec-tively. A comparison between whole-system nitrification estimates and water-column nitrification rates revealed that most (>70%) of the nitrification was associated with the marsh surface. Moreover, sedimentary denitrification was identified to be significant in September, while short term assimilation accounted for a minor fraction (∼4% after
15
T0) of added label (Table 5). Consequently, in terms of nitrogen processing marsh sur-faces appear more important as habitats for nitrifiers and denitrifiers than for nitrogen assimilating organisms.
The relative importance of the litter and surface sediments for15N assimilation (see above) are consistent with these findings. Rather than direct uptake by macrophytes
20
(leaves and roots), it is the large reactive surface area (and carbon source) provided by the tidal freshwater marsh vegetation (standing or litter) that is most crucial for the functioning of these ecosystems both when it comes to nitrogen transformation and short term nitrogen retention. Although we clearly identified microbes to govern short-term nitrogen retention in tidal marshes, our whole ecosystem labelling study does not
25
allow us to elucidate in detail the dynamics within the microbial compartments; e.g. we do not know whether eukaryotes (benthic algae or fungi) or prokaryotes contribute
BGD
3, 1081–1119, 2006 Nitrogen retention in a tidal freshwater marsh B. Gribsholt et al. Title Page Abstract Introduction Conclusions References Tables Figures J I J I Back CloseFull Screen / Esc
Printer-friendly Version Interactive Discussion
EGU most to nitrogen retention. Our next step will be to quantify the relative roles of benthic
algae and bacteria in marsh nitrogen retention and to study the long-term retention of nitrogen in tidal marsh systems.
Acknowledgements. This research was supported by the Flemish-Dutch co-operation on
Coastal Research (VLANEZO) under the Flemish and Dutch Science Foundations FWO-NWO,
5
and by the “Scientific Research Community” FWO project “Ecological characterization of Euro-pean estuaries, with emphasis on the Scheldt estuary”. We thank the staff at the NIOO-CEME analytical laboratory and at the Testing Laboratory for Chemical Water Quality, Department of Biology, University of Antwerp for their assistance. This is publication nr 3883 from the NIOO-KNAW, Yerseke.
10
References
Ashkenas, L. R., Johnson, S. L., Gregory, S. V., Tank, J. L., and Wollheim, W. M.: A stable isotope tracer study of nitrogen uptake and transformation in an old-growth forest stream, Ecology, 85, 1725–1739, 2004.
Bodelier, P. L. E., Libochant, J. A., Blom, C. W. P. M., and Laanbroek, H. J.: Dynamics of
15
nitrification and denitrification in root-oxygenated sediments and adaptation of ammonia-oxidizing bacteria to low-oxygen or anoxic habitats, Appl. Environ. Microbiol., 62, 4100–4107, 1996.
Bowden, W. B.: Nitrification, nitrate reduction, and nitrogen immobilization in a tidal freshwater marsh sediment, Ecology, 67, 88–99, 1986.
20
Bowden, W. B., Peterson, B. J., Hobbie, J. E., Steudler, P. A., and Moore III, B.: Transport and processing of nitrogen in a tidal freshwater wetland, Water Resour. Res., 27, 389–408, 1991. Brix, H.: Do macrophytes play a role in constructed treatment wetlands?, Water Sci. Technol.,
35, 11–17, 1997.
Cronk, J. K. and Fennessy, M. S.: Wetland plants. Biology and Ecology, Lewis Publisher, Boca
25
Raton, USA, 2001
Drake, D. C., Naiman, R. J., and Bechthold, J. S.: Fate of nitrogen in riparian forest soils and trees: An15N tracer study simulating salmon decay, Ecology, 87, 1256–1266, 2006.
BGD
3, 1081–1119, 2006 Nitrogen retention in a tidal freshwater marsh B. Gribsholt et al. Title Page Abstract Introduction Conclusions References Tables Figures J I J I Back CloseFull Screen / Esc
Printer-friendly Version Interactive Discussion
EGU
Engelhardt, K. M. A. and Ritchie, M. E.: Effects of macrophyte species richness on wetland ecosystem functioning and services, Nature, 411, 687–689, 2001.
Gribsholt, B. and Kristensen, E.: Effects of bioturbation and plant roots on salt marsh bioturba-tion: a mesocosm study. Mar. Ecol. Prog. Ser., 241, 71–87, 2002.
Gribsholt, B., Boschker, H. T. S., Struyf, E., Andersson, M., Tramper, A., De Brabandere, L.,
5
Van Damme, S., Brion, N., Meire, P., Dehairs, F., Middelburg, J. J., and Heip, C.: Nitro-gen processing in a tidal freshwater marsh: a whole ecosystem15N labeling study, Limnol. Oceanogr., 50, 1945–1959, 2005.
Gribsholt, B., Struyf, E., Tramper, A., Andersson, M. G. I., Brion, N., De Brabandere, L., Van Damme, S., Meire, P., Middelburg, J. J., Dehairs, F., and Boschker, H. T. S.: Ammonium
10
transformation in a nitrogen-rich tidal freshwater marsh, Biogeochem., in press, 2006. Hamilton, S. K., Tank, J. L., Raikow, D. F., Wollheim, W. M., Peterson, B. J., and Webster,
J. R.: Nitrogen uptake and transformation in a midwestern U.S. stream: A stable isotope enrichment study, Biogeochem., 54, 297–340, 2001.
Hansson, L-L., Br ¨onmark, C., Nilsson, P. A., and ˚Abj ¨ornsson, K.: Conflicting demands on
15
wetland ecosystem services: nutrient retention, biodiversity or both?, Freshw. Biol., 50, 705– 714, 2005.
Holmes, R. M., Peterson, B. J., Deegan, L. A., Hughes, J. E., and Fry, B.: Nitrogen biogeo-chemistry in the oligohaline zone of a New England estuary, Ecology, 81, 416–432, 2000. Hughes, J. E., Deegan, L. A., Peterson, B. J., Holmes, R. M., and Fry, B.: Nitrogen flow through
20
the food web in the oligohaline zone of a New England estuary, Ecology, 81, 433–452, 2000. Huttunen, A.: Heikkinen, K., and Ihme, R.: Nutrient retention in the vegetation of an overland
flow treatment system in northern Finland, Aquat. Bot., 55, 61–73, 1996.
Jeffrey, S. W. and Humphrey, G. F.: New spectrophotometric equations for determining chloro-phylls a, b, c1 and c2 in higher plants, algae and natural phytoplankton, Biochem. Physiol.
25
Pflanzen, 167, 191–194, 1975.
Kling, G. W.: Ecosystem-scale experiments. The use of stable isotopes in fresh waters, in: Environmental Chemistry of lakes and reservoirs, edited by: Baker, L. A., Am. Chem. Soc., 91–120, 1994.
Merrill, J. Z. and Cornwell, J.: The role of oligohaline marshes in estuarine nutrient cycling, in:
30
Concepts and controversies in tidal marsh ecology, edited by: Weinstein, M. P. and Kreeger, D. A., Dordrecht, The Netherlands, 425–441, 2000.
BGD
3, 1081–1119, 2006 Nitrogen retention in a tidal freshwater marsh B. Gribsholt et al. Title Page Abstract Introduction Conclusions References Tables Figures J I J I Back CloseFull Screen / Esc
Printer-friendly Version Interactive Discussion
EGU
efficiency in Phragmites australis stands after wastewater application, Wetlands, 22, 712– 721, 2002.
Mitsch, J. M. and Gosselink, J. G.: The value of wetlands: importance of scale and landscape setting, Ecological Economics, 35, 25–33, 2000.
Mulholland, P. J., Tank, J. L., Sanzone, D. M., Wollheim, W. M., Peterson, B. J., Webster, J.
5
R., and Meyer, J. L: Nitrogen cycling in a forest stream determined by a15N tracer addition, Ecol. Monogr., 70, 471–493, 2000.
Neiman, R. J. and Decamps, H.:, The ecology of interfaces: Riparian zones, Annu. Rev. Ecol. Syst., 28, 621–658, 1997.
Nieuwenhuize, J., Maas, Y. E. M., and Middelburg, J. J.: Rapid analysis of organic carbon and
10
nitrogen in particulate materials, Mar. Chem., 45, 217–224, 1994.
Odum, W. E.: Comparative ecology of tidal freshwater and salt marshes, Annu. Rev. Ecol. Syst., 19, 147–176, 1988.
Peterson, S. B. and Teal, J. M.: The role of plants in ecologically engineered wastewater treat-ment systems, Ecol. Eng., 6, 137–148, 1996.
15
Peterson, B. J., Bahr, M., and Kling, G. W.: A tracer investigation of nitrogen cycling in a pristine tundra river, Can. J. Fish. Aquat. Sci., 54, 2361–2367, 1997.
Rijstenbil, J. W.: Effects of UVB radiation and salt stress on growth, pigments and antioxidative defense of the marine diatom Cylindrotheca closterium, Mar. Ecol. Prog. Ser., 254, 37–48, 2003.
20
Schindler, D. W.: Replication versus realism: the need for ecosystem-scale experiments, Ecosystems, 1, 323–334, 1998.
Soetaert, K., Middelburg, J. J., Heip, C., Meire, P., Van Damme, S., and Maris, T.: Long-term change in dissolved inorganic nutrients in the heterotrophic Scheldt estuary (Belgium, the Netherlands), Limnol. Oceanogr., 51, 409–423, 2006.
25
Tobias, C. R., Anderson, I. C., Canuel, E. A., and Macko, S. A.: Nitrogen cycling through a fringing marsh-aquifer ecotone, Mar. Ecol. Prog. Ser., 210, 25–39, 2001a
Tobias, C. R., Macko, S. A, Anderson, I. C., Canuel, E. A., and Harvey J. W.: Tracking the fate of a high concentration groundwater nitrate plume through a fringing marsh: A combined groundwater tracer and an in situ isotope enrichment study, Limnol. Oceanogr., 46, 1977–
30
1989, 2001b.
Tobias, C. R., Cieri, M., Peterson, B. J., Deegan, L. A., Vallino, J., and Hughes, J. E.: Processing watershed-derived nitrogen in a well-flushed New England estuary, Limnol. Oceanogr., 48,
BGD
3, 1081–1119, 2006 Nitrogen retention in a tidal freshwater marsh B. Gribsholt et al. Title Page Abstract Introduction Conclusions References Tables Figures J I J I Back CloseFull Screen / Esc
Printer-friendly Version Interactive Discussion
EGU
1766–1778, 2003.
Van Damme, S., Struyf, E., Maris, T., Ysebaert, T., Dehairs, F., Tackx , M., Heip, C., and Meire, P.: Spatial and temporal patterns of water quality along the estuarine salinity gradient of the Scheldt estuary (Belgium and The Netherlands): results of an integrated monitoring approach, Hydrobiologia, 540, 29–45, 2005.
5
Verhoeven, J. T. A. and Van der Toorn, J.: Marsh eutrophication and wastewater treatment, in: Wetlands and Shallow Continental water bodies, edited by: Patten, B. C., SPB Academic Publishing, The Hague, The Netherlands, 1, 571–585. 1990.
Verhoeven, J. T .A., Whigham, D. F., van Logtestijn, R., and O’Neill, J.: A comparative study of nitrogen and phosphorous cycling in tidal and non-tidal riverine wetlands, Wetlands, 21,
10
210–222, 2001.
Webster, J. R., Mulholland, P. J., Tank, J. L., Valett, H. M., Dodds, W. K., Peterson, B. J., Bow-den, W. B., Dahm, C. N., Findlay, S., Gregory, S. V., Grimm, N. B., Hamilton, S. K., Johnson, S. L., Marti, E., McDowell, W. H., Meyer, J. L., Morrall, D. D., Thomas, S. A., and Wollheim, W. M.: Factors affecting ammonium uptake in streams – an inter-biome perspective, Freshw.
15
Biol., 48, 1329–1352, 2003.
White, D. S. and Howes, B. L.: Nitrogen incorporation into decomposing litter of Spartina
al-terniflora, Limnol. Oceanogr., 39, 133–140, 1994a.
White, D. S. and Howes, B. L.: Long-term15N-nitrogen retention in the vegetated sediments of a New England salt marsh, Limnol. Oceanogr., 39, 1878–1892, 1994b.
BGD
3, 1081–1119, 2006 Nitrogen retention in a tidal freshwater marsh B. Gribsholt et al. Title Page Abstract Introduction Conclusions References Tables Figures J I J I Back CloseFull Screen / Esc
Printer-friendly Version Interactive Discussion
EGU Table 1. Habitat (vegetation type), relative area of study site represented by station (Area%),
surface elevation (relative to mean sea level), duration of flooding during T0and standing above-ground biomass at each station in May and September. Locations of sampling stations are shown in Fig. 1.
Habitat Station nr. Relative Surface Flooding Standing
Area elevation duration (T0) biomassa
May Sept May Sept
(%) (m) (min) (min) (kg m−2) (kg m−2) Reed 1 25 3.23 117 70 0.9 2.2±1.5 2 10 2.97 139 109 0.9 2.3±0.9 3 10 3.06 133 100 0.8 1.2±0.4 Willow 4 12 3.15 124 88 0 0.7±0.2b 5 10 3.34 105 39 0 0.4 ±0.3b 6 10 3.40 92 0 0.2b 0.6±0.3b Ruderal 7 5 3.31 109 48 0.4 1.2±0.5 8 6 3.25 116 68 0.6 0.8±0.7 9 5 3.31 109 48 1.1 0.9±0.6 Creek 10 2 3.11 129 94 0c 1.3±0.9 11 3 2.87 148 118 0c 0 12 2 2.67 163 140 0c 0 a
Above-ground biomass only and willows and benthic microalgae are excluded.
b
Biomass of understory ruderals (e.g., Policeman’s Helmet (I. glandulifera)).
c
BGD
3, 1081–1119, 2006 Nitrogen retention in a tidal freshwater marsh B. Gribsholt et al. Title Page Abstract Introduction Conclusions References Tables Figures J I J I Back CloseFull Screen / Esc
Printer-friendly Version Interactive Discussion
EGU Table 2. Summary of water inundation parameters for the two sampling occasions. Duration
of main tide (flood and ebb), relative area inundated, maximum water height above creek bed (2.47 m above mean sea level) below measuring platform and flood water volume (calculated water budget). All data are for tides prior to marsh station sampling, except for September T5, where stations were sampled at T4.
Tide Flood (min) Ebb (min) Area inundated (%) Water height (cm) Flood (m3)
Maya Septb May Sept May Sept May Sept May Sept
T0 80 77 131 107 100 98 125 103 1823 911
T1 77 71 119 103 100 95 117 95 1700 667
T5 78 58 139 78 100 78 129 81 1912 307
T31 76 ndc 106 nd 100 nd 100 nd 900 nd
a
Compiled from Gribsholt et al. (2005).
b
Compiled form Gribsholt et al. (2006).
c
BGD
3, 1081–1119, 2006 Nitrogen retention in a tidal freshwater marsh B. Gribsholt et al. Title Page Abstract Introduction Conclusions References Tables Figures J I J I Back CloseFull Screen / Esc
Printer-friendly Version Interactive Discussion
EGU Table 3. Nitrogen pool size in the four main compartments (sediment (0–0.5 cm), roots, leaves
and litter) in the different habitats in May and September. Numbers in parenthesis are percent-age of total N in the four compartments.
Nitrogen (g m−2)
Habitat Sediment Root Leaves Litter Total
May Marsha 12.9 (35) 8.5 (23) 11.3 (30) 4.6 (12) 37 Reed 12.3±0.9 17.1±1.7 17.7±3.4 7.7 55 Willow 14.0±4.3 1.1±0.3b 2.6 ±3.8b 0.8 18 Ruderal 11.6±0.7 2.7±1.8 17.5±10.4 1.9 34 Creek 13.6±4.4 0 0.3±0.0c 0.8 15 September Marsha 13.0 (30) 10.3 (24) 15.6 (36) 4.6 (11) 44 Reed 12.5±1.1 20.2±1.7 26.2±8.2 5.9±0.4 65 Willow 13.5±3.7 n.d n.d 3.4±1.2 17 Ruderal 12.5±0.3 9.1±3.5 9.3±3.1 4.7±1.6 36 Creek 12.6±4.0 0 0 2.6±2.0 15 a Area-weighted average. b
Policeman’s Helmet (I. glandulifera) only.
c
BGD
3, 1081–1119, 2006 Nitrogen retention in a tidal freshwater marsh B. Gribsholt et al. Title Page Abstract Introduction Conclusions References Tables Figures J I J I Back CloseFull Screen / Esc
Printer-friendly Version Interactive Discussion
EGU Table 4. 15N recovery in the marsh compartments after T0, T1, T2T4/5 and T29/31 in May and
September. Numbers in parenthesis are percentage of the total amount of15N added at T0.
15 N (mmol) Habitat T0 T1 T2 Tb 4/5 T c 29/31 May Marsh 79 (4.0) nd nd 135 (6.8) 98 (5.0) Sediment 32 (1.6) nd nd 70 (3.5) 46 (2.3) Roots 6 (0.3) nd nd 17 (0.9) 10 (0.5) Leaves 8 (0.4) nd nd 20 (1.0) 19 (1.0) Litter 33 (1.7) nd nd 27 (1.4) 23 (1.2) Fauna nda nd nd nd nd September Marsh 56 (3.9) 126 (8.9) 53 (3.8) 57 (4.1) 68 (4.8) Sediment 9 (0.7) 6 (0.4) 6 (0.4) 8 (0.6) 7 (0.5) Roots 16 (1.1) 38 (2.7) 7 (0.5) 11 (0.8) 19 (1.4) Leaves 5 (0.3) 18 (1.3) 14 (1.0) 12 (0.9) 21 (1.5) Litter 26 (1.8) 64 (4.5) 26 (1.9) 25 (1.8) 20 (1.4) Fauna 0 0 0 0 0 a Not determined. b
In May T5was sampled, while T4was sampled in September.
c
BGD
3, 1081–1119, 2006 Nitrogen retention in a tidal freshwater marsh B. Gribsholt et al. Title Page Abstract Introduction Conclusions References Tables Figures J I J I Back CloseFull Screen / Esc
Printer-friendly Version Interactive Discussion
EGU Table 5. 15N mass balance budget. Recovery in the various pools after T0in May 2002 and
September 2003. Numbers in parenthesis are percentage of the total15N added.
May September
Compartment (mmol) (mmol)
Tracer input 1976 (100) 1409 (100)
15
N exported unchanged (as15NH4) 1370 (69) 715 (51)
15 N transformed 607 (31) 694 (49) 15 NO3+15NO2 172 (8.7) 109 (7.7) 15 N2O 0.13 (0.01) 0.2 (0.01) 15 N2 0.11 (0.01) 7.9 (0.5) SP15N 9.6 (0.5) 9.5 (0.7) Stored 79 (4.0) 56 (3.9) Sediment 32 (1.6) 9 (0.7) Leaves 8 (0.4) 5 (0.3) Roots 6 (0.3) 16 (1.1) Litter 33 (1.7) 26 (1.8) Fauna – – 0 –