Science Arts & Métiers (SAM)
is an open access repository that collects the work of Arts et Métiers Institute of Technology researchers and makes it freely available over the web where possible.
This is an author-deposited version published in: https://sam.ensam.eu Handle ID: .http://hdl.handle.net/10985/19567
To cite this version :
Jianguang BAO, Adil BENAARBIA, Siyuan BAO, Xiaofeng GUO, Yonghong WANG, Wei SUN -High temperature strain heterogeneities tracking within hole-specimens of fv566 turbine steel via digital image correlation - Materials Science and Engineering: A - Vol. 777, p.139068 - 2020
High temperature strain heterogeneities tracking within hole-specimens of
FV566 turbine steel via digital image correlation
Jianguang Bao a,b, Adil Benaarbia c*, Siyuan Bao d, Xiaofeng Guo a, Yonghong Wang d, Wei Sun a
a Department of Mechanical, Material and Manufacturing Engineering, University of Nottingham, Nottingham, Nottinghamshire, NG7 2RD, United Kingdom
b Aircraft Strength Research Institute, Aviation Industry Corporation of China, Xi’an, Shaanxi Province, 710065, China
c Arts et Métiers Institute of Technology, CNRS, Université de Lorraine, LEM3, F-57000 Metz, France
d School of Instrument Science and Opto-Electronics Engineering, Hefei University of Technology, Anhui Province, 230009, China
Abstract
This paper presents experimental and numerical investigations to study spatial-temporal distributions of strain heterogeneities within a FV566 turbine rotor steel subjected to high temperature conditions. Strain field were determined during monotonic tensile tests performed on flat specimens containing a circular hole to give rise to heterogeneous strain fields. A home-made digital image correlation system with an image restoration module was developed and employed to record and analyse the deformation process till the macroscopic fracture of the investigated specimens. Noticeable in-plane strain concentration zones and effects of the sample design were highlighted and deeply examined. Experimental results combined with finite element analyses based on a classical Johnson-Cook model indicated that the hole shape was the important factor affecting the strength and the spatio-temporal
Corresponding Authors.
E-mail address: jianguang.bao@nottingham.ac.uk (J. Bao), adil.benaarbia@ensam.eu (A. Benaarbia), and yhwang@hfut.edu.cn (Y. Wang)
distribution of the strain fields. Microstructural investigations were also conducted to characterize and assess the microscale damage features of the FV566 steel. The ruptured area for all the investigated temperature tests revealed ductile rupture behaviour. Changes on grain boundaries and misorientation near strain localized regions were also investigated. It was found that the propagation of cracks surrounding the hole in FV566 specimens was mainly affected by the nucleation and propagation of strain localization zones.
Keywords: High temperatures; Digital image correlation; Strain heterogeneities; FV566 steel; Finite element analysis
1. Introduction
FV566 steels are commonly used for turbine systems in the power plant industries [1–4]. These materials are specifically designed for operation within high temperature environments and high pressures. Although most of the common deformation mechanisms of such materials are well known in the literature for both monotonic and cyclic loadings [5–8], an in-depth understanding regarding their local mechanical behavior is of great interest for the component design and failure assessment.
Digital Image Correlation (DIC) is an in-situ contactless technique that gives access to the full field displacement and strain fields on the surface of materials based on the comparison of two images acquired at different states [9,10]. Although not as widespread as room temperature DIC, high temperature DIC has been successfully used in the past by a number of researchers on many engineering materials [11–20]. B. Grant et al [21] presented the use of filters combined with blue illumination and was then used to experimentally determine the Young’s modulus and the coefficient of thermal expansion of a non-uniformly heated sample of RR1000 at 800 ℃. M. Novak and F. Zok [22] used DIC coupled with a laser heating facility to assess the thermal expansion of Inconel 625 at 1200 ℃ and strain mapping of C/SiC at 1500 ℃. Full-field thermal deformation and thermal expansion measurements of chromium-nickel austenite stainless steels were determined by B. Pan et al [23] using the DIC technique coupled with a band pass filter at high temperatures up to 1200 ℃. Wang et al [24]derived stress-strain curves of an Inconel 718 Ni-based super alloy at different temperature ranges (21 °C, 704 °C and 982 °C) based on their proposed DIC system to evaluate the dependency of the Young’s modulus on the test temperature. Based on the speckle pattern prepared by a sprayed
tungsten powder, X. Guo et al [25] proposed an experimental approach for measuring the thermo-mechanical properties of carbon fibers at temperatures up to 2600 °C. By utilizing ultraviolet (UV) lights and UV optics, R. Berke and J. Lambros[26] obtained the coefficient of thermal expansion as a function of temperature (up to 1260℃) for the nickel superalloy Hastelloy-X. Most of the available DIC studies were limited to the experimental and numerical improvement of the technique, however in-depth analysis related to high temperature strain heterogeneities observed on DIC are relatively less reported [27–29]. B. Swaminathan et al. [30,31] studied the thermomechanical cyclic response of a dynamic strain aging Ni-based superalloy, namely Hastelloy X, at elevated temperatures in the plastic regime under both uniaxial and biaxial loading conditions. Using a home-made DIC system, the authors have inferred that Portevin-Le Chatelier bands initiated around stress concentration zones causing further jumps in the local strain. This helped the authors to gain further knowledge regarding the effects of dynamic strain aging on the overall and local plastic deformation. Utilizing the electron back scatter diffraction analysis and DIC measurement, M. Eskandari [32] observed that the plastic strain showing more homogeneity at 300 ℃ due to the lack of both strain-induced martensite and deformation twinning. Coupling with microstructural investigations and numerical tools, the full-field DIC strain patterns can provide further knowledge on mechanisms affecting the material lifespan, which is often limited by strain concentration and followed more or less quickly by crack inception.
The main objectives of the current work are i) to design and validate a DIC-based experimental protocol to track strain heterogeneities in the presence of high strain gradient and high temperature conditions due to geometry change and ii) to gain further information regarding the local deformation mechanisms of the investigated FV566 steel under biaxial stress states. To this end, monotonic tensile tests, combined with a home-made high temperature DIC system, were performed at 500 ℃ and 600 ℃ on flat specimens containing a circular hole to give rise to heterogeneous strain. Microstructure characterizations were also performed on ruptured samples to investigate the local failure features of the investigated FV566 steel. Then, finite element analyses based on a Johnson-Cook model were carried out to evaluate the feasibility of the designed high temperature DIC experimental setup.
2. Experimental work
The material used for the experimental investigations is a FV566 martensitic stainless steel cut from an area close to the centerline of a service-aged gas turbine rotor. The later had previously been subjected to 90,000 operational hours at a maximum speed of 3000rpm and temperature of approximately 420°C [3]. The steel was then tempered at 650℃ for 4 hours after normalizing at 1050℃. Its chemical composition is listed in Table 1 while the mechanical properties at different temperatures are given in Ref. [3].
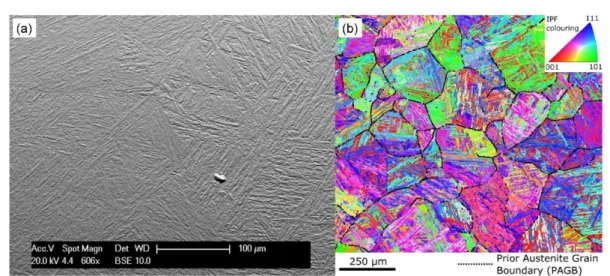
Fig.1a presents the microstructure of the FV566 steel after heat treatment with the average grain size of 30 μm. After tempering, a typical tempered martensitic microstructure in the as-received material can be seen in Fig.1b [33]. Prior austenite grains (PAGs), packets, blocks, sub-blocks and laths, were involved, as has been noticed in [34]. Also, according to the Kurdjumov-Sachs orientation relationship with the parental austenitic phases [35], the PAGs in the as-received material are less than 300μm in size with the misorientation in a range of 23° - 41°. Sub-blocks and laths have the average misorientation angles of 1.8° and 8.3°, respectfully.
Table 1: Nominal chemical composition of FV566 (in mass %).
Material C Cr Mn Mo Ni Nb P Si S V Fe
FV566 0.1 12.0 0.61 1.35 2.4 0.28 0.02 0.35 0.01 0.15 Bal
Fig. 1. (a) Backscattered electron image and (b) an EBSD orientation map of the as received FV566 material.
Many structural components possess geometrical features such as holes, corners or gaps that are necessitated by design to accommodate fasteners, joints, or for weight reduction. Under the influence of combined thermal and mechanical loads, such stress concentration sites may become initiation sites of void nucleation and fracture [30]. The local strain fields can be highly inhomogeneous in such biaxial, or in general triaxial, stress states [36]. Hence, specimens with a hole of Ø3.75 mm at the central part and symmetrical protrusions of 3 mm on both extremities were designed and tested under high temperature tensile loading. The holes of Ø5 mm on both sides were machined to satisfy the loading pins’ requirement. Dimensions of the specimen are shown in Fig. 2.
Fig. 2. Specimen configuration (All dimensions are in mm, the thickness is set at 2 mm).
2.2 High temperature DIC measurement 2.2.1 Methodology
To carry out DIC measurement under high temperature environments, several technical problems need to be considered. These include i) the image overexposure and heat flow disturbance, ii) the artificially controlled speckle pattern that requires a high temperature resistant coating material, and iii) the brightness of the visible thermal radiations emitted by the specimen in comparison with the white light source that is commonly used to illuminate the DIC sample.
An image captured at high temperature environment can be seen as a degraded image. To accommodate the heat flux disturbance, an image restoration technique is employed to repair the degraded images. This combines an image averaging algorithm and an image inverse filter method to process the recorded images. The image degradation, denoted hereafter by 𝑟(𝑥, 𝑦), can thus be considered as the influence of both a degradation function, 𝑙(𝑥, 𝑦) , and an additive noise, 𝑚(𝑥, 𝑦), such that
where 𝑡(𝑥, 𝑦) stands for the reference image before degradation. In terms of the frequency domain, the following equations can be given:
𝑅(𝑢, 𝑣) = 𝑇(𝑢, 𝑣)𝐿(𝑢, 𝑣) + 𝑀(𝑢, 𝑣); 𝑇̂(𝑢, 𝑣) =𝑅(𝑢, 𝑣)
𝐿(𝑢, 𝑣)= 𝑇(𝑢, 𝑣) +
𝑀(𝑢, 𝑣)
𝐿(𝑢, 𝑣), (2) where 𝑇(𝑢, 𝑣) stands for the Fourier transform of the images before degradation, 𝑅(𝑢, 𝑣) the Fourier transform of the degenerated images, 𝐿(𝑢, 𝑣) the Fourier transform of the degenerate function, 𝑀(𝑢, 𝑣) the Fourier transform of noise, and 𝑇̂(𝑢, 𝑣) the estimated value of 𝑇(𝑢, 𝑣). It can be seen from the Eq. (2) that if the degenerated function 𝐿(𝑢, 𝑣) is close to zero, it is easy to affect the estimated value of 𝑇(𝑢, 𝑣). The filter radius can be shortened to reduce the scope of filtering, so that the passed frequency is close to the origin and the probability to encounter zero can be reduced. In the current work, the filter radius was set as 28 pixels and further details were explained in the authors’ previous work [37].
Different techniques are available in the literature to generate the high temperature resistance speckle for DIC [38]. In order to increase the contrast between the speckle pattern and the background, the specimens were first covered with white inks and then, after a drying process, the black ink speckle pattern was sprayed. The pretreatment was necessary for a better adhesion of spray painting for high temperature environments. The gauge part was first ground with coarse grind paper to increase its surface roughness. After cleaned the grease on the surface and rinsed with water, the specimens with white painting were placed in a furnace for 2 hours at 200℃ in order to make the white paint solidified completely. The same procedure was repeated for the black one. Furthermore, the white uniform ink layer serves to avoid “shiny” surface, sensitive to the light reflection [39]. The example of obtained speckle pattern for the test specimens is presented in Fig. 3b.
Finally, a blue LED light was employed to illuminate the sample gauge part with a band pass filter to inhibit the impact of surface radiation at high temperatures. This paper follows a 2D DIC approach using blue light along with blue range band pass filters to capture the visible images.
2.2.2 Experimental Setup
The experimental setup is shown in Fig. 3. It consists of a high temperature furnace equipped with a glass window, a charged-coupled-device (CCD) camera (AVT Stingray F-504B), a band-pass filter (441 nm ± 10 nm), a blue LED light source and a stretching machine. The
furnace was employed to monitor the test temperature up to 600 °C. The detector of the camera was operated with a 2452 by 2056 pixels window size and 19 µm pixel size. The camera was positioned on a tripod approximately 1 m from the specimen surface. It was fixed and kept perpendicular to the gauge part during the loading in order to collect reliable visible images. The camera frame rate was set at 4 frames per second to obtain enough sampled data while the integration time was set at 50 ms. The blue LED light source with a wavelength of 440 nm ± 20 nm was used to provide quasi-monochromatic illuminations.
Fig. 3. (a) The experimental setup showing the digital camera used for the DIC measurements, a high temperature
furnace, a narrow band pass filter lens of 441 nm ± 10 nm bandwidth and a monochromatic light source with the wavelength of 440 nm ± 20 nm. (b) The test specimen sprayed with a black/white speckle.
The test specimens were fastened to a cylindrical and slender high temperature stretch rod which passes through upper and lower walls of high temperature furnace by high temperature metal pins, as shown in Fig. 3b. The specimen was heated from ambient temperature to the investigated temperatures (500 ℃ and 600 ℃) with a rate of 25 ℃/minute, and then exposed to the test temperature for a half hour prior to the mechanical loading. In order to remove the gap between the test sample and the stretching rod, a preloading was applied to capture the reference image for DIC computations. Then monotonic tensile test under constant strain rate of 0.1% s-1 were conducted until the macroscopic fracture.
2.3 Microstructure characterization
and EBSD. SEM observations were conducted on an environmental scanning electron microscope Philips (FEI) XL30, which offers a 4-axis motorized stage with full manual override. The resolution at 30 KV is 3.5 nm. EBSD maps analysis was performed from the same cross section using a JEOL 7100F FEG-SEM equipped with Oxford Instruments AZtec HKL Advanced EBSD System (with NordlysMax3) for crystallographic characterization, with the step size of 0.2 μm and 0.267 μm at 15 kV, a working distance of 15mm, an aperture of 120 mm and a probe current between 0.1 nA and 1 nA. The EBSD maps were then collected together with a BSE image, where the contrast is highly sensitive to the crystallographic orientation of the sample normal. The post-processing of the EBSD data was performed using the HKL Channel 5 software from Oxford instruments.
Prior to microstructure characterization the specimen surface was polished to a good-quality mirror finish. This conventional metallographic preparation procedure involved an initial grinding stage on P240 to P1200 papers (lower grit size) with water to remove damage from the sample surface,polishing stages using 0.3 μm to 1 μm diamond suspensions and final chemo-mechanical polishing stage with a suspension of 0.06 μm colloidal silica.
3. Results and analysis
3.1 Kinematic analysis
3.1.1 Overall tensile responses
The tensile responses (force vs displacement) of the investigated specimens for both 500 ℃ and 600 ℃ test temperatures are given in Fig. 4. The results show a maximum reachable load increases for low temperatures (the ultimate force decreases by about 30% when going from 500 ℃ to 600 ℃). Also, the tensile strength at 500 ℃ was higher than that at 600 ℃, showing a noticeable temperature dependence effect. A macroscopic structural softening, highlighted by a displacement of necking lips, is also observed followed by a broad plateau. This ductile behavior is more pronounced for the high test temperature conditions, exhibiting the fracture displacements of ~ 4.2 mm and ~ 5.4 mm for 500 ℃ and 600 ℃, respectively.
Fig. 4. The F (force) vs. (displacement) curve of the test specimens under both 500 ℃ and 600 ℃ temperatures, along with four images captured by the digital camera at different stages of the test.
3.1.2 Strain maps
The kinematic assessments were analyzed in terms of the mean logarithmic strain components. The objective was to track the possible development of strain localization zones throughout the tensile test. The local mechanical response of the test specimens at the region of interest (ROI) was thus evaluated (see Fig.5). Dantec Dynamics software was used to post-process the visible images and assess the strain maps. Note that a preload of 100 N was performed prior to the tensile test in order to eliminate the superfluous load and strain resulted from the vacuum and thermal expansion. A subset of 41 × 41 pixels and a grid step of 17 pixels were used to evaluate the strain tensor at each point of interest. Cubic B-spline interpolations with normalized squared differences criterion were chosen. An area corresponding to a hole of Ø3.75 mm at the ROI and symmetrical protrusions of 3mm on both extremities, with a size of 300000 pixels (Approximately 820 subsets per specimen), was chosen as the ROI (see Fig. 5).
Fig. 5. Subfigures highlighting the region of interest, region for strain pattern analysis and locations of points of
interest for the local kinematic analysis.
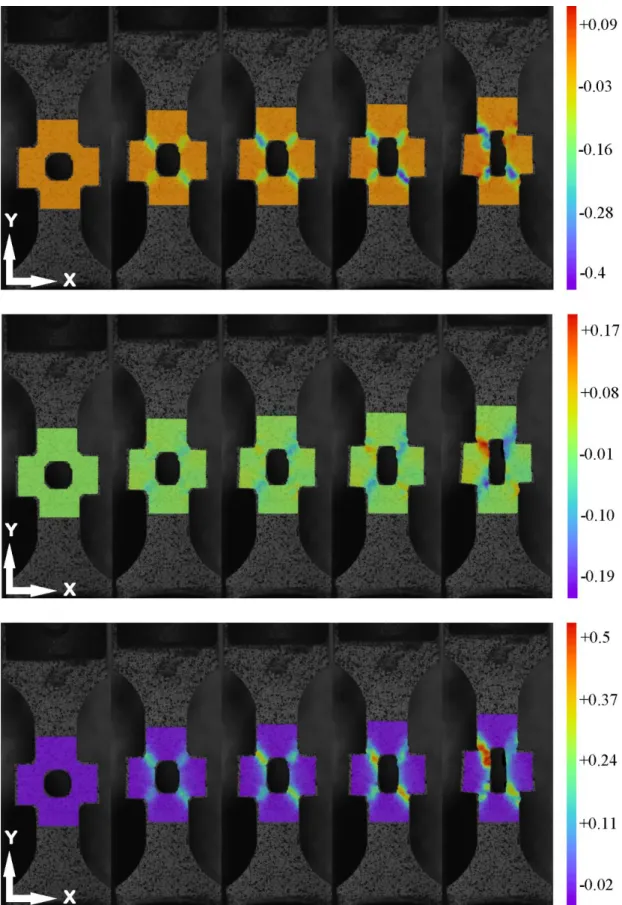
Fig. 6 and Fig. 7 show the full-field strain maps for the investigated FV566 tensile specimens at both 500 ℃ and 600 ℃ test temperatures, selected at different specimen life stages (τ1, τ2, τ3, τ4, τ5). The spatial resolution was set at 20 μm per pixel. The results show a precocious and gradual development of strain localization zones. These zones were clearly visible for all the strain components (longitudinal, εyy, transverse, εxx, and shear, εxy, components). For 500 ℃ condition, at the very beginning of the loading, the spatial heterogeneities were less visible as indicated at τ1. These heterogeneities started to intensify at the following life stages till the macroscopic failure (see Fig. 6). It is worth noting that the painting near the strain concentration zones (where the hole is located) eroded due to the high temperature and large displacement exhibited by the test specimens. This results in inaccurate strain estimate at the last stages before the macroscopic fracture. Note that most of the observed hotspots were located around the specimen hole at the ROI due to the geometry singularity. Nevertheless, the strain field contours show that the strain concentrations were not perfectly symmetric. For the transverse strain, the top-left and the bottom-right sides of the hole were slightly intensive than these on the top-right and the bottom-left sides. However, at the instant τ5, some of strain localization zones were significantly less intensive than others. This is probably caused by inhomogeneous features of the investigated specimen and/or the inaccuracy of the measurements. The spatial distributions of the longitudinal strain component on the top-left side of the hole were more intensive than these on the bottom-right side. From a statistical point of view, the absolute values of both the minimum and maximum longitudinal strain were almost the same at the
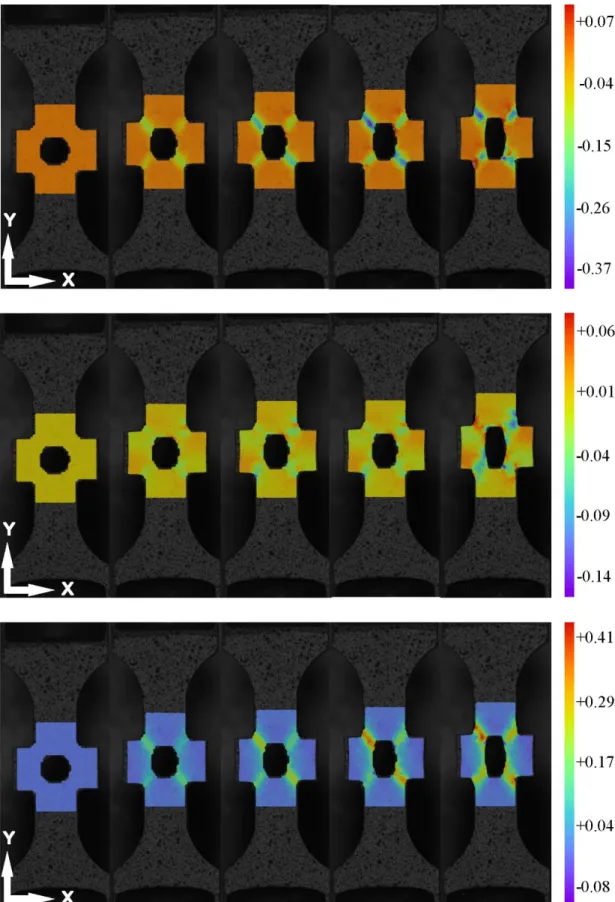
very beginning of the loading, highlighting the homogeneous character of the investigated gauge part. However, with the increase of the load, the absolute value of the minimum longitudinal strain was about thousand-fold lower than the maximum longitudinal strain. For the shear component, the spatial strain concentrations were mostly located on the top-left and top-right sides of the hole. As expected, the localization patterns seemed to progress preferably according to 45° angle (with a shape of “X” letter). At 600 ℃ (see Fig. 7), the strain localizations for the transverse and longitudinal components showed similar patterns as those obtained for the 500 ℃ condition while the higher values of the shear strain were appeared at top-right and bottom-left side with a shape of “/” from where sample fractured finally.
Fig. 6. 2D maps of the transverse strain, εxx (top), shear strain, εxy (middle), and longitudinal strain, εyy (bottom) at: the very beginning of the test (τ1=0s), intermediate times (τ2=810s, τ3=1060s and τ4=1310s) and the last stage before the macroscopic fracture (τ5=1877s). These results were extracted from measurements performed under the 500 °C test temperature.
Fig. 7. 2D maps of the transverse strain, εxx (top), shear strain, εxy (middle), and longitudinal strain, εyy (bottom) at: the very beginning of the test (τ1=0s), intermediate times (τ2=810s, τ3=1060s and τ4=1310s) and the last stage before the macroscopic fracture (τ5=1709s). These results were extracted from measurements performed under the 600 °C test temperature.
Fig. 8 depicts the local spatial profiles of the longitudinal strain component, selected at different life stages (corresponding to different average strain values on the total line) and different location points {𝑃𝑖}𝑖=1,…,10 (see Fig. 5b), from which a strain concentration zone is activated. At the very beginning of the loading, the strain distribution on the selected points was uniform. Then, strain concentrations started to appear for both temperatures when the local maximum strain magnitude reached 0.01. As expected, the local strain magnitude for both P5 and P6 was higher compared to that of the other location points. This is due to the fact that these points (where the peak of strain is occurred) are located close to the regions where the strain heterogeneities are more pronounced. The necking is especially driven by these high strain concentrations as it is highlighted in Fig. 4.
Fig. 8. Spatial-temporal distributions of the longitudinal strain component extracted at the selected
points {𝑃𝑖}𝑖=1,…,10.
3.1.3 Temporal dependent analysis
Selected points {𝑀𝑘}𝑘=1,2 were considered for the time dependent strain analysis (see Fig. 5b). Figs. 9a and b depict the temporal evolution at both 500 ℃ and 600 ℃ test temperatures of the selected longitudinal and transverse strain components, ε𝑥𝑥 and εyy, respectively. It can be seen that at the beginning of the tests, all strain components had very small magnitudes. After 300s, the absolute strain values at M2 started to increase rapidly with time, while those at M1 seemed to slightly evolve throughout the test. Indeed, Fig. 9a shows that the transverse strain curves at both temperatures were almost identical. Fig. 9b shows that the orders of magnitude of the longitudinal component for M1 were smaller compared to those of M2,
which were almost identical to the true principle strains under both test temperatures. This allows to suggest that the longitudinal strain component significantly contributed to the ductile failure of the specimen. The maximum longitudinal strain value at 600 ℃ was around 0.1, while this value reached 0.07 at 500 ℃, highlighting the effect of temperature on the ductile damage evolution of the FV566 steel under investigation.
Fig. 9. (a) True transverse strain curves, and (b) true longitudinal strain curves with respect to the test time at M1 and M2.
3.2 Deformation and fracture characteristics 3.2.1 EBSD microstructural characterization
Two areas from the ruptured surface, close to the DIC time dependent analysis regions (i.e. M1 and M2) were further investigated to highlight the microstructure evolution. Extensive EBSD examination has been conducted and the results are presented in Fig. 10. The inverse pole figure (IPF) images show that the pre-existing martensitic microstructure was significantly distorted along the principal loading direction, accompanied with the formation of a finer martensitic substructure. In addition, the presence of sub-block boundaries at 5 to 6 degrees in the as-received material as well as the variation of sub-block boundaries and the frequency of the low angles boundaries are highlighted in Fig. 11. The findings suggest that the dislocation slip could be the dominant deformation mechanism for the material, since dislocation slip activated by the high temperature and tensile loading may generate a large number of dislocation accumulations, which can contribute to the formation of the low angles boundaries [40]. As is well known, dislocation movement in the crystal is normally arrested by various obstacles (e.g. solid solution atom, forest dislocation, grain boundaries, etc.) during
the tensile deformation process, however the mobile dislocation can slip through the obstacles due to the thermal activation and the applied stress. In the present work, the slip system of the crystal in the FV566 steel was activated under the high temperature conditions, thereby a part of the crystal sliding was relative to the other part, which finally lead to plastic deformation.
Additionally, the grain reference orientation deviation (GROD) parameter was introduced to compare the local crystal deformation in two separate zones of the fractured specimens. It is proven to be linearly related to the nominal plastic strain under both tension and creep condition [41]. The higher value of GROD extracted from the necked zone implies that the plastic deformation in the necked area is larger than that in the uniform zone away from the fracture area, which is consistent with the aforementioned DIC measurement results. As is observed in Fig. 6 and Fig. 7, significant strain concentration was observed around the necked area due to the geometry singularity of the tested specimens. The strain concentrations in the necked area result in the deformation heterogeneity and microstructural rearrangements of the FV566 specimen at high temperature tensile conditions.
Fig. 10. EBSD results of the uniform M1 (left) and necked M2 (right) zones extracted from 600 ℃ test fractured sample.
Fig. 11. The distributions of the misorientation angles across the lath and sub-block boundaries for the
as-received material and uniform/necked zones of fractured sample.
3.2.2 Fracture mechanisms at the strain concentration zone
In Fig. 12a and Fig. 13a, a visible necked area as well as a rough surface can be observed on SEM fractography images of both fractured samples subjected to 500℃ and 600℃ test temperatures, highlighting a large amount of plastic deformation. Zoomed details of other subset areas (namely b, c, d and e in Fig. 12a and Fig.13a) are exhibited in order to deeply investigate the fracture characteristics. A typical dimpled zone and some equiaxed shear dimples surrounded by a shear lip show the typical ductile fracture behavior of the fractured samples at high temperature conditions. The rough surface caused by the large amount of plastic slip during tensile deformation is observable on the plastic deformation path and the micrographs near the shear lip of the sample are also illustrated. Different from the fracture surface of the sample tested at 500 ℃, 600 ℃ tested sample involves a more distinct necking lip on the fracture surface as shown in Fig .13a. Highly correlated to the displacement of ~ 4.2 mm and ~ 5.4 mm for both 500 ℃ and 600 ℃, respectively, see Fig. 4, this fractography observation proves, from micro scale aspect, that the ductile behavior is more pronounced for the specimen tested at higher temperature.
Fig. 12. Scanning electron micrographs of fractured specimens tested at 500 ℃ showing (a) the overall fracture
morphology and (b-e) zoomed details of the local fracture features.
Fig. 13. Scanning electron micrographs of fractured specimens tested at 600℃ showing (a) the overall fracture
morphology and (b-e) zoomed details of the local fracture features.
In view of DIC macro analysis and microstructure characterizations, dislocation slip may be the dominant deformation mechanism of the FV566 steel under tensile loading at high temperature. Furthermore, the fracture analysis reveals that the material exhibited typical ductile fracture characteristics.
3.3 Numerical simulation
To calibrate the feasibility and accuracy of DIC measurement results, the Johnson-Cook model was used to simulate the mechanical behavior of the FV566 specimen at both 500 ℃ and 600 ℃ [42]. The transverse, εxx, and longitudinal, εyy, strain patterns at the local strain
heterogeneities were compared to the DIC results. 3.3.1. Johnson-Cook model
The Johnson-Cook model is available in the ABAQUS/Explicit commercial finite element code [43] and is expressed as
𝜎 = (𝐴 + 𝐵𝜖⏟ 𝑛) (𝐴1) (1 + 𝐶 ln 𝜖̇ 𝜖0̇ ) ⏟ (𝐴2) [1 − (𝑇 − 𝑇𝑡𝑟 𝑇𝑚− 𝑇𝑡𝑟) 𝑚 ] ⏟ (𝐴3) , (3)
where 𝜎 and 𝜖 stand for the Cauchy stress and total strain, respectively. The terms (𝐴1), (𝐴2) and (𝐴3) represent the material strain-hardening dependence, the instantaneous strain-rate sensitivity and the temperature dependence [42], respectively. In order to obtain the material constants of the J-C model, 500 ℃ is taken as the transition temperature, 𝑇𝑡𝑟, and 10−4s-1 as the reference strain rate, 𝜖0̇ . The melting temperature, 𝑇𝑚, of the FV566 steel is set at 1350 ℃. The corresponding J-C material constants of the FV566 steel used in this work are listed in Table 2 [3,44,45].
Table 2: The J-C material parameters of the FV566 steel.
𝑨 [MPa] 𝑩 [MPa] 𝒏 𝑪 𝒎 𝑻𝒎[℃] 𝑻𝒕𝒓 [℃] 𝝐𝟎̇ [s-1]
430 219 0.4 0.001 0.57 1350 500 0.0001
3.3.2. FE model
A quarter of the specimen was considered for the FE analyses as indicated in Fig. 14. The loading pins were modelled by a rigid body while a friction free contact was considered between the pins and the specimen holes. The contact between the pin and the specimen was assumed as standard surface to surface interaction where the outer surface of pin was the master surface and the inner surface of the specimen hole was the slave one. A constant displacement loading was applied in the Y-direction at the pin reference point in order to simulate a similar experimental protocol, for which the magnitude was set at 1.8 mm and 2 mm for both the 500 ℃ and 600 ℃ test temperatures, respectively. The 3D FE model mesh consisted of 4979 C3D8R elements with 8-noded linear brick, reduced integration, and hourglass controlled.
Fig. 14. FE model showing the mesh properties and boundary conditions (UY = 1.8mm for the 500℃ test and UY = 2mm for the 600℃ test) used for comparison with the experimental DIC results. Two symmetry conditions were considered with a sample quarter body modelled.
3.3.3. Comparison with DIC results
Transverse and longitudinal strain patterns of the ROI obtained by DIC measurement and FE analysis are presented and compared in Fig. 15 and Fig. 16. For both 500℃ and 600℃ investigated temperatures, the spatial-temporal strain distributions and magnitudes were found to be in good agreement, revealing that DIC data trends were consistent with the FE simulation results. The strain localization zones for both experimental and FE data were almost identical even on an atypical strain concentrations area. However, an important difference in the strain magnitude was reported for the longitudinal strain component at the last stages of the loading. This difference may be attributed to the error accumulation of the loading rig, inaccuracy of the DIC measurements, inhomogeneous character of the investigated specimens and/or limitations of current FE model. Fig. 17 shows a comparison of the longitudinal strain plots for both DIC and FE analysis on positions extracted from the same line as introduced in Fig. 5b. The FE simulation results show strain magnitudes that were mostly higher than those of the DIC measurements especially for the high strain locations. Although the magnitude differences are not ignorable, it can be inferred that this methodology provides a good quantitative validation of the DIC measurements at high temperature conditions.
Fig. 15. Comparison of the DIC (left) and numerical (right) strain contours at 500℃ test temperature.
Fig. 17. DIC and FEA longitudinal strain profiles on positions extracted from the same line P1 to P10 (see Fig. 5b).
4. Concluding comments
Specimen with a circular hole at the middle of ROI and symmetrical protrusions was designed to facilitate the 2D DIC measurements, so that the stress concentration caused by the hole and protrusions created well-shaped (letter X) regions where strain localization nucleated and propagated. A full-field measuring system based on high temperature DIC approach was successfully applied to track the strain heterogeneities from initial plasticity to fracture, and thus provided some substantial information concerning the localization and hence the inception of ductile failure. To accommodate the heat flux disturbance, an image restoration technique comprised of an image averaging algorithm and an image inverse filter method was employed to repair the degraded images. A blue LED light was also employed to illuminate the sample gauge part with a band pass filter to inhibit the impact of surface radiation at high temperatures. High spatial resolution full field strain maps and accurate local strain values were finally obtained at testing temperature up to 600 °C. The kinematic assessments were analyzed in terms of the mean logarithmic strain components (longitudinal and shear). The overall and local mechanical responses of the test specimens at the regions of interest were also deeply analyzed. At the very beginning of the loading, the spatial heterogeneities were less visible and started to intensify at the following life stages till the macroscopic failure. The speckle near the strain concentration zones (where the specimen holes were located) eroded due to the high temperature and large displacement exhibited by the test specimens. This resulted in inaccurate strain estimate at the last stages before the macroscopic fracture. However, the accurate DIC data for entire test is still challenging due to
the speckle loss, attributed to large deformation and high temperature, mostly during later periods of the tensile in particularly near the time of specimen fracture. Basically, high temperature resistance speckle preparation techniques and heat flow disturbance suppressing methods are most important solutions for the high quality DIC images.
Extensive microstructural examinations using SEM and EBSD, have also been conducted to investigate the microstructure evolution at the necked regions. Results have shown that the pre-existing martensitic microstructure was significantly distorted along the principal loading direction near the necked region, accompanied with the formation of a finer martensitic substructure. A large number of the boundaries with lower angles can be observed in the necking area of the sample, due to the large plastic deformation near the necking zone. The observation comprising of structure refinement and microstructure modification are highly correlated with the plastic deformation behaviour; dislocation slip may be the dominant deformation mechanism of the FV566 steel at high temperature. Fractography together with DIC results revealed the temperature effect on the FV566 tensile process; the necking lip observed on the fracture surface of 600 ℃ specimen was much more apparent than that of 500 ℃.
Finite element analyses based on the Johnson-Cook model were performed and comparisons between both measurement and simulation results were finally discussed. For both 500 ℃ and 600 ℃ investigated temperatures, the spatial-temporal strain distributions and magnitudes were found to be in good agreement, revealing that DIC data trends were consistent with the FE simulation results. The strain localization zones for both experimental and FE data were almost identical even on an atypical strain concentrations area. However, an important difference in the strain magnitude was reported for the longitudinal strain component at the last stages of the loading.
5. Acknowledgement
Mr. Jianguang Bao, Prof. Wei Sun and Dr. Adil Benaarbia gratefully acknowledge The Aviation Industry Corporation of China and China Scholarship Council for the sponsorship of the PhD for Jianguang Bao.
The raw/processed data required to reproduce these findings cannot be shared at this time as the data also forms part of an ongoing study.
7. References
[1] A. Turnbull, S. Zhou, Comparative evaluation of environment induced cracking of conventional and advanced steam turbine blade steels. Part 1: Stress corrosion cracking, Corros. Sci. 52 (2010) 2936–2944. https://doi.org/10.1016/j.corsci.2010.05.005.
[2] G. Williams, H.N. McMurray, Pitting corrosion of steam turbine blading steels: The influence of chromium content, temperature, and chloride ion concentration, Corrosion. 62 (2006) 231–242. https://doi.org/10.5006/1.3278269.
[3] Y. Rae, A. Benaarbia, J. Hughes, W. Sun, Experimental characterisation and computational modelling of cyclic viscoplastic behaviour of turbine steel, Int. J. Fatigue. 124 (2019) 581–594. https://doi.org/10.1016/j.ijfatigue.2019.01.022.
[4] C.J. Smithells, Metals reference book, Elsevier, 2013.
[5] M.O. Speidel, R.M. Magdowski, Stress corrosion cracking of steam turbine steels—an overview, in: Proc. 2nd Int. Symp. Environ. Degrad. Mater. Nucl. Power Syst. React. D. Cubicciotti, Chair (La Grange Park. Am. Nucl. Soc. 1985), 1985: p. 267.
[6] J. Denk, Low pressure steam turbine integrity, Proc. Mater. Adv. Power Eng. Liege, Belgium. (1994) 157–170.
[7] F.F. Lyle Jr, Stress corrosion cracking in low-pressure steam turbines--An overview, in: Corros. Conf. Pap., 1994.
[8] S. Chakravarty, L.I. V Tirabasso, P.C. Patnaik, Improvement of Fatigue and Corrosion Resistance of Compressor Rotor Blades of an Industrial Gas Turbine Engine, Adv. Mater. Coatings Combust. Turbines. (1993) 135–143.
[9] M.A. Sutton, W.J. Wolters, W.H. Peters, W.F. Ranson, S.R. McNeill, Determination of displacements using an improved digital correlation method, Image Vis. Comput. 1 (1983) 133– 139.
[10] T.C. Chu, W.F. Ranson, M.A. Sutton, Applications of digital-image-correlation techniques to experimental mechanics, Exp. Mech. 25 (1985) 232–244.
[11] J.S. Lyons, J. Liu, M.A. Sutton, High-temperature deformation measurements using digital-image correlation, Exp. Mech. 36 (1996) 64–70.
[12] T. Niendorf, C. Burs, D. Canadinc, H.J. Maier, Early detection of crack initiation sites in TiAl alloys during low-cycle fatigue at high temperatures utilizing digital image correlation, Int. J. Mater. Res. 100 (2009) 603–608.
[13] J.T. Hammer, J.D. Seidt, A. Gilat, Strain measurement at temperatures up to 800 C utilizing digital image correlation, in: Adv. Opt. Methods Exp. Mech. Vol. 3, Springer, 2014: pp. 167–170.
[14] J.L. Turner, S.S. Russell, Application of digital image analysis to strain measurement at elevated temperature, Strain. 26 (1990) 55–59.
[15] X. Chen, N. Xu, L. Yang, D. Xiang, High temperature displacement and strain measurement using a monochromatic light illuminated stereo digital image correlation system, Meas. Sci. Technol. 23 (2012) 125603.
[16] B. Vieille, J. Aucher, L. Taleb, Overstress accommodation in notched woven-ply thermoplastic laminates at high-temperature: Numerical modeling and validation by Digital Image Correlation, Compos. Part B Eng. 45 (2013) 290–302. https://doi.org/10.1016/j.compositesb.2012.06.015. [17] A.I. Botean, Thermal expansion coefficient determination of polylactic acid using digital image
correlation, E3S Web Conf. 32 (2018). https://doi.org/10.1051/e3sconf/20183201007.
[18] N.J. Karanjgaokar, C.S. Oh, I. Chasiotis, Microscale Experiments at Elevated Temperatures
Evaluated with Digital Image Correlation, Exp. Mech. 51 (2011) 609–618.
https://doi.org/10.1007/s11340-010-9439-y.
[19] M. De Strycker, L. Schueremans, W. Van Paepegem, D. Debruyne, Measuring the thermal expansion coefficient of tubular steel specimens with digital image correlation techniques, Opt. Lasers Eng. 48 (2010) 978–986. https://doi.org/10.1016/j.optlaseng.2010.05.008.
[20] P. Meyer, A.M. Waas, Measurement of In Situ-Full-Field Strain Maps on Ceramic Matrix Composites at Elevated Temperature Using Digital Image Correlation, Exp. Mech. 55 (2015) 795– 802. https://doi.org/10.1007/s11340-014-9979-7.
[21] B.M.B. Grant, H.J. Stone, P.J. Withers, M. Preuss, High-temperature strain field measurement using digital image correlation, J. Strain Anal. Eng. Des. 44 (2009) 263–271. https://doi.org/10.1243/03093247JSA478.
[22] M.D. Novak, F.W. Zok, High-temperature materials testing with full-field strain measurement: experimental design and practice, Rev. Sci. Instrum. 82 (2011) 115101.
[23] B. Pan, D. Wu, Z. Wang, Y. Xia, High-temperature digital image correlation method for full-field deformation measurement at 1200 C, Meas. Sci. Technol. 22 (2010) 15701.
[24] W. Wang, C. Xu, H. Jin, S. Meng, Y. Zhang, W. Xie, Measurement of high temperature full-field strain up to 2000 °c using digital image correlation, Meas. Sci. Technol. 28 (2017) aa56d1. https://doi.org/10.1088/1361-6501/aa56d1.
[25] X. Guo, J. Liang, Z. Tang, B. Cao, M. Yu, High-temperature digital image correlation method for full-field deformation measurement captured with filters at 2600 C using spraying to form speckle patterns, Opt. Eng. 53 (2014) 63101.
[26] R.B. Berke, J. Lambros, Ultraviolet digital image correlation (UV-DIC) for high temperature applications, Rev. Sci. Instrum. 85 (2014). https://doi.org/10.1063/1.4871991.
[27] M.J. Holzweissig, P. Kanagarajah, H.J. Maier, Digital image correlation at high temperatures for fatigue and phase transformation studies, J. Strain Anal. Eng. Des. 49 (2014) 204–211. https://doi.org/10.1177/0309324713498737.
[28] C. Bumgardner, B. Croom, X. Li, High-temperature delamination mechanisms of thermal barrier coatings: In-situ digital image correlation and finite element analyses, Acta Mater. 128 (2017) 54– 63. https://doi.org/10.1016/j.actamat.2017.01.061.
[29] P. Leplay, J. Réthoré, S. Meille, M.C. Baietto, Identification of asymmetric constitutive laws at high temperature based on Digital Image Correlation, J. Eur. Ceram. Soc. 32 (2012) 3949–3958. https://doi.org/10.1016/j.jeurceramsoc.2012.03.024.
[30] B. Swaminathan, J. Lambros, H. Sehitoglu, Digital image correlation study of mechanical response of nickel superalloy Hastelloy X under thermal and mechanical cycling: Uniaxial and biaxial stress states, J. Strain Anal. Eng. Des. 49 (2014) 233–243.
[31] B. Swaminathan, W. Abuzaid, H. Sehitoglu, J. Lambros, Investigation using digital image correlation of Portevin-Le Chatelier Effect in Hastelloy X under thermo-mechanical loading, Int. J. Plast. 64 (2014) 177–192. https://doi.org/10.1016/j.ijplas.2014.09.001.
[32] M. Eskandari, M.R. Yadegari-Dehnavi, A. Zarei-Hanzaki, M.A. Mohtadi-Bonab, R. Basu, J.A. Szpunar, In-situ strain localization analysis in low density transformation-twinning induced plasticity steel using digital image correlation, Opt. Lasers Eng. 67 (2015) 1–16. https://doi.org/10.1016/j.optlaseng.2014.10.005.
[33] Y. Rae, X. Guo, A. Benaarbia, N. Neate, W. Sun, On the microstructural evolution in 12% Cr turbine steel during low cycle fatigue at elevated temperature, Mater. Sci. Eng. A. (2019) 138864. [34] N. Seumangal, Influence of the heat treatment procedure on the stress corrosion cracking
behaviour of low pressure turbine blade material FV566, (2017).
[35] H. Kitahara, R. Ueji, N. Tsuji, Y. Minamino, Crystallographic features of lath martensite in low-carbon steel, Acta Mater. 54 (2006) 1279–1288. https://doi.org/10.1016/j.actamat.2005.11.001. [36] T. Szymczak, Investigations of material behaviour under monotonic tension using a Digital Image
Correlation system, J. Theor. Appl. Mech. 56 (2018) 857–871.
[37] Y. Hu, S. Bao, X. Dan, A. Huang, Y. Wang, Improvement of high-temperature deformation measurement accuracy based on image restoration method, Meas. Sci. Technol. 29 (2018) aacd72. https://doi.org/10.1088/1361-6501/aacd72.
[38] P. Mazzoleni, E. Zappa, F. Matta, M.A. Sutton, Thermo-mechanical toner transfer for high-quality digital image correlation speckle patterns, Opt. Lasers Eng. 75 (n.d.) 72–80.
https://doi.org/10.1016/j.optlaseng.2015.06.009.
[39] E. Gariboldi, K. Naumenko, O. Ozhoga-Maslovskaja, E. Zappa, Analysis of anisotropic damage in forged Al–Cu–Mg–Si alloy based on creep tests, micrographs of fractured specimen and digital image correlations, Mater. Sci. Eng. A. 652 (2016) 175–185.
[40] X. Huang, S. Morito, N. Hansen, T. Maki, Ultrafine structure and high strength in cold-rolled martensite, Metall. Mater. Trans. A Phys. Metall. Mater. Sci. 43 (2012) 3517–3531. https://doi.org/10.1007/s11661-012-1275-5.
[41] S.S. Rui, Y.B. Shang, Y.N. Fan, Q.N. Han, L.S. Niu, H.J. Shi, K. Hashimoto, N. Komai, EBSD analysis of creep deformation induced grain lattice distortion: A new method for creep damage evaluation
of austenitic stainless steels, Mater. Sci. Eng. A. 733 (2018) 329–337.
https://doi.org/10.1016/j.msea.2018.07.058.
[42] G.R. Johnson, A constitutive model and data for materials subjected to large strains, high strain rates, and high temperatures, Proc. 7th Inf. Sympo. Ballist. (1983) 541–547.
[43] D.S. SIMULIA, Abaqus 2018, Doc. Dassault Systèmes, Rhode Isl. (2018).
[44] Y.C. Lin, X.M. Chen, G. Liu, A modified Johnson-Cook model for tensile behaviors of typical
high-strength alloy steel, Mater. Sci. Eng. A. 527 (2010) 6980–6986.
https://doi.org/10.1016/j.msea.2010.07.061.
[45] A. Banerjee, S. Dhar, S. Acharyya, D. Datta, N. Nayak, Determination of Johnson cook material and failure model constants and numerical modelling of Charpy impact test of armour steel, Mater. Sci. Eng. A. 640 (2015) 200–209. https://doi.org/10.1016/j.msea.2015.05.073.