HAL Id: hal-02483968
https://hal.archives-ouvertes.fr/hal-02483968
Submitted on 19 Mar 2020HAL is a multi-disciplinary open access
archive for the deposit and dissemination of sci-entific research documents, whether they are pub-lished or not. The documents may come from teaching and research institutions in France or abroad, or from public or private research centers.
L’archive ouverte pluridisciplinaire HAL, est destinée au dépôt et à la diffusion de documents scientifiques de niveau recherche, publiés ou non, émanant des établissements d’enseignement et de recherche français ou étrangers, des laboratoires publics ou privés.
Role of Cations in the Methane/Carbon Dioxide
Partitioning in Nano- and Mesopores of Illite Using
Constant Reservoir Composition Molecular Dynamics
Simulation
Narasimhan Loganathan, A. Ozgur Yazaydin, Geoffrey M. Bowers, Brice F.
Ngouana-Wakou, Andrey G. Kalinichev, R. James Kirkpatrick
To cite this version:
Narasimhan Loganathan, A. Ozgur Yazaydin, Geoffrey M. Bowers, Brice F. Ngouana-Wakou, An-drey G. Kalinichev, et al.. Role of Cations in the Methane/Carbon Dioxide Partitioning in Nano-and Mesopores of Illite Using Constant Reservoir Composition Molecular Dynamics Simulation. J.Phys.Chem.C, 2020, 124 (4), pp.2490-2500. �10.1021/acs.jpcc.9b10051�. �hal-02483968�
Role of Cations in the Methane/Carbon Dioxide Partitioning in
Nano- and Mesopores of Illite Using Constant Reservoir
Composition Molecular Dynamics Simulation
Narasimhan Loganathan,
*
A. Ozgur Yazaydin, Geoffrey M. Bowers, Brice F. Ngouana-Wakou,
Andrey G. Kalinichev, and R. James Kirkpatrick
ABSTRACT: We performed constant reservoir composition molecular dynamics (CRC-MD) simulations at 323 K and 124 bar to quantitatively study the partitioning of fluid species between the nano- and mesopores of clay and a bulk reservoir containing an equimolar mixture of CO2and
CH4. The results show that the basal (001) and protonated edge (010)
surfaces of illite both demonstrate a strong preference for CO2over CH4
adsorption; that the (001) surfaces show a stronger preference for CO2
than the (010) surfaces, especially with K+ as the exchangeable cation;
and that the structuring of the near-surface CO2by K+ is stronger than
that by Na+. The protonated (010) surfaces have a somewhat greater
preference for CH4, with the concentration near them close to that in the bulk fluid. The effects of the surfaces on the fluid
composition extend to approximately 2.0 nm from them, with the fluid composition at the center of the pore becoming essentially the same as the bulk composition at a pore thickness of ∼5.7 nm. The preference of nano- and mesopores bounded by clay minerals for CO2over CH4suggests that injection of CO2into tight reservoirs is likely to displace CH4into larger pores, thus enhancing its
production.
INTRODUCTION
Natural gas produced from shale and other tight reservoirs is one of the most important resources for addressing increasing global energy demand, and the injection of carbon dioxide into these reservoirs has significant potential to enhance oil and gas recovery and also to facilitate geological carbon sequestra-tion.1−4Clay minerals are important components of shales and other tight formations,5,6and because the pores in these rocks are so small, interaction of the pore fluids (e.g., H2O, CO2, and
CH4) with clay surfaces plays an important role in controlling
the structural environments of fluid species, their partitioning between pores of different sizes, and their transport proper-ties.7,8 The behavior of water and cations at mineral surfaces
and in the nanoscale interlayer galleries of swelling clays has been extensively studied experimentally and by computational molecular simulations,9−20and in recent years, there has been increasing focus on the partitioning of CO2 and H2O into
expandable clay interlayers and how factors like mineral composition, cation size and charge, and the saturation state of the fluid phase impact the partitioning characteristics.21−41 Mixed CO2/CH4fluids are of significant potential importance,
especially near injection wells, but little is known about their mutual behavior in the nano- and mesopores in shales and other tight formations. Most studies that address CO2 and
CH4 interactions are focused on their single-component
adsorption in the interlayers of expandable clay minerals
(smectites), which show a strong preferential adsorption of CO2over CH4.42−45
There are only a handful of studies investigating CO2 and
CH4 with the surfaces of other minerals,46−48 including the
nonexpandable, high-charge clay mineral illite,8,49 which is a very common component of shales. As for smectites, most studies of illite have focused on the adsorption of single-component fluids species, with the results again demonstrating stronger preference of the basal surfaces for CO2 relative to
CH4.46−50 Grand canonical Monte Carlo (GCMC)
simu-lations of Zhang et al.47 showed that the interaction between K+on the basal surface and CO
2plays an important role in the
adsorption of CO2 and that the strength of this interaction
decreases with increasing pressure. Similar GCMC studies by Chen et al.46 suggested that the quadrupole moment of the CO2molecules could contribute to their interaction with the
oxygen atoms of the basal surfaces of illite. Gibbs ensemble Monte Carlo (GEMC) simulations of mixed CO2/CH4fluids
interacting with illite basal surfaces by Chong et al.48showed that CO2 strongly interacts with the surface, that the CO2
adsorption increases with decreasing CH4content in the bulk
fluid, and that the surface sorption increases linearly at low pressures (<20 MPa) but reaches a plateau at higher pressures. A recent experimental sorption study by Hwang et al.50 also shows stronger interaction between illite and other clay minerals with CO2than with CH4at 50 °C and pressures up
to 30 MPa. To our knowledge, neither there have been any studies of the impact of pore thickness (distance between the average positions of the centers of basal surface oxygen atoms forming the pore, as shown inFigure 1) and different surface cations on the interaction of CO2and CH4with illite,42−50nor
have there been any systematic studies of the protonated surfaces of the T−O−T layer broken edge sites, which can contribute significantly to the total surface area of shales. However, recent experiments of Wan et al.49allowed them to hypothesize that the frayed edges of nonswelling clays may be responsible for the unexpectedly high CO2 uptake by such
clays.
We recently investigated the effect of pore thickness and edge site vs basal surface on the CO2/CH4partitioning and the
fluid structure on finite-sized Na-montmorillonite surfaces using constant reservoir composition molecular dynamics (CRC-MD) simulations.51 The results showed that CO2
adsorption dominates at both the basal and broken edge surfaces and that the CO2/CH4 ratio in the pore fluid
approaches the bulk value with increasing distance from the surface. In this paper, we present the results of CRC-MD simulations of the partitioning and structural environments of CO2and CH4in nano- and mesopores of illite with K+or Na+
as surface charge-compensating ions, quantifying also the differences in the near-surface structure between basal and broken edge surfaces. The results show that the partitioning of CO2 and CH4 between the bulk fluid (representative of the
composition in large interparticle pores) and the nano- and mesopores is greatly influenced by the pore thickness and the nature of the charge-balancing cations. Irrespective of the
cation, the basal and broken edge surfaces show a stronger preference for CO2 relative to CH4, and the preference is
substantially greater than for Na-montmorillonite.51
The main objective of our study is to understand the influence of the exchangeable cation on determining the partitioning of supercritical CO2 and CH4 in nano- and
mesoconfined pores of the common clay mineral illite. A series of CRC-MD simulation were performed with an equimolar mixture of CO2/CH4 at 323 K and 124 bar to address the
partitioning behavior using illite particles with the pore thickness ranging from 0.3 to 7.6 nm. In the following section, we introduce the CRC-MD technique, describe how the simulation cell and finite-sized illite particle are constructed, and then describe the simulation details used to carry out this study. In the Results and Discussion section, we present the partitioning of CO2and CH4 fluids with the increasing pore
thickness, discuss their structure, coordination with the exchangeable cations, and their orientation near the pore surfaces. In addition, the effect of broken edge sites in altering the adsorption structure of the fluid species is also investigated. The key important outcomes are summarized in the
Conclusionssection.
METHODS
CRC-MD is a novel molecular modeling technique that maintains a constant composition of the fluid in designated volumes external to the pore (Figure 1) by applying self-adjusting bias forces. This method has been used previously to maintain constant chemical potentials of the fluid species in modeling growth of urea crystals52,53 and to create a concentration gradient across a membrane (concentration gradient driven MD) for modeling gas separation and transport of mixed fluid species.54 We have previously discussed the advantages of CRC-MD over hybrid MC/MD approaches, such as dual control volume grand canonical molecular dynamics, in maintaining constant external fluid composition Figure 1.Schematic representation of the simulation cells used in the constant reservoir composition molecular dynamics (CRC-MD) calculations used here to study CO2/CH4partitioning into pores bounded by illite basal surfaces. (a) The full simulation cell showing the different regions of the models. (b) Enlarged image of the silt-like pore and finite-sized illite T−O−T layers. Color code: Siyellow; Ored; Alpink; Hwhite; cations (K+/Na+)blue; C
CO2cyan; CCH4black. Substrate atoms are represented by sticks and the CO2and CH4molecules and metal ions are represented by balls. Pink arrows represent the bias forces used to control the fluid composition in the control regions. The directions of X- and Z-axes are indicated by the arrows in the lower left.
and for modeling dense fluids in which Monte Carlo exchanges are difficult.54,55 Here, each simulation cell is composed of a bulk fluid reservoir, two bias force regions, two composition control regions, two transition regions, and the illite + pore assemblage in the center (Figure 1). The concentration of the fluid species in the control regions is maintained at target values by forces in the bias force regions. These bias forces act in such a way that if the instantaneous concentration of a given species in a control region is different from the target concentration, then molecules are moved from the control region to the reservoir or moved into the control region from it. A detailed explanation of the functional forms of the bias forces and how they work can be found in the Supporting Information and elsewhere.52,54 Our simulations used finite-sized illite particles with the pore thickness between 0.3 and 7.6 nm that were placed between the two external reservoirs with an equimolar CO2/CH4 ratio (Figure 1). The pore
thickness is defined as the distance between the average positions of the centers of basal surface oxygen atoms confining the pore (Figure 1b). The reservoir regions contain equimolar mixtures of CO2and CH4. Thus, both the basal and
protonated broken edge surfaces were investigated simulta-neously. Surfaces with both K+ and Na+ were modeled to
investigate the effect of CO2 solvation energy of the
charge-balancing cation on the fluid behavior. Illite has K+as its most
abundant interlayer cation, but it is possible that other cations could exchange onto external surface sites, especially if the fluid is a NaCl-rich brine.56,57 The pore dimensions used in our study represent those of interparticle pores between finite-sized illite particles. The interparticle pores can vary from few nanometers to a few hundreds of nanometers, depending upon the arrangement of clay particles.58 Based on our previous studies with montmorillonite,51the largest pore thickness (7.6 nm) used in our study is sufficient to depict both the near-surface structure and the fluid structure and composition far from the surface.
The finite-sized illite particle is based on ideal muscovite with the total structural charge reduced 20% by including less tetrahedral Al3+ for Si4+ substitution. Illite develops its
permanent negative structural charge principally by isomorphic substitution of Al3+ for Si4+ in the tetrahedral sheet. The
structural formula of our model illite is M1.6+(Si6.4Al1.6)(Al4
)-O20(OH)4.59The distribution of the Al3+ for Si4+ isomorphic
substitution has a quasi-disordered pattern that is in accordance with Lowenstein’s rule, which forbids tetrahedral Al−O−Al linkages.60 The simulated illite particle has finite lateral dimensions of ∼7.30 nm × 4.14 nm along the crystallographic a and b axes, with an orthorhombic unit cell. To construct the finite-sized particle, the illite structure was cleaved along (010), creating broken edge sites on that surface. The dangling bonds of the tetrahedral Al3+and Si4+sites on the
broken edges were then saturated with single OH− groups,
whereas the dangling octahedral Al3+sites were saturated with
one OH−group and one H
2O molecule, resulting in a
charge-neutral edge surface. This illite particle has one (010) surface exposing some tetrahedral Al3+sites and one that exposes only
tetrahedral Si4+ sites. Further details about the edge site
structures can be found elsewhere.51
The illite particle is composed of three T−O−T layers and two anhydrous interlayers. It exposes two external basal (001) surfaces to the pore. The total simulated model including the volumes occupied by the fluid has lateral dimensions of 30.0 nm × 4.14 nm (Figure 1). Because of the three-dimensional
periodic boundary conditions employed, only the broken (010) edge surface plane and the basal surfaces bounding the pore are exposed to the fluid. The pore thickness between the external basal surfaces was varied from 0.3 to 7.6 nm. For models with the pore thickness less than 1.0 nm, the charge-compensating cations were placed initially at the midplane of the pores. At larger pore thicknesses, these ions were placed 0.5 nm from each external basal surface, thereby allowing the cations to choose their preferred adsorption sites during the simulation run. The fluid molecules (CO2 and CH4) were
initially placed external to the illite particle at distances >∼3.0 nm from the two broken (010) surfaces. The total number of fluid molecules in the entire simulation cell increases with the increasing pore thickness to maintain the desired target densities in the control region. The nonswelling illite interlayers contain only K+ions.
The partitioning of CO2/CH4and density profiles for each
species near the particle surfaces are analyzed in three different dimensions: (i) normal to the basal (001) surfaces bounding the pore (z-direction); (ii) parallel to the broken edges in the transition regions (along the z-direction); (iii) normal to the broken (010) edges in the transition region (along the x-direction). Similarly, the nominal location of the (010) surfaces is defined as the plane containing the time-averaged positions of the centers of the protonated oxygen atoms on the surface. The orientation of the CO2molecules and the nearest
neighbor coordination among different species on the basal surfaces are analyzed with radial distribution functions (RDFs) and probability density plots. In addition, the total fluid density in the pores confined by basal (001) surfaces is calculated for all pore thickness. In addition, we also calculate the total fluid density which corresponds to the average total number of fluid species (CO2+ CH4) over volume within the illite pore region.
Note, the volume of finite-sized illite pore region is computed by considering the average positions of the centers of basal (001) surface oxygen atoms bounding the pore in z-direction and time-averaged positions of the protonated oxygen atoms on either side of the particle as the lateral boundary limit along x-direction (∼7.3 nm), in contrast to actual simulated cell dimensions along y-direction (4.14 nm). Further details about the analysis methods are described elsewhere.34−36,41,51
Molecular dynamics simulations in the canonical NVT ensemble at 323 K were performed using the LAMMPS simulation package.61A Nosé−Hoover thermostat was used to
control the temperature.62The interatomic interactions for the illite were obtained from the ClayFF force field,63 and the parameters for the broken edge sites were obtained from newly developed metal−O−H bending potentials consistent with ClayFF.64,65 The EPM266 and TraPPE-UA67 interaction potentials were used to represent the CO2and CH4molecules,
respectively. More details about the interaction potentials can be found in the Supporting Information. Three-dimensional periodic boundary conditions were employed. A cutoff of 1.40 nm was used to compute short-range non-electrostatic interactions, and the long-range electrostatic interactions were computed using the particle−particle−particle−mesh (PPPM) summation algorithm with an accuracy of 10−6.68 A
time step of 1 fs was used to integrate the equations of motion. Each system was initially equilibrated for 15 ns, followed by another 2 ns of data production with the atomic coordinates recorded every 10 fs. Importantly, the movement of the clay layers with respect to each other was restricted by fixing the
positions of 18 octahedral Al3+ atoms in the simulated illite
structure (six per each TOT layer).
A modified version of the PLUMED 2.3.0 plugin was used to apply the bias forces to maintain the fluid composition in the control regions.69 The target CO2 and CH4 densities in the
control regions were set to two CO2and two CH4molecules/
nm3. At the simulated temperature of 323 K, the reference
target densities of fluid species in the control regions correspond to a total fluid pressure of 124 bar, based on the Peng−Robinson equation of state.70 These temperature and pressure conditions are relevant to the upper part of the earth’s crust and petroleum reservoirs. The width of the transition regions, control regions, and the bias force regions were set to 3.0, 3.0 and 0.30 nm, respectively. The target compositions of the fluid species, i, in the control regions were maintained using the force constants kiL= kiR= 5000 kJ nm3/mol, which
are placed at the center of the bias force regions. The compositions in the control regions were monitored at intervals of 0.5 ps during the entire simulation. This procedure maintained the desired composition in the control regions very well (Figure S1).
RESULTS AND DISCUSSION
Pores Bounded by Basal Surfaces. The mole fraction and number densities of CO2and CH4molecules in the pores
bounded by the basal (001) surfaces vary greatly with pore thickness (Figure 2a,b). For both the K- and Na-surfaces, the total fluid density +
(
N)
volume of illite pore region
(CO2 CH4) increases rapidly
from a pore thickness of ∼0.4 nm, reaches a plateau at pore thickness between 1.0 and 1.5 nm, and then decreases with increasing pore thickness. There is a second plateau between 2.5 and 3.5 nm in the mole fractions for both models. With both cations, at pore thickness less than 1.0 nm CO2saturates
the pore, and there is a negligible amount of CH4. The CH4
molecules that do appear in the pore are concentrated predominantly at the pore openings of the finite illite particle. The CO2/CH4 ratio does not depend significantly on the
exchangeable cation, decreases with increasing pore thickness, and slowly approaches but does not reach the bulk ratio of 2.0 molecules/nm3even at a pore thickness of 7.6 nm. The large
CO2/CH4ratio and its decrease with increasing pore thickness
are in good agreement with previous simulations that indicate a favorable energetic interaction of CO2molecules but not for
CH4 molecules with the basal surfaces of illite,46 and also
parallel the behavior of these species in pores bounded by the smectite clay montmorillonite.51
With surface Na+, the results here show that significant CH 4
content occurs at 0.75 nm pore thickness and that its mole fraction increases almost linearly until the first plateau region starting at pore thickness of 1.26 nm is reached. In contrast, with surface K+, significant amounts of CH
4do not occur until
a pore thickness of 1.0 nm. As a result, the CO2/CH4ratio
with K+is approximately twice that with Na+at a 1.0 nm pore
thickness. At pore thickness >1.0 nm, the CH4content with K+
increases gradually, reaches a plateau, and approaches the value with Na+at a pore thickness of 2.2 nm. The number density of
CO2molecules is greater in the illite-bounded pore than in the
control region at all pore thicknesses studied, with maximum values of 9.0 and 10.0 at a 1.0 nm pore thickness with K+and
Na+, respectively (Figure 2b). At larger pore thickness (z > 2.5
nm), the number density of CO2 decreases significantly, in
contrast to CH4which does not change much. Unlike CO2, the
number density of CH4 never surpasses the value of 2
molecules/nm3in the control region.
These results are in good agreement with previous GCMC simulation studies of K-illite in contact with pure CO2or pure
CH4 at similar thermodynamic conditions46,47 and are
probably due to the favorable K+
−CO2 solvation energies.71
These observed changes strongly suggest that pores with thicknesses of one to a few nanometers bounded by clay surfaces have a significant preference for adsorption of CO2
relative to CH4, with the greatest preference exhibited by
nano-pores (<1 nm). Our results are also consistent with adsorption energetics and gas sorption studies that show the clay minerals prefer CO2 over CH4 under anhydrous conditions.50
Importantly, our results demonstrate that the exchangeable surface cations affect CO2/CH4partitioning only up to pore
thickness of few nanometers (∼4).
The probability density profiles (PDPs) of CO2 and CH4
normal to the (001) illite surfaces show that the structuring of the fluid species near the pore surfaces is greatly different from K+ compared to Na+ as the charge-balancing surface cation
(Figures 3 and S2). With K+, the PDPs of CO
2 show three
discernable layers extending up to ∼1.8 nm from the basal surfaces along with a shoulder near 0.4 nm. With Na+there are
only three distinguishable layers. With both K+ and Na+, the
PDPs of CH4show three layers extending up to 1.5 nm from
the surface. At larger pore thicknesses, the CO2/CH4ratios are
large near the surface, gradually decrease with increasing distance from the surface, and reach the composition of the control volume at about 2.2 nm away from the surface. With Figure 2.(a) Computed mole fractions of CO2and CH4molecules
and the CO2/CH4ratios with K+and Na+as the exchangeable cation on the pore surfaces as functions of pore thickness for pores bounded by (001) surfaces. (b) Number density of the fluid species confined within these pores as functions of pore thickness.
K+ at a pore thickness of 0.78 nm, there is a broad peak for
CO2and a poorly resolved CH4maximum near the middle of
the pore (Figure 3). In contrast, with Na+, there are
well-defined peaks for CO2 near each pore surface, a well-defined
peak in the center of the pore, and a CH4 density maximum
near the center of the pore that is broader than with K+(Figure 3). At a pore thickness of 0.94 nm, there are well-defined first layers of CO2and CH4 molecules at about 0.3 nm from the
surfaces with both K+ and Na+, but the CH
4 density is
substantially smaller with K+than with Na+. In addition, there
is a well-defined peak for CO2in the center of the pore with
K+, but not Na+. At 1.09 nm, CO
2molecules form two layers at
each surface with both K+and Na+, but the second peak with
Na+ near 0.4 nm is a less well-resolved shoulder. CH 4forms
layers about 0.35−0.38 nm from the surfaces for both compositions, with those of the Na+ system being better
resolved. At a pore thickness of 1.24 nm, a third peak for CO2
and a second peak for CH4near 0.63 nm begin to form the
center of the pore. Importantly, the intensity of the second CH4peak is greater than that of the first peak with both K+and
Na+. At 1.56 nm there are three peaks or shoulders for CO 2
and two peaks for CH4for both K+ and Na+ systems.
At pore thicknesses between 1.56 and 2.65 nm, in addition to these peaks, with both K+and Na+on the surface, there are
the same near-surface peaks as at smaller pore thicknesses along with a flat distribution for both fluid species in the center of the pores. The CH4density in the pore center is very similar
to that in the control region, whereas the CO2 densities are
much greater. At pore thickness >2.65 nm with K+, there is a
significant change in the structuring of the CO2molecules, but
not the CH4molecules, near the pore surfaces (Figures 3and S2). The second peak of CO2becomes a shoulder on the peak
nearest the surface, most likely due to redistribution of CO2
between the near-surface layers. In addition, the CO2densities
in the middle of the pore gradually decrease towards the composition in the control volume. With both K+and Na+as
the charge-balancing surface cation, by 5.70 nm the fluid structuring near the surfaces does not change with further increasing pore thickness, and the CH4and CO2densities are
essentially the same in the center of the pore. At the largest pore thickness studied (7.68 nm), with both K+ and Na+ the
CO2peak maxima are at 0.3, 0.67 and 1.03 nm from the pore
surfaces and there is a shoulder at 0.45 nm only with K+. In
contrast, the peak maxima for CH4occur at 0.33 and 0.65 nm
with both K+ and Na+as surface cations, but the intensity of
the CH4peak at 0.33 nm is substantially lower with K+ than
with Na+. The CH4and CO2concentrations in the centers of
the pores are very close to the composition in the control volume (2 molecules/nm3). The CO
2and CH4PDPs with K+
here are substantially different than those for an equimolar CH4/CO2ratio in the GEMC studies of Chong et al.,48mostly
likely due to their use of cation substitution on the octahedral sites, which is not commonly found in natural illites, in contrast to the tetrahedral substitutions used in our work. Their models also had a lower structural charge than ours. Similarly, we attribute the difference in the PDPs of the first layer CH4 with Na+ here compared to Na-montmorillonite
under the same thermodynamic conditions and fluid composition to the lower structural charge and the octahedral substitution in the montmorillonite.51
Irrespective of the exchangeable surface cation, the differ-ences in the structuring of CO2and CH4near the pore surfaces
in our simulations are due to differences in their interaction Figure 3. Computed probability density profiles (PDPs) of metal
cations K+(orange), Na+(green), C
CO2(violet) and CCH4(magenta) as functions of distance normal to the (001) surfaces of illite with varying pore thicknesses. The vertical brown and blue lines represent the positions of the oxygen atoms of the illite basal surfaces coordinated to tetrahedral Si sites (Obblue) and tetrahedral Al sites (Obtsbrown). Left and right columns represent the PDPs of models with exchangeable K+and Na+on the (001) surfaces, respectively.
with the basal surface oxygen atoms.51 Clay surfaces clearly prefer CO2to CH4. The differences in fluid structuring with K+
and Na+, however, are due to differences in the solvation
energies of the cations by CO2.70 Because K+ has a greater
affinity toward CO2 than Na+, the increased number of CO2
molecules in the fluid layer nearest the surface with K+restricts
CH4 molecules from entering that layer. As with
Na-montmorillonite,51 there are two CO2 coordination
environ-ments on the (001) surface: (i) one OCO2 located above the center of a ditrigonal cavity and the other OCO2located 0.3 nm above a Si/Al tetrahedron and (ii) the CCO2relatively close to a tetrahedral Si/Al site (0.45 nm). This fluid structuring is also similar to that of CO2in the interlayers of smectites.34−36,38In
contrast, the absence of a well-resolved CH4 peak in the first
layer here shows negligible coordination with the surface. These conclusions are in good agreement with the structure of CH4 in nano- and mesopores of montmorillonite-bounded
pores under identical thermodynamic conditions.51
The PDPs of the exchangeable cations (K+ and Na+) are
greatly influenced by the increasing pore thickness. At collapsed basal spacings (Figure 3), the K+ ions are located
at the midplane of the pore, whereas Na+shows two peaks at
0.13 nm from each surface. At all other pore thicknesses, there are two peaks for K+ and Na+, but their positions are very
different. The dominant peak for K+is at 0.17 nm, and the K+
ions are located above the centers of ditrigonal cavities. The minor K+ peak at 0.25 nm is located above Al tetrahedra. In
contrast, due to its smaller size, the dominant Na+ peak is at 0.05 nm, and the ions are located at the centers of ditrigonal cavities sharing the same plane as the basal (001) oxygen atoms. The second Na+peak is at 0.20 nm, and these ions are
located near the Al tetrahedra. These results are in good agreement with previous simulation studies of Na+ on the
surfaces of hectorite.13Similarly, the location of the highest K+
peak (at ∼0.17 nm) is in good agreement with the results of previous simulation studies of muscovite.72
The radial distribution functions (RDFs) and running coordination numbers (RCNs) show clearly that both the K+
and Na+ions are essentially all in inner-sphere coordination to
the basal oxygen atoms at all pore thicknesses studied (Figure 4a,b). The mean K+-Oband Na+-Obinteratomic distances are
∼0.28 and ∼0.25 nm, respectively, and do not vary with the varying pore thickness. Similarly, the cation-Ob RCNs only
increase from 5.2 to 6.0 (K+) and 5.4 to 5.9 (Na+) with
increasing pore thickness. The RDFs for CO2show its direct
coordination to both cations (Figure 4c,d). Irrespective of the pore thickness, the mean interatomic distances between the cations and the nearest OCO2are ∼0.30 nm for K
+and ∼0.25
nm for Na+. Similarly, the cation-O
CO2RCNs are ∼2.5 for K
+
and ∼1.6 for Na+ at all pore thicknesses. None of the models shows significant coordination between CH4 and the
exchangeable surface cations, even for short periods of time (Figure 4e,f). The energetically favorable interactions between K+ and CO
2, along with the larger ionic radius of K+, are
responsible for its higher RCN values compared to Na+, which
are in excellent agreement with the relative CO2 solvation
energies of the ions and the results of our previous studies of smectites.35,71 The interatomic distances between K+ and O
b
and OCO2are in excellent agreement with previous simulation studies at ambient conditions (298 K).47,72
The distributions of CO2molecular orientations in the first
three layers near the (001) surfaces are quite different with K+
and Na+as exchangeable cations, but both change from quite
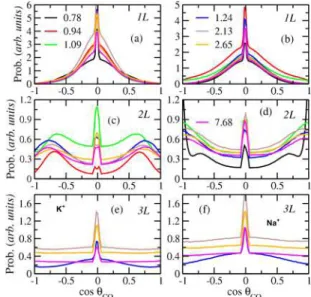
structured in the first layer to nearly isotropic in the third layer. The changes with the changing pore thickness show the greatest structural variability at small pore thicknesses (Figure 5). With both K+and Na+, the CO
2molecules in the first layer
(1L) are oriented predominantly parallel to the basal surface and undergo librational motion around an axis perpendicular to their O−C−O vector (Figure 5a,b). The values of 0 and ±1 for cos θCO2 correspond to CO2 orientations parallel and perpendicular to the plane of the basal surface. The broader distributions in the first layer (1L) with Na+show that the CO
2
Figure 4.Radial distribution functions (RDFs; solid lines) and the corresponding running coordination numbers (RCNs; dashed lines) of the indicated exchangeable surface cations (K+and Na+) with the fluid species and the basal oxygen atoms of the illite (001) surface at different pore thickness.
Figure 5.Computed angular distribution of CCO2molecules in each of the first three layers near the illite (001) basal surfaces as functions of the pore thickness with K+ (left) and Na+ (right). cos θ
CO2 is the cosine of the angle between the O−O vector of CO2molecules and the normal to the (001) surface.
molecules are in less restricted environments than with K+.
The more restricted orientations with K+ and the preferred
orientation of the CO2 molecules in the first fluid layer with
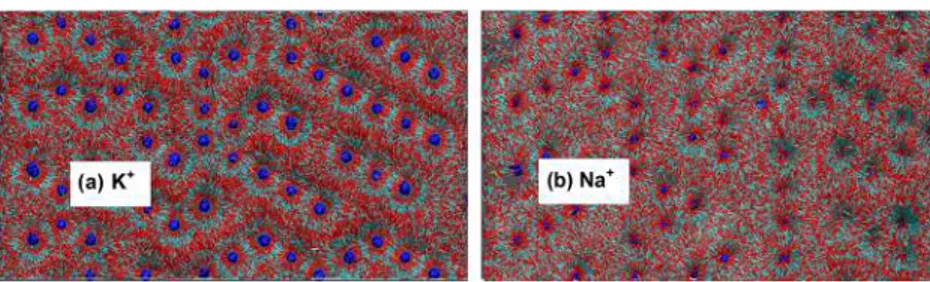
one of their O-atoms toward the K+ions are well-illustrated by
the surface maps for the two 7.68 nm illite models shown in
Figure 6. These maps are sums of 2000 individual snapshots in the production runs. Importantly, these orientation distribu-tions at pore thicknesses <1.0 nm are in reasonable agreement with the calculated distributions in the interlayers of smectites.34−36,41 The CO
2 orientation distributions in the
second layer (2L) are very different with both K+ and Na+
(Figure 5c,d), although both have much broader angular distributions than in the first layer. With K+, the CO
2
molecules undergo larger wobbling motion of their primary axis with respect to the illite surface normal than in 1L and have distributions with average values of +0.7 (45°) and −0.7 (135°), along with a small fraction parallel to the surface. In contrast, with Na+ at the surface, the maxima in the
distributions of the CO2 orientations are parallel (0) and
perpendicular (±1) to the basal surfaces. These two orientations suggest that CO2 molecules experience both
orientations, with the perpendicular orientation much more probable. In the third layer, with both K+ and Na+ on the
surface, the distributions are nearly isotropic and almost identical (Figure 5e,f). The differences between the K+- and Na+-models in the first two layers are due to the Na+ ions
being pinned at the center of the ditrigonal cavities at the level of the basal oxygen atoms and the K+ ions being on average 0.17 nm above basal oxygens. In addition to the preference of CO2 for K+ relative to Na+, the position of K+ limits the
accessible, near-surface space for dynamic CO2 reorientation
and restricted motion extends into 2L (Figure 5b).
Broken Edge Surfaces. The PDPs of CO2 and CH4 on
the surfaces of the broken edge (010) surfaces of the clay layers are qualitatively similar to those on the basal (001) surfaces at large pore thicknesses (Figure 7) but are quantitatively different. For both CO2 and CH4, the
concentrations in the near-surface layers on the (010) surfaces are greater than in the control volumes, the concentration of CO2is greater than that of CH4, but the CO2concentrations
are less and the CH4concentrations more than on the (001)
surfaces. This latter result clearly indicates that the affinity of CO2for the protonated edge sites is weaker than for the basal
surfaces. This result is expected because with the charge-neutral protonation state of the modeled (010) surfaces, there are no exchangeable cations on them, and on the (001) surface, interactions between CO2and the exchangeable cation
appear to play a significant role. On the (010) surfaces, CO2
shows two well-defined layers centered at ∼0.30 and ∼0.65 nm
from the surface, with a poorly resolved shoulder at ∼0.15 nm. CH4shows two layers centered at 0.36 and 0.65 nm, the same
distances as on the basal (001) surfaces, corroborating the idea that CH4 adsorption on silicate surfaces is nonspecific. The
exchangeable cation has no effect, with the location of the peak maxima and the concentrations essentially identical with both K+and Na+. Similarly, the distributions are essentially identical
for surfaces containing both tetrahedral Al and Si sites and those with only Si, as we observed previously for montmor-illonite with no tetrahedral Al and mixed octahedral Al and Mg sites.51 As at the basal (001) surfaces, the increased Figure 6.Pictorial representation of relationships between the CO2molecules in the first fluid layer (0.0−0.35 nm from the surface) with (a) K+ (left) and (b) Na+(right) at the largest pore thickness studied (7.68 nm). Each image is the sum of 2000 frames in the MD production run and illustrates the structural effects of the greater affinity of CO2for K+than Na+. Color code: red and cyan sticks represent the O and C of CO2, respectively; the exchangeable cations are shown as blue balls.
Figure 7.Computed PDPs of CCO2(violet) and CCH4(magenta) near the broken and protonated (010) surfaces with K+and Na+. The left column represents the average concentrations within 1.50 nm of the surfaces plotted parallel to them for the pore thicknesses shown at the top of the box. (a) K+and (b) Na+. Solid and dashed lines represent the distributions on the left and right sides of the illite models. Green dotted lines in (a) and (b) represent the plane of basal oxygen atoms of the (010) surface. The right column shows the distributions normal to the (010) surfaces. (c) K+ and (d) Na+. (e) The adsorption environments of CO2 molecules in the shoulder region near the protonated (010) surface (0.0−0.2) nm from the surface, comparable toFigure 6. Red and white sticks represent the protonated edges of the (010) surfaces. CO2molecules are represented in red (O) and cyan (C).
concentrations with respect to the control volume extend to ∼2.0 nm from (010) surfaces (Figure 7c,d). We observe that CO2 molecules in the shoulder region (∼0.15 nm) are
adsorbed in narrow channels closer to the fluctuating hydroxyl groups and H2O molecules on the (010) edge sites.Figure 7e
(a sum of 2000 individual snapshots in the production run) clearly shows that the volumes probed by CO2molecules are
dictated by the orientation of the (010) edge site groups. As expected, the fluid structure normal to the (010) edge surfaces is independent of the pore thickness, since these surfaces face the transition region and are the same for each pore thickness investigated. Similarly, the PDPs of the total CO2within 1.5 nm of the (010) surfaces also demonstrate the
preference of these surfaces for CO2(Figure 7a,b). In contrast,
there is no significant difference in the CH4concentration in
this region and in the control regions. Notably, the composition of the fluid directly above the center of the 7.68 nm pore is the same as in the control region, as also observed in our previous simulations with montmorillonite.51This result suggests that the distribution of fluid species near broken edges of clay particles is determined primarily by the nature of the cleaved surface and associated protonation state and is not greatly affected by the clay structural charge and the nature of the exchangeable cations.
CONCLUSIONS
Computational molecular modeling of the interactions of an equimolar mixture of CO2 and CH4 with the external (001)
and protonated (010) surfaces of illite with both K+and Na+as
the exchangeable cation on the (001) surfaces performed at a temperature of 323 K and a total fluid pressure of 124 bar shows that these surfaces have a strong preference for CO2
over CH4 as observed in the adsorption energetics and gas
sorption experiments.50 In general, the results are similar to those of analogous calculations for the smectite mineral Na-montmorillonite.51 Together these results suggest that small pores in shales and other tight reservoir rocks bounded by clay minerals greatly prefer CO2and thus that injection of CO2into
such rocks is likely to displace CH4 from small pores and
thereby enhance natural gas production. The calculations were performed using constant reservoir composition molecular dynamics (CRC-MD), which is proving to be a very useful technique to model partitioning of fluid species between a bulk reservoir and nano- and mesopores if the fluid species are mutually soluble. Other important results include the following.
(1) The (001) surfaces show a stronger preference for CO2,
especially with K+ as the exchangeable cation. The
solvation energy of K+ by CO
2is known to be stronger
than that of Na+.71
(2) The protonated (010) surfaces have a somewhat greater preference for CH4 than the (001) surfaces, with the
concentration near the surface close to that in the bulk fluid. In contrast, the CH
4concentration in the first fluid
layer on the (001) surfaces is less than in the bulk. (3) The effects of the surfaces on the fluid composition
extend to approximately 2.0 nm from them, and the composition of the fluid in the center of the pore becomes essentially the same as in the bulk at a pore thickness of approximately 5.7 nm.
(4) The orientations of the CO2molecules near the (001)
surfaces vary greatly with distance from the surface and
are substantially different for surfaces charge-balanced by K+or Na+. Overall, the results confirm the preference of
nano- and mesopores bounded by clay minerals for CO2
over CH4. However, this competitive adsorption of CO2
and CH4 in illites may vary greatly in the presence of
H2O in natural geological settings because the hydration
behavior of the exchangeable cations varies signifi-cantly.73Understanding these effects is an objective of
future work.
ASSOCIATED CONTENT
*
sı Supporting InformationThe Supporting Information is available free of charge at
https://pubs.acs.org/doi/10.1021/acs.jpcc.9b10051.
Additional details of the simulation methodology and their functional forms; concentration variation in the left and right control regions for CO2and CH4as a function
of simulation time in both illite models; details of the planar atomic density distributions of CO2 and CH4
with the increasing pore thickness for both K- and Na-illites at 001 basal surfaces (PDF)
AUTHOR INFORMATION Corresponding Author
Narasimhan Loganathan − Michigan State University, East Lansing, Michigan; orcid.org/0000-0003-0251-5430; Phone: (+1)517-353-1106; Email: naresh20@ msu.edu
Other Authors
A. Ozgur Yazaydin − Michigan State University, East Lansing, Michigan, and University College London, London, United Kingdom; orcid.org/0000-0001-8562-723X
Geoffrey M. Bowers − St. Mary’s College of Maryland, St. Mary’s City, Maryland; orcid.org/0000-0003-4876-9305
Brice F. Ngouana-Wakou − UMR 6457Institut Mines-Télécom Atlantique, Université de Nantes, CNRS/ IN2P3, Nantes, France
Andrey G. Kalinichev − UMR 6457Institut Mines-Télécom Atlantique, Université de Nantes, CNRS/IN2P3, Nantes, France; orcid.org/0000-0003-0743-4242
R. James Kirkpatrick − Michigan State University, East Lansing, Michigan
Complete contact information is available at:
https://pubs.acs.org/10.1021/acs.jpcc.9b10051
Notes
The authors declare no competing financial interest.
ACKNOWLEDGMENTS
The authors acknowledge computational resources from the National Energy Research Scientific Computing Center, which is supported by the Office of Science of the U.S. Department of Energy under ECARP No. m1649 and the iCER computa-tional facility at Michigan State University. The work in this manuscript was supported by the Michigan State University Foundation through an MSU Foundation Professorship to R.J.K. A.G.K. and B.F.N.-W. acknowledge financial support of
the industrial chair “Storage and Disposal of Radioactive Waste” at the IMT-Atlantique, funded by ANDRA, Orano, and EDF, and of the European Union’s Horizon 2020 research and innovation program under grant agreement No. 764810.
REFERENCES
(1) Ilgen, A. G.; Heath, J. E.; Akkutlu, I. Y.; Bryndzia, L. T.; Cole, D. R.; Kharaka, Y. K.; Kneafsey, T. J.; Milliken, K. L.; Pyrak-Nolte, L. J.; Suarez-Rivera, R. Shales at all Scales: Exploring Coupled Processes in Mudrocks. Earth-Sci. Rev. 2017, 166, 132−152.
(2) Pan, Y.; Hui, D.; Luo, P.; Zhang, Y.; Sun, L.; Wang, K. Experimental Investigation of the Geochemical Interactions Between Supercritical CO2 and Shale: Implications of CO2 Storage in Gas-Bearing Shale Formations. Energy Fuels 2018, 32, 1963−1978.
(3) Wilkins, R.; Menefee, A. H.; Clarens, A. F. Environmental Life Cycle Analysis of Water and CO2-Based Fracturing Fluids Used in Unconventional Gas Production. Environ. Sci. Technol. 2016, 50, 13134−13141.
(4) Pei, P.; Ling, K. G.; He, J.; Liu, Z. Z. Shale Gas Reservoir Treatment by a CO2-Based Technology. J. Nat. Gas Sci. Eng. 2015, 26, 1595−1606.
(5) Gu, M.; Xian, X.; Duan, S.; Du, X. Influences of the Composition and Pore Structure of a Shale on its Selective Adsorption of CO2over CH4. J. Nat. Gas Sci. Eng. 2017, 46, 296−306.
(6) Godec, M.; Koperna, G.; Petrusak, R.; Oudinot, A. Potential for Enhanced Gas Recovery and CO2Storage in the Marcellus Shale in the Eastern United States. Int. J. Coal Geol. 2013, 118, 95−104.
(7) Striolo, A.; Cole, D. R. Understanding Shale Gas: Recent Progress and Remaining Challenges. Energy Fuels 2017, 31, 10300− 10310.
(8) Ho, T. A.; Striolo, A. Water and Methane in Shale Rocks: Flow Pattern Effects on Fluid Transport and Pore Structure. AIChE J. 2015, 61, 2993−2999.
(9) Weiss, C. A.; Kirkpatrick, R. J.; Altaner, S. P. Variations in Interlayer Cation Sites of Clay Minerals as Studied by 133Cs MAS Nuclear Magnetic Resonance Spectroscopy. Am. Mineral. 1990, 75, 970−982.
(10) Bowers, G. M.; Singer, J. W.; Bish, D. L.; Kirkpatrick, R. J. Alkali Metal and H2O Dynamics at the Clay/Water Interface. J. Phys. Chem. C 2011, 115, 23395−23407.
(11) Weiss, C. A.; Kirkpatrick, R. J.; Altaner, S. P. The Structural Environments of Cations Adsorbed onto Clays − 133Cs Variable-Temperature MAS NMR Spectroscopic Study of Hectorite. Geochim. Cosmochim. Acta 1990, 54, 1655−1669.
(12) Morrow, C. P.; Yazaydin, A. O.; Krishnan, M.; Bowers, G. M.; Kalinichev, A. G.; Kirkpatrick, R. J. Structure, Energetics and Dynamics of Smectite Clay Interlayer Hydration: Molecular Dynamics and Metadynamics Investigation of Na-Hectorite. J. Phys. Chem. C 2013, 117, 5172−5187.
(13) Greathouse, J. A.; Hart, D. B.; Bowers, G. M.; Kirkpatrick, R. J.; Cygan, R. T. Molecular Simulation of Structure and Diffusion at Smectite-Water Interfaces: Using Expanded Clay Interlayers as Model Nanopores. J. Phys. Chem. C 2015, 119, 17126−17136.
(14) Loganathan, N.; Yazaydin, A. O.; Bowers, G. M.; Kalinichev, A. G.; Kirkpatrick, R. J. Structure, Energetics and Dynamics of Cs+and H2O in Hectorite: Molecular Dynamics Simulations with Uncon-strained Substrate Surface. J. Phys. Chem. C 2016, 120, 10298−10310. (15) Teich-McGoldrick, S. L.; Greathouse, J. A.; Colon, C. F.; Cygan, R. T. Swelling Properties of Montmorillonite and Beidellite Clay Minerals from Molecular Simulation: Comparison of Temper-ature, Interlayer Cation, and Charge Location Effects. J. Phys. Chem. C 2015, 119, 20880−20891.
(16) Loganathan, N.; Yazaydin, A. O.; Bowers, G. M.; Kalinichev, A. G.; Kirkpatrick, R. J. Cation and Water Structure, Dynamics and Energetics in Smectite Clays: A Molecular Dynamics Study of Ca-Hectorite. J. Phys. Chem. C 2016, 120, 12429−12439.
(17) Reddy, U. V.; Bowers, G. M.; Loganathan, N.; Bowden, M.; Yazaydin, A. O.; Kirkpatrick, R. J. Water Structure and Dynamics in
Smectites: 2H NMR Spectroscopy of Mg, Ca, Sr, Cs and Pb-Hectorite. J. Phys. Chem. C 2016, 120, 8863−8876.
(18) Bowers, G. M.; Singer, J. W.; Bish, D. L.; Kirkpatrick, R. J. Structure and Dynamical Relationships of Ca2+ and H
2O in Smectite/2H
2O Sytems. Am. Mineral. 2014, 99, 318−331.
(19) Nanda, R.; Bowers, G. M.; Loganathan, N.; Burton, S. D.; Kirkpatrick, R. J. Temperature Dependent Structure and Dynamics in Smectite Interlayers:23Na MAS Spectroscopy of Na-Hectorite. RSC Adv. 2019, 9, 12755−12765.
(20) Loganathan, N.; Kalinichev, A. G. Quantifying the Mechanisms of Site-Specific Ion Exchange at an Inhomogeneously Charged Surface: Case of Cs+/K+on Hydrated Muscovite Mica. J. Phys. Chem. C 2017, 121, 7829−7836.
(21) Schaef, H. T.; Loring, J. S.; Glezakou, V. A.; Miller, Q. R. S.; Chen, J.; Owen, A. T.; Lee, M.-S.; Ilton, E. S.; Felmy, A. R.; McGrail, B. P.; et al. Competitive Sorption of CO2 and H2O in 2:1 Layer Phyllosilicates. Geochim. Cosmochim. Acta 2015, 161, 248−257.
(22) Loring, J. S.; Schaef, H. T.; Turcu, R. V. F.; Thompson, C. J.; Miller, Q. R.; Martin, P. F.; Hu, J.; Hoyt, D. W.; Qafoku, O.; Ilton, E. S.; et al. In Situ Molecular Spectroscopic Evidence for CO2 Intercalation into Montmorillonite in Supercritical Carbon Dioxide. Langmuir 2012, 28, 7125−7128.
(23) Loring, J. S.; Ilton, E. S.; Chen, J.; Thompson, C. J.; Martin, P. F.; Benezeth, P.; Rosso, K. M.; Felmy, A. R.; Schaef, H. T. In Situ Study of CO2 and H2O Partitioning Between Na-Montmorillonite and Variably Wet Supercritical Carbon Dioxide. Langmuir 2014, 30, 6120−6128.
(24) Loring, J. S.; Schaef, H. T.; Thompson, C. J.; Turcu, R. V. F.; Miller, Q. R.; Chen, J.; Hu, J.; Hoyt, D. W.; Martin, P. F.; Ilton, E. S.; et al. Clay Hydration/Dehydration in Dry to Water-Saturated Supercritical CO2: Implications for Caprock Integrity. Energy Procedia 2013, 37, 5443−5448.
(25) Botan, A.; Rotenberg, R.; Marry, V.; Turq, P.; Noetinger, B. Carbon Dioxide in Montmorillonite Clay Hydrates: Thermodynam-ics, Structure and Transport from Molecular Simulation. J. Phys. Chem. C 2010, 114, 14962−14969.
(26) Kadoura, A.; Nair, A. K. N.; Sun, S. Molecular Simulation Study of Montmorillonite in Contact with Variably Wet Supercritical Carbon Dioxide. J. Phys. Chem. C 2017, 121, 6199−6208.
(27) Makaremi, M.; Jordan, K. D.; Guthrie, G. D.; Myshakin, E. M. Multiphase Monte Carlo and Molecular Dynamics Simulations of Water and CO2 Intercalation in Montmorillonite and Beidellite. J. Phys. Chem. C 2015, 119, 15112−15124.
(28) Rao, A.; Leng, Y. Effect of Layer Charge on CO2 and H2O Intercalations in Swelling Clays. Langmuir 2016, 32, 11366−11374.
(29) Sena, M. M.; Morrow, C. P.; Kirkpatrick, R. J.; Krishnan, M. Structure, Energetics, and Dynamics of Supercritical Carbon Dioxide at Smectite Mineral-Water Interfaces: Molecular Dynamics Modeling and Adaptive Force Investigation of CO2/H2O Mixtures Confined in Na-Montmorillonite. Chem. Mater. 2015, 27, 6946−6959.
(30) Yazaydin, A. O.; Bowers, G. M.; Kirkpatrick, R. J. Molecular Dynamics Modeling of Carbon Dioxide, Water and Natural Organic Matter in Na-Hectorite. Phys. Chem. Chem. Phys. 2015, 17, 23356− 23367.
(31) Cole, D. R.; Chialvo, A. A.; Rother, G.; Vlcek, L.; Cummings, P. T. Supercritical Fluid Behavior at Nanoscale Interfaces: Implications for CO2Sequestration in Geological Formations. Philos. Mag. 2010, 90, 2339−2363.
(32) Cole, D. R.; Ok, S.; Striolo, A.; Phan, A. Hydrocarbon Behavior at Nanoscale Interfaces. Rev. Mineral. Geochem. 2013, 75, 495−545.
(33) Rother, G.; Ilton, E. S.; Wallacher, D.; Hauss, T.; Schaef, H. T.; Qafoku, O.; Rosso, K. M.; Felmy, A. R.; Krukowski, E. G.; Stack, A. G.; et al. CO2 Sorption to Subsingle Hydration Layer Montmor-illonite Clay Studies by Excess Sorption and Neutron Diffraction Measurements. Environ. Sci. Technol. 2013, 47, 205−211.
(34) Loganathan, N.; Yazaydin, A. O.; Bowers, G. M.; Kalinichev, A. G.; Kirkpatrick, R. J. Molecular Dynamics Study of CO2 and H2O Intercalation in Smectite Clays: Effect of Temperature and Pressure
on Interlayer Structure and Dynamics in Hectorite. J. Phys. Chem. C 2017, 121, 24527−24540.
(35) Loganathan, N.; Bowers, G. M.; Yazaydin, A. O.; Schaef, H. T.; Loring, J.; Kalinichev, A. G.; Kirkpatrick, R. J. Clay Swelling in Dry Supercritical Carbon Dioxide: Effects of Interlayer Cations on the Structure, Dynamics and Energetics of CO2Intercalation Probed by XRD, NMR and GCMD Simulations. J. Phys. Chem. C 2018, 122, 4391−4402.
(36) Loganathan, N.; Bowers, G. M.; Yazaydin, A. O.; Kalinichev, A. G.; Kirkpatrick, R. J. Competitive Adsorption of H2O and CO2in 2-Dimensional Nanoconfinement: GCMD Simulations of Cs- and Ca-Hectorites. J. Phys. Chem. C 2018, 122, 23460−23469.
(37) Bowers, G. M.; Schaef, H. T.; Loring, J. S.; Hoyt, D. W.; Burton, S. D.; Walter, E. D.; Kirkpatrick, R. J. Role of Cations in CO2 Adsorption, Dynamics and Hydration in Smectite Clays under In Situ Supercritical CO2Conditions. J. Phys. Chem. C 2017, 121, 577−592. (38) Schaef, H. T.; Loganathan, N.; Bowers, G. M.; Kirkpatrick, R.; Yazaydin, A. O.; Burton, S. D.; Hoyt, D. W.; Ilton, E. S.; Thanthiriwatte, K. S.; Dixon, D. A.; et al. Tipping Point for Expansion of Layered Aluminosilicates in Weakly Polar Solvents: Supercritical CO2. ACS Appl. Mater. Interfaces 2017, 9, 36783−36791.
(39) Bowers, G. M.; Loring, J. S.; Schaef, H. T.; Walter, E. D.; Burton, S. D.; Hoyt, D. W.; Cunniff, S. S.; Loganathan, N.; Kirkpatrick, R. J. Interaction of Hydrocarbons with Clays under Reservoir Conditions: In Situ Infrared and Nuclear Magnetic Resonance Spectroscopy and X-ray Diffraction for Expandable Clays with Variably Wet Supercritical Methane. ACS Earth Space Chem. 2018, 2, 640−652.
(40) Giesting, P.; Guggenheim, S.; van Groos, A. F. K.; Busch, A. Interaction of Carbon Dioxide with Na-Exchanged Montmorillonite at Pressures to 640 bar: Implications for CO2Sequestration. Int. J. Greenhouse Gas Control 2012, 8, 73−81.
(41) Loganathan, N.; Yazaydin, A. O.; Kirkpatrick, R. J.; Bowers, G. M. Tuning the Hydrophobicity of Layer-Structure Silicates to Promote Adsorption of Non-Aqueous Fluids: Effects of F- and OH-Substitution on CO2 Partitioning into Smectite Interlayers. J. Phys. Chem. C 2019, 123, 4848−4855.
(42) Jin, Z.; Firoozabadi, A. Methane and Carbon Dioxide Adsorption in Clay-like Slit Pores by Monte Carlo Simulations. Fluid Phase Equilib. 2013, 360, 456−465.
(43) Jin, Z.; Firoozabadi, A. Effect of Water on Methane and Carbon Dioxide Sorption in Clay Minerals by Monte Carlo Simulations. Fluid Phase Equilib. 2014, 382, 10−20.
(44) Yang, N.; Liu, S.; Yang, X. Molecular Simulation of Preferential Adsorption of CO2over CH4 in Na-montmorillonite Clay Mineral. Appl. Surf. Sci. 2015, 356, 1262−1271.
(45) Wang, Q.; Huang, L. Molecular Insight into Competitive Adsorption of Methane and Carbon Dioxide in Montmorillonite: Effect of Clay Structure and Water Content. Fuel 2019, 239, 32−43. (46) Chen, G.; Lu, S.; Liu, K.; Han, T.; Xu, C.; Xue, Q.; Shen, B.; Guo, Z. GCMC Simulations on the Adsorption Mechanisms of CH4 and CO2in K-illite and their Implications for Shale Gas Exploration and Development. Fuel 2018, 224, 521−528.
(47) Zhang, J.; Clennell, M. B.; Liu, K.; Pervukhina, M.; Chen, C.; Dwhurst, D. N. Methane and Carbon Dioxide Adsorption on Illite. Energy Fuels 2016, 30, 10643−10652.
(48) Chong, L.; Myshakin, E. M. Molecular Simulations of Competitive Adsorption of Carbon Dioxide − Methane Mixture on Illitic Clay Surfaces. Fluid Phase Equilib. 2018, 472, 185−195.
(49) Wan, J.; Tokunaga, T. K.; Ashby, P. D.; Kim, Y.; Voltolini, M.; Gilbert, B.; DePaolo, D. J. Supercritical CO2Uptake by Nonswelling Phyllosilicates. Proc. Natl. Acad. Sci. 2018, 115, 873−878.
(50) Hwang, J.; Pini, R. Supercritical CO2and CH4Uptake by Illite-Smectite Clay Minerals. Environ. Sci. Technol. 2019, 53, 11588− 11596.
(51) Loganathan, N.; Bowers, G. M.; Wakou, B. F. W.; Kalinichev, A. G.; Kirkpatrick, R. J.; Yazaydin, A. O. Understanding Methane/ Carbon Dioxide Partitioning in Clay Nano- and Meso-pores with
Constant Reservoir Composition Molecular Dynamics Modeling. Phys. Chem. Chem. Phys. 2019, 21, 6917−6924.
(52) Perego, C.; Salvalaglio, M.; Parrinello, M. Molecular Dynamics Simulation of Solutions at Constant Chemical Potential. J. Chem. Phys. 2015, 142, No. 144113.
(53) Karmakar, T.; Piaggi, P. M.; Perego, C.; Parrinello, M. A Cannibalistic Approach to Grand Canonical Crystal Growth. J. Chem. Theory Comput. 2018, 14, 2678−2683.
(54) Ozcan, A.; Perego, C.; Salvalaglio, M.; Parrinello, M.; Yazaydin, O. Concentration Gradient Driven Molecular Dynamics: A New Method for Simulations of Membrane Permeation and Separation. Chem. Sci. 2017, 8, 3858−3865.
(55) Heffelfinger, G. S.; van Swol, F. Diffusion in Lennard-Jones Fluids Using Dual Control Volume Grand Canonical Molecular Dynamics Simulation (DCV-GCMD). J. Chem. Phys. 1994, 100, 7548. (56) Hu, Y.; Ray, J. R.; Jun, Y.-S. Na+, Ca2+, and Mg2+ in Brines Affect Supercritical CO2-Brine-Biotite Interactions: Ion Exchange, Biotite Dissolution, and Illite Precipitation. Environ. Sci. Technol. 2013, 47, 191−197.
(57) Farajzadeh, R.; Guo, H.; Winden, J.; Bruining, J. Cation Exchange in the Presence of Oil in Porous Media. ACS Earth Space Chem. 2017, 1, 101−112.
(58) Rotenberg, B. Water in Clay Nanopores. MRS Bull. 2014, 39, 1074−1081.
(59) Altaner, S. P.; Weiss, C. A.; Kirkpatrick, R. J. Evidence from29Si NMR for the Structure of Mixed-Layer Illite/Smectite Clay Minerals. Nature 1988, 331, 699−702.
(60) Lowenstein, W. The Distribution of Aluminium in the Tetrahedra of Silicates and Aluminates. Am. Mineral. 1954, 39, 92− 96.
(61) Plimpton, S. Fast Parallel Algorithms for Short-Range Molecular Dynamics. J. Comput. Phys. 1995, 117, 1−19.
(62) Hoover, W. G. Canonical Dynamics: Equilibrium Phase-Space Distributions. Phys. Rev. A 1985, 31, 1695−1697.
(63) Cygan, R. T.; Liang, J.-J.; Kalinichev, A. G. Molecular Models of Hydroxide, Oxyhydroxide and Clay Phases and the Development of a General Force Field. J. Phys. Chem. B 2004, 108, 1255−1266.
(64) Pouvreau, M.; Greathouse, J. A.; Cygan, R. T.; Kalinichev, A. G. Structure of Hydrated Gibbsite and Brucite Edge Surfaces: DFT Results and Further Development of ClayFF Classical Force Field with Metal-O-H Bending Terms. J. Phys. Chem. C 2017, 121, 14757− 14771.
(65) Pouvreau, M.; Greathouse, J. A.; Cygan, R. T.; Kalinichev, A. G. Structure of Hydrated Kaolinite Edge Surfaces: DFT Results and Further Development of ClayFF Classical Force Field with Metal-O-H Angle Bending Terms. J. Phys. Chem. C 2019, 123, 11628−11638. (66) Cygan, R. T.; Romanov, V. N.; Myshakin, E. M. Molecular Simulation of Carbon Dioxide Capture by Montmorillonite Using an Accurate and Flexible Force Field. J. Phys. Chem. C 2012, 116, 13079−13091.
(67) Martin, M. G.; Siepmann, J. I. Transferable Potentials for Phase Equilibria. 1. United-Atom Description of n-Alkanes. J. Phys. Chem. B 1998, 102, 2569−2577.
(68) Plimpton, S. J.; Pollock, R.; Stevens, M. J. In Particle−Mesh Ewald and rRESPA for Parallel Molecular Dynamics Simulations, Proceedings of the Eigth SIAM Conference on Parallel Processing for Scientific Computing, Minneapolis, Minnesota, 1997.
(69) Tribello, G. A.; Bonomi, M.; Branduardi, D.; Camilloni, C.; Bussi, G. Plumed 2: New Feathers for an Old Bird. Comput. Phys. Commun. 2014, 185, 604−613.
(70) Peng, D. Y.; Robinson, D. B. A New Two-Constant Equation of State. Ind. Eng. Chem. Fundam. 1976, 15, 59−64.
(71) Criscenti, L. J.; Cygan, R. T. Molecular Simulations of Carbon Dioxide and Water: Cation Solvation. Environ. Sci. Technol. 2013, 47, 87−94.
(72) Wang, J.; Kalinichev, A. G.; Kirkpatrick, R. J.; Cygan, R. T. Structure, Energetics and Dynamics of Water Adsorbed on the Muscovite (001) Surface: A Molecular Dynamics Simulation. J. Phys. Chem. B 2005, 109, 15893−15905.
(73) Chong, L.; Myshakin, E. M. The Effect of Residual Water Content on Preferential Adsorption in Carbon Dioxide - Methane − Illite Clay Minerals: A Molecular Simulation Study. Fluid Phase Equilib. 2020, 504, No. 112333.