Contents lists available atScienceDirect
Journal of Urban Management
journal homepage:www.elsevier.com/locate/jumAnalysis of city size distribution in Ethiopia: Empirical evidence
from 1984 to 2012
Amha Ermias
a,⁎, Jan Bogaert
b, Fisseha Wogayehu
aaEthiopian Institute of Architecture Building Construction and City Development, Dej. Baltcha Aba Nefso St, Addis Ababa, Ethiopia bUniversité de Liège / Gembloux Agro-Bio Tech. Unité Biodiversité et Paysage, Passage des Déportés, 2 B-5030 Gembloux, Belgique
A R T I C L E I N F O
Keywords: Ethiopia Urbanisation City size distribution Gini coefficient
A B S T R A C T
Urbanisation in Ethiopia is increasing rapidly. This paper uses city-level data to investigate the evolution of Ethiopia’s city size distribution from 1984 to 2012, using descriptive statistics and time-series Gini coefficient calculations. Over that period, the study found that overall city size distribution followed an apparent parallel growth pattern, with disparities among the country’s regional states. This demonstrates that the parallel growth rule of city size distribution found in developed countries and most emerging economies applies in Ethiopia. Findings suggest that changes in the country’s city size distribution from 1984 to 2007 resulted from changes in the political system and policy issues. The results enhance understanding of the evolution of Ethiopia’s city size distribution and have important implications for policy debates.
1. Introduction
Ethiopia is Africa’s oldest independent state and second most populous nation, with a total population of 90.07 million and a population growth rate of 2.4 percent in 2015 (United Nations, Department of Economic and Social Affairs, 2015). Urbanisation in the country can be traced back to the Axumite Empire (100 B.C. to 650 A.D.), with modern beginnings in the eighteen and nineteenth centuries, and accelerated growth in the twentieth century (Crummey, 1987; Pankhurst, 1982). Urbanisation has been rapidly in-creasing in Ethiopia: the country’s urban population has exceedingly tripled over 30 years, from about 4.5 million in 1984 to about 16.7 million in 2014 (CSA, 2013; Office of the Population and Housing Census Commission, 1991). With an average annual growth rate exceeding 4.54 per cent for nearly three decades, Ethiopia is urbanising faster than Sub-Saharan Africa (4.03 percent), which is itself among the world’s fastest urbanising regions (World Bank, 2014). According to Central Statistical Agency (CSA) projections, the country’s urban population is expected to nearly triple from 2012 to 2037, reaching more than 42 million (CSA, 2013).
Rapid urbanisation in the global South brings both opportunities and challenges (Woodrow Wilson International Center for Scholars, 2007). In response to Ethiopia’s rapid urbanisation, decision makers and urban planners have proposed different urban development scenarios, and debates have persisted over whether to prioritise large, small, or medium-sized cities (World Bank, 2016). Some scenarios favour large cities to achieve rapid urbanisation and economic development while maintaining and strengthening current trends along major transport and communication corridors. Large cities usually have comparative advantages over small cities in terms of employment creation, productivity, distribution and consumption, industrialisation, innovation, and technological advancement (Eberts & McMillen, 1999; Rosenthal & Strange, 2004; Tiffen, 2003). Conversely, this creates a mass
https://doi.org/10.1016/j.jum.2018.12.007
Received 3 July 2018; Received in revised form 18 December 2018; Accepted 22 December 2018 Peer review under responsibility of Zhejiang University and Chinese Association of Urban Management.
⁎Corresponding author.
E-mail addresses:amha.ermias@gmail.com(A. Ermias),j.bogaert@ulg.ac.be(J. Bogaert),fisseha.wegayehu@eiabc.edu.et(F. Wogayehu).
2226-5856/ © 2019 Zhejiang University and Chinese Association of Urban Management. Production and hosting by Elsevier B.V. This is an open access article under the CC BY-NC-ND license (http://creativecommons.org/licenses/BY-NC-ND/4.0/).
movement of people to large cities, which contributes to disadvantaging and marginalising the majority of the urban population (Watson, 2013). While urbanisation is among the most powerful and visible anthropogenic forces on earth (Bogaert, Vranken, & André, 2014), African cities with an overwhelmingly large population have induced serious environmental challenges (Economist Intelligence Unit, 2012). Meanwhile, an alternative group of policy makers and urban planners have favoured developing small and medium-sized cities as the primary mode of urbanisation in Ethiopia. Predicated on the assumption that high population growth is experienced in the country’s rural areas, this approach favours small and medium-sized cities as the main employment centres. On this basis, a polycentric urban scenario is proposed, in which large secondary cities and the consolidation of urban clusters can generate and redirect economic development to small and medium-sized cities including their rural hinterlands. It should be questioned, however, how much (central) government policies have influenced the city size distribution in Ethiopia. In exploring this question, this paper aims to increase understanding of the country’s city size distribution pattern and its evolution over time.
Studies on city size distribution are important to describe the dynamic nature of urban growth processes (Benguigui & Blumenfeld-Lieberthal, 2007; Dobkins & Ioannides, 1999; Wu & He, 2016). A central question about city size distribution is whether the city growth pattern is convergent, divergent or parallel (Sharma, 2003;Eaton & Eckstein, 2007). A convergent growth pattern occurs when smaller cities grow faster than larger cities; divergent growth refers to larger cities growing faster than smaller cities; and parallel growth refers to similar growth rates independently of city size. For example, Tisabay, Maichew, and Harar are three differently sized cities in Ethiopia. In 1984, they had 2,867, 14,190, and 62,160 inhabitants, respectively; in 2012, these numbers had increased to 22,229, 31,088, and 112,781, representing respective growth rates of 675 per cent, 119 per cent, and 81 per cent. When smaller cities like Tisabay grow much faster than medium or large cities, a convergent growth pattern is observed.
In this study, we investigated city size distribution changes in the Ethiopian urban system from 1984 to 2012, aiming to answer the central question:‘Which urban growth pattern is the Ethiopian urban system following?’ Since large cities are expected to have better economic opportunities than small and medium-sized cities, we hypothesise that the former have grown faster than the latter (Eberts & McMillen, 1999; Xu & Zhu, 2009).
There are at least four reasons why understanding the city size dynamics of Ethiopia is of particular interest. First, every urban planning strategy emanates from deeper understanding of the essential spatial dimensions of cities and their changes over time (Angel, Parent, Civco, & Blei, 2011). As Ethiopia has been facing complex urban planning and development challenges (Schmidt & Kedir, 2009), conceptualising Ethiopian city size distribution is a valuable contribution to policy discourse. Second, given the limited scholarly research on this topic, systematic examination of the overall city size distribution in Ethiopia is needed.Wubneh (1980) published a related work almost 40 years ago, which is now rather obsolete, whileWubneh’s (2013)more recent work focuses mainly on Addis Ababa. The latter found parallel growth in Ethiopia’s urban system, with declining dominance of the primate city, Addis Ababa. Hence, a more complete, thorough, and up-to-date analysis of the country’s city size distribution is required. Third, empirical studies on this topic devoted to developing countries and emerging economies (Berry & Okulicz-Kozaryn, 2012; Schaffar & Dimou, 2012) provide comparator cases in Sub-Saharan Africa. Finally, since 1991, Ethiopia has experienced a decentralised government structure, resulting in the formation and expansion of urban centres in each district and sub-district across the country. Its re-percussions on the country’s urban system warrant examination.
2. Data description and methods 2.1. Data description
This paper examines Ethiopia’s city size distribution based on data from the CSA, a government agency responsible for producing statistical data on demographic and socio-economic conditions. To date, Ethiopia has carried out three national censuses: in 1984, 1994, and 2007 (Wubneh, 2013). Data collected in 1984 include the present independent state of Eritrea; hence, all the 26 Eritrean cities were excluded from our dataset. Otherwise, we took data from the three national censuses and the CSA’s official projections for 2012. For comparison, we used data from Kenya and Uganda. These two countries were chosen for four principal reasons: (i) their similarity in the composition of the overall low percentage of urban population; (ii) they have also been experiencing rapid urban population growth; (iii) availability of data; and (iv) they are geographically proximate to Ethiopia. We used census data from 1979, 1989, 1999, and 2009 for the two-comparator countries, sourced from the national statistical offices of Kenya and Uganda (available online fromhttps://www.citypopulation.de/Africa.html). The primary unit of analysis is cities.
Wefirst determined what constitutes a city in the Ethiopian context. Hence, a standard definition of what constitutes a city or urban centre is adopted for statistical purposes and used at the national level, by referring to Ethiopian planning law. The law defines a city in Ethiopia as an‘urban centre’ with an established municipality or with a population size of 2000 or more inhabitants, in which 50 percent of the labour force are primarily engaged in non-agricultural activities (FDRE, 2008).
This paper adopted the Structure Plan Guide of the Ethiopian Ministry of Urban Development and Construction for classifying Ethiopian cities (Ministry of Urban Development and Construction, 2012). It includes the following urban classifications and their city population cut-offs: ‘small town’ (2000 to 20,000 people); ‘medium town’ (> 20,000 to 50,000); ‘large town’ (> 50,000 to 100,000);‘city’ (> 100,000 to 1,000,000); and ‘metropolis’ (> 1,000,000). It should be noted that the general term ‘city’ is used in this paper to refer to urban centres, independently of their size. There are various reasons for adopting this classification. First, it sets a minimum threshold for the initiate city size, which is important for our study. A few small settlements considered as cities for administrative purposes are excluded from our dataset because it is difficult to distinguish them from other small settlements (Anderson & Ge, 2005). Second, this classification enables us to identify, track, and interpret settlements that become or cease to be cities during the study periods. Third, it has been developed to determine the scale level of structure planning, the type of urban
planning standards to apply, and the type and contents of urban data to collect (Ministry of Urban Development and Construction, 2012).
This paper adopted both typical cross-section and panel data. The cross-sectional data include cities with available population data in a given time period. The panel data comprise only cities available in all four-time periods and hence exclude all cities formed after 1984. Having data over time is useful as it allows us to examine dynamic relationships, which we cannot do with a single cross section (Wooldridge, 2002). The number of cities included in our cross-sectional data increased from 323 in 1984 to 869 in 2012 (Table 2), while our panel dataset comprises 293 cities.
2.2. Methods
The Gini coefficient is commonly used to measure the distribution of quantifiable items and events in a population, region, or nation. It is derived from the Lorenz Curve (Schechtman & Yitzhaki, 2013;Wangbao & Bohong, 2004), itself based on the relationship between the cumulative distribution of the variable (x-axis) and the cumulative percentage of the variate (y-axis). The line y=x represents a uniform distribution of events or phenomena in which all members of the population have an equal proportion.
The Gini coefficient has been extensively applied in city size distribution studies (Henderson & Wang, 2006; Wang & Zhu, 2013). For example, (Wang & Zhu, 2013) applied the Gini coefficient when studying city size distribution in China, finding an approximately parallel long-term growth process. Meanwhile, (Henderson & Wang, 2006) employed Gini coefficients to examine how increases in the numbers and sizes of cities shaped urbanisation.
Calculating spatial Gini coefficients gives an overall measure of inequality for the entire distribution. To calculate the Gini coefficient, we ranked all cities from smallest to largest on the x-axis and the cumulative share of their population on the y-axis. The Gini coefficient equals the area between the 45° line and the plotted curve as a proportion of the total area below the 45° line (Henderson & Wang, 2006). The size distribution is less equal when this area is greater, as smaller cities account for a smaller cumulative share of the sample population. The value of the Gini coefficient lies between 0 and 1: a value of 0 implies perfect equality, whereas 1 indicates perfect inequality (Schechtman & Yitzhaki, 2013). Therefore, if Ethiopian cities follow a convergent (divergent) growth pattern, the Gini coefficients are expected to decrease (increase). Conversely, if the growth pattern of Ethiopia’s city size distribution is parallel, the Gini coefficients should remain relatively stable over the studied years. We performed Gini coefficient statistical analysis using the statistical software language R (R Core Team, 2013).
3. Results 3.1. Overview
Ethiopia has experienced rapid urbanisation since 1984, as shown inTable 1andFig. 1. While the country’s total population more than doubled from 1984 (~40 million) to 2012 (~84 million), its urban population increased more than threefold, from ~4.5 million in 1984 to ~14.5 million in 2012. This implies a rapid increase in the percentage of the total population living in urban areas, from ~11 per cent in 1984 to ~17 per cent in 2012. The number of cities in the two censuses, as defined by the CSA, increased from 648 in 1984 to 972 in 2007. Likewise, the average city population increased from ~7000 inhabitants in 1984 to ~15,000 inhabitants in 2012.
As shown by the distribution data inTable 2, Ethiopia’s urbanisation is characterised by many small cities, a lesser number of medium-sized cities, and very few large cities. The percentage of cities with a population below 20,000 was ~93 percent in 1984, but declined to ~86 percent in 2007. In nominal terms, the number of large cities with more than 50,000 inhabitants increased from 10 in 1984 to 36 in 2012. Addis Ababa, which is a primate city and the national capital, had 3,103,673 inhabitants in 2015, which accounts for ~20 percent of the country’s total urban population. Throughout the study period, more than 86 percent of cities had a population between 2,000 and 20,000 inhabitants, accounting for about ~37 per cent (CSA, 2008) of the total city population. The period between the second and third censuses (1994 to 2007) exhibits rapid urban expansion.
Therefore, a key feature of Ethiopian urbanisation is the formation of many new cities. In addition, many small cities are evolving into medium- and large-sized cities, while large cities are also growing. These population increases are associated with the increased provision of urban infrastructure and services that accompanied the administrative decentralisation process (Ethiopian Civil Service University, 2015).
Table 1
Ethiopian population and urbanisation.
Source: Computation based onCSA (1991),CSA (1998),CSA (2008)andCSA (2012); State of Ethiopian Cities Report.
Year Population Urban Population Number of Cities Average City Size (inhabitants)
1984 39,868,572 4,453,511 648 6873
1994 53,477,265 7,321,038 922 7940
2007 73,918,505 11,956,170 972 12,301
3.2. Time-series gini coefficients of city size distribution
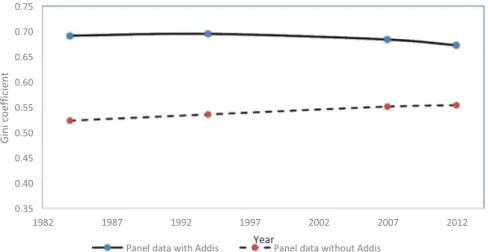
The time-series Gini coefficients derived from different samples and datasets are presented inFigs. 1 and 2. We use 1984 as the base year for two reasons: (1) city size distribution study is sensitive to different sample sizes (Bee, Riccaboni, & Schiavo, 2013; Guérin-Pace, 1995); and (2) to ensure the robustness of ourfindings (Wang & Zhu, 2013). To identify the effect of the primate city, our analyses included datasets with and without Addis Ababa.
Fig. 1is based on panel data of 293 (with Addis Ababa) and 292 (without Addis Ababa) cities. The panel data include only cities existing in all four sample years of the 28-year study period. In general, we observe similar growth patterns in both datasets across the four sample years. For panel data of the 293 cities, the Gini values for 1984, 1994, 2007, and 2012 are situated between 0.695 and 0.672. Meanwhile, the Gini values for the 292-city panel (excluding Addis Ababa) for the four years are between 0.554 and 0.523. Thefindings reflect a tendency of general parallel growth in both datasets, since no abrupt or strong changes in Gini coefficient values are observed.Fig. 1also indicates that Addis Ababa significantly increases the Gini value of inequality in Ethiopia’s city size dis-tribution, which could be expected given its outstanding size compared to the country’s other cities. Considering the relatively long
Fig. 1. Gini coefficient of city size distribution in Ethiopia, based on panel data, for both with and without Addis Ababa: 1984–2012.
Table 2
City Class Size and Cumulative Distribution of Ethiopian Cities (1984, 1994, 2007 and 2012).
Source: Computation based onCSA (1991),CSA (1998),CSA (2008)andCSA (2012); State of Ethiopian Cities Report.
Year 2012 2007 1994 1984
City Size Class No. of Cities Cumulative Percentage No. of Cities Cumulative Percentage No. of Cities Cumulative Percentage No. of Cities Cumulative Percentage 2,000 to 20,000 750 86.31 717 89.40 456 90.12 301 93.19 20,001 to 50,000 83 95.86 61 97.01 37 97.43 12 96.9 50,001 to 100,000 20 98.16 13 98.63 9 99.21 9 99.7 > 100,001 16 100.00 11 100.00 4 100.00 1 100.000
time between sample years, the values of the two lines can be considered parallel, suggesting that cities of different sizes in Ethiopia follow a parallel growth pattern.
Fig. 2is based on the cross-sectional data, i.e. all cities with population data available for each year. The dataset comprises 323 cities in 1984, 506 in 1994, 802 in 2007, and 869 in 2012. The Gini coefficient for the dataset including Addis Ababa ranged between 0.658 and 0.686 during the 28 studied years; by contrast, the Gini coefficient for the dataset excluding Addis Ababa ranged between 0.517 and 0.571 over the same period. Both lines indicate that city size distribution presented generally parallel growth, since only relatively small changes are observed. The impact of the capital city on distribution inequality is confirmed.
Addis Ababa is a primate city with a population eleven times greater than that of the second largest city. However, the percentage of the country’s urban population living in Addis Ababa declined from 32 percent in 1984 to 20 percent in 2012. Ethiopia’s de-centralisation policy and the subsequent formation of new cities could play a key role in shaping the effect of Addis Ababa (Arup International Development, 2016).
To further explore the nature of Ethiopia’s city size distribution, we calculated Gini coefficients for cross-sectional datasets with different cut-offs.Table 3illustrates the Gini coefficients and number of cities using cut-off points of 20,000, 50,000, and 100,000 inhabitants. The Gini coefficient for cities with a population exceeding 100,000 in 1984 is zero, since only Addis Ababa satisfies that criterion. In most cases, the Gini coefficients successively decrease, showing consistent decline in the inequality of city size dis-tribution in Ethiopia. One exception is the increase in the Gini coefficient in 1994. This could be a result of the formation, expansion and rapid growth of Ethiopian regional or‘secondary’ centres. For the first time in the country’s history and since 1991, Ethiopia had decentralised administration to the regions to encourage more consistent growth across the country (ARUP, 2016).
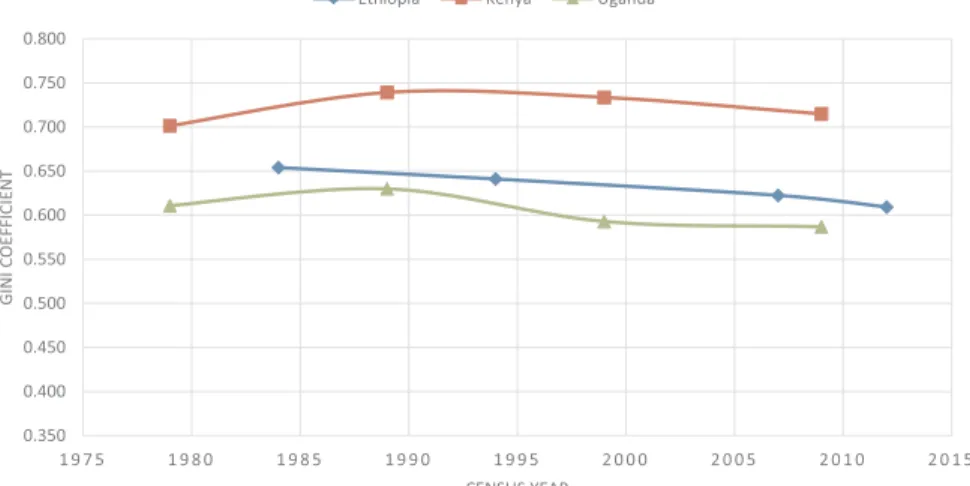
Ethiopia’s city size distribution was then compared against the equivalent distributions in two neighbouring African countries: Kenya and Uganda.Fig. 3plots the Gini coefficients based on cities of the three countries with a population exceeding 10,000 inhabitants, measured at different points between 1979 and 2012. As noted earlier, we used data collected from national censuses in 1979, 1989, 1999, and 2009 for Kenya and Uganda; city-level data were unavailable for the exact years in which data were collected on Ethiopia.Fig. 3shows that the Gini coefficients ranged between 0.701 and 0.739 for Kenya, between 0.587 and 0.622 for Uganda, and between 0.609 and 0.654 for Ethiopia. Given the limited differences between the years, no significant changes should be inferred from this analysis.
The Ethiopian city size distribution exhibits a continuous (albeit slight) decreasing trend, reflecting slow decline in the inequality of city size distribution in Ethiopia. In contrast, the Gini coefficients for Kenya and Uganda show initial increases followed by slow decline. Gini coefficients are highest for Kenya and lowest for Uganda, with the values for Ethiopia in between (but closer to those for Uganda) (Fig. 3). All three country’s lines show that city size distribution presented approximately parallel growth, with a little divergence from 1979 to 1989 for both Kenya and Uganda, and a little convergence from 1999 to 2009 for Kenya.
Under the 1995 Constitution of Ethiopia the country was reconstituted into a federation of nine ethnically based regional states Table 3
Results of Gini coefficient based on cross-sectional sample data for different cut offs for the period 1984–2012.
Year Cities > 100,000 Cities > 50,000 Cities > 20,000 Cities > 2,000
Number of cities Gini value Number of cities Gini value Number of cities Gini value Number of cities Gini value
1984 1 0 10 0.627 22 0.65 323 0.683
1994 4 0.597 13 0.632 50 0.647 506 0.686
2007 11 0.586 24 0.60 85 0.615 802 0.662
2012 16 0.565 36 0.578 119 0.954 869 0.658
and two chartered cities. The regional states comprise Afar, Amhara, Benishangul-Gumuz, Gambella, Harari (the smallest and ur-banised), Oromia, Southern Nations, Nationalities and Peoples’ (SNNP), Somali, and Tigray; the two chartered cities are Addis Ababa and Dire-Dawa (FDRE Federal Democratic Republic of Ethiopia, 1995). Based on this administrative division,Fig. 4presents Gini coefficients across the eight major regions of Ethiopia.
Overall, the city size distribution at regional level exhibits two main characteristics. First, there are disparities among regional states. For example, Benishangul Gumuz and Afar have lower Gini coefficients than the other regions. Second, in terms of trends, the Gini coefficients rose slightly across all regions except for Gambella. AsFig. 4shows, the trend provides a parallel but slightly diverging pattern. The highest percentage change from 1994 to 2012 was recorded for Afar (9.2 percent), followed by Gambella (6.9 percent), and Benishangul Gumuz (6.4 percent). In the country’s federal system, these regions with high Gini coefficients are con-sidered‘emerging regions’ and they have been experiencing an increase in the number of cities.
4. Discussion
4.1. Validation of results and future improvements
Urbanisation and city size distribution can be studied using different methods. In both developed and developing countries, a useful measure of city size distribution is time-series Gini coefficients (Wang & Zhu, 2013). Prior empirical studies have tested whether the relative size and rank of cities remain stable over time. Suchfindings help to determine urban growth processes, whether parallel, divergent, or convergent (Eaton & Eckstein, 1997), generating results with policy implications (Soo, 2007).Eaton and Eckstein (1997)studied the size and rank of French and Japanese cities and favoured a parallel growth pattern over divergent or convergent growth patterns. Based on urban data from the United States.Black and Henderson (1999)developed and found support for a theoretical model of parallel growth in the size and number of cities.Ioannides and Overman (2003)constructed a stochastic kernel for evolution in the distribution of U.S. metropolitan area populations from 1900 to 1990. Their study’s results indicated the parallel growth process of U.S. cities. Finally,Dobkins and Ioannides (2001)studied the dynamic evolution of U.S. city size dis-tribution,finding approximately parallel growth in the U.S. urban system, ‘despite its spatial expansion’.
Overall, the Ethiopian urban system has experienced gradual growth in small and medium-sized cities and the apparently di-minishing role of Addis Ababa as a primate city. Having accounted for ~32 percent of Ethiopia’s urban population in 1984, this figure continuously declined over the study period, recorded at ~29 percent in 1994, ~23 percent in 2007, and ~20 percent in 2012 percent. Hence, the Ethiopian urban system has manifested a growth pattern of increasingly parallel urban growth (Wubneh, 1980; Wubneh, 2013). In practice, however, the economic, cultural, and political dominance of Addis Ababa is likely to persist: it is the headquarters of the African Union and the UN Economic Commission for Africa, the country’s capital city, and an emerging inter-national centre with diverse economic and cultural characteristics.
Finally, we compared our results to two similar previous studies based on city population data. Ourfinding of a parallel growth pattern in Ethiopia’s city size distribution from 1984–2012 is similar to that ofWubneh (1980, 2013), who studied the period from 1984 to 2010. However, we improved on previous studies by using multiple methods and various sample sizes to conduct more rigorous research.
In line with ourfindings, we call for further verification and research. Further verification is recommended from both urban data and methodology perspectives. Extraction of data from night-time images could provide a good comparison for the data used in this study (Anderson, Tuttle, Powell, & Sutton, 2010; Sutton, Taylor, & Elvidge, 2010) environment.
4.2. Policy implications
This paper’s results can elucidate policy issues in Ethiopia. Most importantly, we showed that the number and rate of small and Fig. 4. Ethiopian eight regional states: Gini index value from 1994–2012.
medium-sized cities increased at national level, and revealed disparities in city size distribution at regional level. Although Addis Ababa has remained a primate city, its percentage of the country’s total urban population has declined. Aside from economic and population growth in Ethiopia, the country’s national policies played a key role in shaping Ethiopia’s urban growth dynamics.
The two periods from 1984 to 1994 and from 1994 to 2007 coincided with major changes in the country’s political history, with implications for the country’s urban system. The number of Ethiopian cities with a population exceeding 2,000 inhabitants increased from 648 in 1984 to 972 in 2007. Such changes correspond with two significant policy changes: first, regime change in 1991 brought a shift from a socialist to a free-market economy; and second, the 1995 Ethiopian constitution granted formation and decentralisation of the country’s regional states. Most importantly, the country’s political system issued a constitutional mandate allowing regional states to form their own rural and urban administrations. Such policy changes encouraged the formation and expansion of small and medium-sized cities.
Ethiopia’s Growth and Transformation Plan (GTP) is the country’s multi-year development policy, which aims to propel the country to middle-income status during the next decade (achieving lower middle-income country status by 2025). Thefirst Growth and Transformation Plan (2010/11–2014/15) and its successor plan entitled the second Growth and Transformation Plan (2015/ 16–2020/21) have urban governance and development policies. Urban-specific policies regarding urban planning, small and micro enterprise support, integrated infrastructure provision, climate change and green development, integrated housing development, construction, land development and management, and urban governance are enacted and operational, with all implementation challenges, in most cases. Hence, reviewing existing urban development policies in line with the dynamics in large, medium-sized, and small cities is an essential area of policy debate.
Another interesting issue is that city size distribution in Ethiopia showed different modalities when applying different city thresholds. The formation and expansion of small and medium-sized cities are mainly attributable to administrative and political factors, while socio-economic factors especially influence large cities. This finding, thus, indicates that the driving forces for big cities and for small and medium-sized cities may differ. The implication is that urban development policies should be separately tailored to large cities and to small- and medium-sized cities. Large cities need to control population growth and migration, whereas small and medium-sized cities should aim for expansion. In setting current and future policies, it is necessary to review data from previous years and use them to plan ahead with specific targets and guidance for different-sized cities.
4.3. Limitations
Although Gini coefficients have been successfully adopted and applied to investigate city size distribution in Ethiopia, certain issues in this study demand more detailed future analyses. First, many other techniques can be used to study city size distribution, including the Pareto- and double Pareto-lognormal distribution (Giesen, Zimmermann, & Suedekum, 2010). In addition, other than OLS, such methods as Hill’s estimator (Soo, 2007) and maximum likelihood (Anderson & Ge, 2005) may be alternative approaches for studying this phenomenon.
Second, due to city-level data constraints, we compared Ethiopian datasets for 1984, 1994, 2007, and 2012 with Kenyan and Ugandan urban datasets for 1979, 1989, 1999, and 2009. This variation between the datasets may have inherent limitations for depicting specific temporal city size distribution.
Third, city-level data are missing in some cases, and because the last Ethiopian census was carried out in 2007, this paper used the CSA’s projected data for 2012.
5. Conclusion
This paper employed different methods, including descriptive statistics and time-series Gini coefficients, to investigate apparent changes in Ethiopia’s city size distribution at different time periods. Overall, Ethiopia’s urbanisation has experienced rapid growth, in terms of both population growth and an increasing number of cities. The country’s urban population grew from ~4.5 million in 1984 to ~15.3 million in 2012, while the number of cities with more than 2,000 inhabitants increased from 648 to 972. However, many Ethiopian cities are concentrated towards the lower end of the urban hierarchy. The Ethiopian city system is clearly less mature and incomplete, as settlements with fewer than 2,000 inhabitants can also be considered cities.
By comparing city-level data for 1984 and 2012, wefind that Ethiopian cities are generally more evenly distributed where the pattern of urban growth has been parallel. Gini coefficients derived from multiple samples and datasets demonstrate that Ethiopian urban growth indeed displays parallel growth. However, Gini coefficients for Ethiopian regional states vary considerably. For ex-ample, Benishangul Gumuz, and Afar have low Gini values between 0.31 in 1994 and 0.41 in 2012. Meanwhile, Gini coefficients for Tigray, Oromia, SNNP, and Amhara are between 0.51 and 0.59 for the same period. We also compared Gini coefficients for Ethiopia with those for Kenya and Uganda,finding that all three countries showed generally even distribution, although Ethiopia’s case is increasingly more even.
The two periods of 1984 to 1994 and 1994 to 2007 were highly consistent with changes in the country’s political system and policy issues. Following the constitutional mandate of Ethiopian regional states, many new and emerging cities have formed and/or expanded across the country. Gini coefficients will likely be important for further understanding the evolution of city size distribution from practical perspectives. Recent debates on the country’s urban development policy will benefit from this study’s findings that large cities and small and medium-sized cities require separate and specific policy interventions and policy implementation mod-alities. In addition, policy debates on the Ethiopian urban system should explore the extent to which development prioritises small and medium-sized cities, which are increasing in both number and population.
Acknowledgements
This work is supported by ARES-CCD (the federation of higher education institutions of the Wallonia-Brussels Federation) through a project entitled“Local Capacity Building for Sustainable Urban Development of Small Regional Towns in Ethiopia”. The authors acknowledge ARES-CCD for funding.
References
Anderson, G., & Ge, Y. (2005). The size distribution of Chinese cities. Regional Science and Urban Economics, 35(6), 756–776.
Anderson, S. J., Tuttle, B. T., Powell, R. L., & Sutton, P. C. (2010). Characterizing relationships between population density and night-time imagery for Denver, Colorado: Issues of scale and representation. International Journal of Remote Sensing, 31(21), 5733–5746.
Angel, S., Parent, J., Civco, D. L., and Blei, A. M. (2011) Making room for a planet of cities. Lincoln Institute of Land Policy. ARUP (2016) Future Proofing Cities: Ethiopia - Regional Cities. London.
Bee, M., Riccaboni, M., & Schiavo, S. (2013). The Size Distribution of US Cities: Not Pareto, even in the tail. Economics Letters, 120(2), 232–237.
Benguigui, L., & Blumenfeld-Lieberthal, E. (2007). A dynamic model for city size distribution beyond Zipf’s law. Physica A: Statistical Mechanics and Its Applications, 384(2), 613–627.
Berry, B. J. L., & Okulicz-Kozaryn, A. (2012). The city size distribution debate: Resolution for US urban regions and megalopolitan areas. Since Direct, 29(Suppl. 1), 1–7.
Black, D., & Henderson, V. (1999). A Theory of Urban Growth. Journal of Political Economy 107.2, 107(2), 252–284.
Bogaert, J., Vranken, I., & André, M. (2014). Anthropogenic effects in landscapes: Historical context and spatial pattern. Biocultural Landscapes, (Nassauer 1995), 89–112.
CSA. (1991) The 1984 Population and Housing Census. Analytical Report at National Level, Addis Ababa. CSA. (1998) The 1994 Population and Housing Census. Analytical Report at National Level, Addis Ababa. CSA. (2008) The 2007 Population and Housing Census. Preliminary Report at National Level, Addis Ababa. CSA. (2012) Population Estimates for Urban Centres in Ethiopia, Addis Ababa.
CSA (2013). Population Projections for Ethiopia, 2007–2037 Addis Ababa.
Crummey, D. (1987) Some precursors of Addis Ababa: towns in Christian Ethiopia in the eighteenth and nineteenth centuries (pp. 24– 25). Addis Ababa: Addis Ababa City Council: Proceedings of the International Symposium on the Centenary of Addis Ababa, November 24-25, 1986.
Dobkins, L. H., & Ioannides, Y. M. (1999). Dynamic Evolution of the U.S. City Size Distribution. Discussion Papers Series, Department of Economics, Tufts University, 02155(617).
Dobkins, L., & Ioannides, Y. (2001). Dynamic evolution of the U.S. city size distribution. In J. M. Huriot, & J. F. Thisse (Eds.). Economics of Cities (pp. 217–260). Cambridge University Press.
Eaton, J., & Eckstein, Z. (1997). Cities and growth: Theory and evidence from France and Japan. Regional Science and Urban Economics, 27, 443–474(4–5).
Eberts, R. W., & McMillen, D. P. (1999). Agglomeration economies and urban public infrastructure. Handbook of Regional and Urban Economics, 3, 1455–1495.
Economist Intelligence Unit. (2012). The Green City Index: A summary of the Green City Index research series. Economist Intelligence Unit, 1–46. Ethiopian Civil Service University. (2015) State of Ethiopian Cities Report. Addis Ababa.
FDRE. A Proclamation to Provide for Urban Plans, FDRE Proclamation Number 574/2008, Negarit Gazeta (2008).
FDRE. Constitution of the Federal Democratic Republic of Ethiopia - Proclamation No. 1/1995 (1995). Addis Ababa, Ethiopia: Negarit Gazeta.
Giesen, K., Zimmermann, A., & Suedekum, J. (2010). The size distribution across all cities– double Pareto lognormal strikes. Journal of Urban Economics, 68(2), 129–137.
Guérin-Pace, F. (1995). Rank-Size Distribution and the Process of Urban Growth. Urban Studies, 32(3), 551–562.
Henderson, J. V., & Wang, H. G. (2006). Urbanization and city growth: The role of institutions. Journal of Monetary Economics, 36, 117–143 37(3), 283–313.
Ioannides, Y., & Overman, H. (2003). Zipf’s law for cities: An empirical examination. Journal of Economic Literature, 33, 1–12.
Wu, J. X., & He, L. Y. (2016). How do Chinese cities grow? A distribution dynamics approach. Physica A: Statistical Mechanics and its Applications, 15, 1–29. Ministry of Urban Development and Construction. (2012) Structure Plan Manual of Ministry of Urban Development and Construction of the Federal Democratic
Republic of Ethiopia. Addis Ababa.
Office of the Population and Housing Census Commission (1991) The 1984 Population and Housing Census of Ethiopia - Analytical Report at National Level, (December).
Pankhurst, Richard. (1982) History of Ethiopian Towns: From the Mid-19th Century to 1935. Band 17. Verag, Wiesbaden.
Core Team, R. (2013). R: A language and environment for statistical computing. Vienna, Austria: R Foundation for Statistical Computing.
Rosenthal, S. S., & Strange, W. C. (2004). Evidence on the Nature and Sources of Agglomeration Economies Stuart, 4, 2119–2171.
Schaffar, A., & Dimou, M. (2012). Rank-size City Dynamics in China and India, 1981–2004. Regional Studies, 46(6), 707–721.
Schechtman, E., & Yitzhaki, S. (2013). The Gini Methodology: A Primer on as Statistical Methodology. Springer Series in Statistics, 272New York: Springer Science+Business Mediahttps://doi.org/10.1007/978-1-4614-4720-7_17.
Schmidt, E., and Kedir, M. (2009) Urbanization and Spatial Connectivity in Ethiopia: Urban Growth Analysis Using GIS. ESSP II Working Paper, 3. Sharma, S. (2003). Persistence and stability in city growth. Journal of Urban Economics, 53(2), 300–320.https://doi.org/10.1016/S0094-1190(02)00515-6.
Soo, K. T. (2007). Zipf's Law and Urban Growth in Malaysia. Urban Studies, 44(1), 1–14.
Sutton, P. C., Taylor, M. J., & Elvidge, C. D. (2010). Using DMSP OLS imagery to char-acterize urban populations in developed and developing countries. In T. Rashed, & C. Jürgens (Eds.). Remote sensing of urban and suburban areas. Netherlands: Springer.
Tiffen, M. (2003). Transition in Sub-Saharan Africa: Agriculture, urbanization and income growth. World Development, 31(8), 1343–1366.
United Nations, Department of Economic and Social Affairs (2015) World Population Prospects: The 2015 Revision, Key Findings and Advance Tables. Working Paper No. ESA/P/WP.241 (Vol. 53).
Wang, Z., & Zhu, J. (2013). Evolution of China’s City-Size Distribution. Chinese Economy, 46(1), 38–54.
Wangbao, L., & Bohong, Z. (2004). Gini Index for Cities: A Preliminary Study on Regional Differences of Chinese City Size Distribution. Chinese Journal of Population, Resources and Environment, 2(4), 33–36.
Watson, V. (2013). African urban fantasies: Dreams or nightmares? Environment and Urbanization, 26(1), 215–231.
Woodrow Wilson International Center for Scholars (2007) Global urban poverty: Setting the Agenda. (M. M. and B. A. R. Allison M. Garland, Ed.). Washington.
Wooldridge, J. M. (2002). Econometric Analysis of Cross Section and Panel Data, 58, MIT Press752. World Bank. (2014) World Development Indicators.
World Bank. (2016) National Urban Development Spatial Plan of Ethiopia: National Urban Systems Study Final Report. Addis Ababa.
Wubneh, M. (2013). Addis Ababa, Ethiopia - Africa’s diplomatic capital. Cities, 35, 255–269.
Wubneh, Mulatu (1980). City-size distribution and urban development in Ethiopia. Afr. Urban. Stud. 37–53 Michigan State University.