Un premier aperçu de la diversité génétique de cinq
microbes eucaryotique de l’océan arctique
Mémoire
Robyn Edgar
Maîtrise en biologie
Maître ès sciences (M.Sc.)
Québec, Canada
© Robyn Edgar, 2015
Un premier aperçu de la diversité génétique de cinq
microbes eucaryotique de l’océan arctique
Mémoire
Robyn Edgar
Sous la direction de :
Connie Lovejoy, directrice de recherche
Marcel Babin, codirecteur de recherche
iii
Résumé
Malgré leur abondance, leur diversité et leur importance pour la production primaire et l'écosystème marin arctique, la diversité génétique des microbes marins eucaryotes
arctiques reste relativement inconnue. De récentes études moléculaires ont montré que les espèces florissantes dans l'Arctique sont phylogénétiquement divergentes des espèces de protistes marins non-polaires. Pour mieux à comprendre l'histoire évolutive et la diversité des espèces dans l'océan Arctique, cinq cultures de microalgues arctiques (un pélagophyte, un dictyochophyte, un chrysophyte, un cryptophyte et un haptophyte) ont été cultivées sous différentes conditions pour générer des transcriptomes de ces cinq espèces et produire une ébauche du génome du pélagophyte. L'analyse des données de transcriptomique et de génomique du pélagophyte ont démontré sa capacité génétique à utiliser l'azote organique et son aptitude à vivre sous de faibles conditions de lumière, de façon similaire à un
pélagophyte formant des floraisons dans des régions tempérées. Une analyse phylogénétique de gènes spécifiques à la physiologie photosynthétique et
non-photosynthétique a donné un aperçu de l'histoire évolutive du pélagophyte et des quatre autres protistes marins arctiques.
Abstract
Despite their abundance, diversity, importance to primary production and the Arctic marine ecosystem, the genetic diversity of Arctic marine microbial eukaryotes remains relatively unknown. Recent molecular studies have shown that the species thriving in the Arctic are phylogenetically divergent from non-polar species of marine protists. To begin to
understand the evolutionary history and genetic diversity of species from the Arctic Ocean, five Arctic microalgae isolates (a pelagophyte, dictyochophyte, chrysophyte, cryptophyte and haptophyte) were grown under a variety of conditions to generate transcriptomes of all five species and a draft genome of the pelagophyte. Analysis of the transcriptomic and genomic data of the pelagophyte revealed the genetic capacity to use organic nitrogen and live under low light conditions, similar to a temperate bloom-forming pelagophyte. A phylogenetic analysis of genes specific to both photosynthetic and non-photosynthetic physiology provided insight into the evolutionary history of the pelagophyte and the other four Arctic marine protists.
v
Table of Contents
Résumé ... iii
Abstract ... iv
Table of Contents ...v
List of Tables ... vii
List of Figures ... ix
List of Abbreviations ... xii
Acknowledgements ... xiii
Forward ...xv
1. Introduction générale ...1
1.1 Diversité microbienne ...1
1.2 Microbes eucaryotiques marins ...2
1.3 Compréhension du rôle des producteurs primaires dans l'océan Arctique ...2
1.4 Utilisation d'une approche bio-informatique pour comprendre l'évolution et la diversité physiologique d'eucaryotes microbiens marins ...4
1.4.1 État des données disponibles ...4
1.4.2 L'analyse d'expression différentielle : l'introduction de la transcriptomique dans une expérience en culture ...8
1.4.3 Comprendre la diversité des gènes d'algues et l'évolution des espèces ...8
1.5 Objectifs ...9
2. Comparative transcriptomics of an Arctic pelagophyte (CCMP2097) ...11
Résumé ...11
Abstract ...12
2.1 Introduction ...13
2.2 Methods ...15
2.2.1 Algal Cultures ...15
2.2.2 RNA and DNA Extraction and Sequencing ...16
2.2.3 Assembly ...17
2.2.4 Assessing the Genome and Transcriptome of CCMP2097 ...19
2.2.5 Differential Expression Analysis ...19
2.2.6 Assigning Putative Functions to Significantly Differentially Expressed Transcripts ...20
2.2.8 Marine Algal Viruses ... 21
2.3 Results ... 21
2.3.1 Comparative transcriptomics ... 22
2.3.3 Comparison to A. anophagefferens, a bloom-forming pelagophyte ... 25
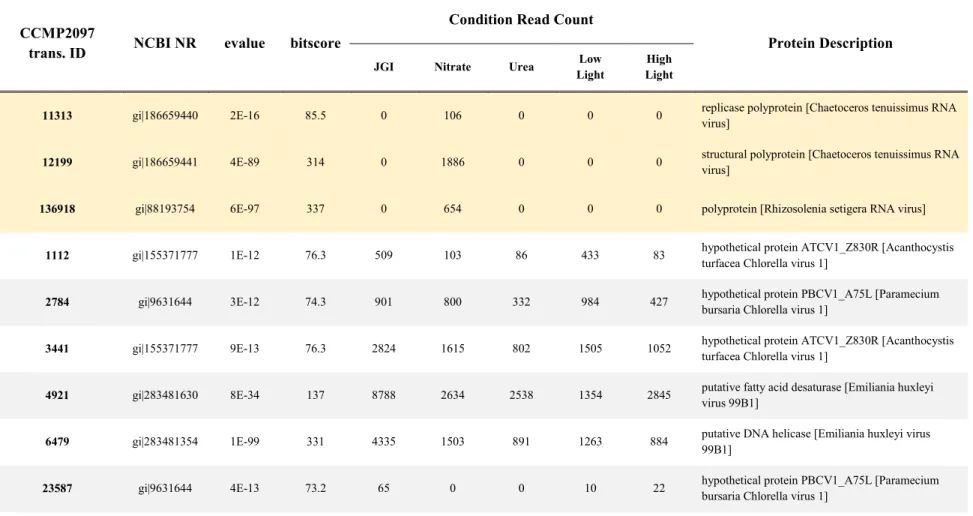
2.3.3 Indications of multiple marine algal viruses ... 26
2.4 Discussion ... 26
2.4.1 Transcriptional differences between nitrogen sources ... 27
2.4.2 Transcriptional activity under Low Light Conditions ... 28
2.4.3 Transcriptional activity under High Light Conditions ... 30
2.4.4 Arctic pelagophyte in the context of a changing Arctic Ocean ... 31
2.4.5 Marine algal virus sequences ... 33
2.5 Conclusions ... 34
3. Phylogeny of putative plastid and host originating genes in five Arctic microalgae ... 47
Résumé ... 47
Abstract ... 48
3.1 Introduction ... 49
3.2 Methods ... 50
3.2.1 Algal Cultures ... 50
3.2.2 RNA Extraction and Sequencing ... 51
3.2.3 Assembly ... 51
3.2.4 Identifying Orthologous Proteins between the Five Species ... 52
3.2.5 Phylogenetic Analysis ... 53
3.3 Results ... 54
3.4 Discussion ... 56
3.4.1 Plastid originating gene trees ... 57
3.4.2 Putative host originating gene trees ... 60
3.5 Conclusions ... 62
4. General Conclusions ... 71
Appendix A: Supplemental Materials for Chapter 2 ... 75
Appendix B: Supplemental Materials for Chapter 3 ... 117
vii
List of Tables
Table 2.1. CCMP2097 reference transcriptome transcripts with best BLAST hits to viral sequences (with an e-value cutoff of 1e-05). The top three are hits to RNA viruses. The remaining 22 are hits to DNA viruses. The read counts indicate the number of raw reads from each individual transcriptome that align back to the reference transcriptome transcript in question.
Table 3.1. The selected MMETSP and JGI datasets that were combined to create the protein database used to find homologs for phylogenetic analysis. Individual datasets for the MMETSP project can be downloaded at http://data.imicrobe.us/project/view/104 and for the JGI genomes at http://genome.jgi.doe.gov.
Table A.1. Culture conditions used to grow the Arctic pelagophyte CCMP2097 for the generation of transcriptomic and genomic data. All media was prepared using filtered (0.2 µm) seawater collected October 2006 from a depth of 500 m (70º 37.57’ N, 136º 15.21’ W). Nutrient concentrations were measured onboard the CCGS Amundsen using an
Autoanalyzer 3 (Bran & Luebe, Nordestedt, Germany). Cultures were maintained
axenically using antibiotics (25 µg . mL-1 penicillin, 20 µg . mL-1 kanamycin, 20 µg . mL-1 neomycin final concentrations) as described in Terrado et al. (2015).
Table A.2. Genomic libraries included in the Pelagophyceae sp. CCMP2097 draft genome assembly and their respective assembled sequence coverage levels in the final release. Table A.3. Quality of the CCMP2097 reference transcriptome assembly after completing each step in the transcriptome assembly pipeline. The number of sequences in the final column is the final number of contigs in the reference transcriptome assembly.
Table A.4. Assembly statistics exploring the draft genome and reference transcriptome of CCMP2097 in comparison to those of the published A. anophagefferens genome
(http://genome.jgi-psf.org). Statistics were calculated by NCGR-developed perl scripts and compiled with information from the DOE JGI.
Table A.5. The Urea condition significantly differentially expressed transcripts relative to the Nitrate condition (padj < 0.05) (meaning that if there is a positive fold change, that transcript is being up-regulated in the Urea condition and down-regulated in the Nitrate condition). All four putative protein assignments are the results of a blastp search with an evalue cutoff of 1e-05. The TargetP predictions were completed using the plant prediction option with a specificity cutoff of > 0.90 (TargetP subcellular location values: C –
Chloroplast, M – Mitochondrion, S – Secretory pathway, _ - Any other location, * - unknown).
Table A.6. The Low Light condition significantly differentially expressed transcripts relative to the Moderate Light condition (padj < 0.05) (meaning that if there is a positive fold change, that transcript is being up-regulated in the Low Light condition and down-regulated in the Moderate Light condition). All four putative protein assignments are the results of a blastp search with an evalue cutoff of 1e-05. The TargetP predictions were
completed using the plant prediction option with a specificity cutoff of > 0.90 (TargetP subcellular location values: C – Chloroplast, M – Mitochondrion, S – Secretory pathway, _ - Any other location, * - unknown).
Table A.7. The High Light condition significantly differentially expressed transcripts relative to the Moderate Light condition (padj < 0.05) (meaning that if there is a positive fold change, that transcript is being up-regulated in the High Light condition and down-regulated in the Moderate Light condition). All four putative protein assignments are the results of a blastp search with an evalue cutoff of 1e-05. The TargetP predictions were completed using the plant prediction option with a specificity cutoff of > 0.90 (TargetP subcellular location values: C – Chloroplast, M – Mitochondrion, S – Secretory pathway, _ - Any other location, * - unknown).
Table A.8. The High Light condition significantly differentially expressed transcripts relative to the Low Light condition (padj < 0.05) (meaning that if there is a positive fold change, that transcript is being up-regulated in the High Light condition and
down-regulated in the Low Light condition). All four putative protein assignments are the results of a blastp search with an evalue cutoff of 1e-05. The TargetP predictions were completed using the plant prediction option with a specificity cutoff of > 0.90 (TargetP subcellular location values: C – Chloroplast, M – Mitochondrion, S – Secretory pathway, _ - Any other location, * - unknown).
ix
List of Figures
Figure 2.1. Significantly differentially expressed transcripts in each of the four comparisons completed. Both the Urea v. Nitrate (DON v. DIN) comparison and the Low Light v. Moderate Light comparison resulted in more up-regulated transcripts than down-regulated transcripts. The High Light v. Moderate Light comparison resulted in more down-regulated transcripts than up-regulated transcripts. The High Light v. Low Light comparison resulted in more down-regulated transcripts than up-regulated. In all four comparisons, the
regulation is representative of the condition listed first relative to the condition listed second (for example HL v. LL, HL is first and LL is second therefore the expression levels are representative of High Light relative to the expression levels under Low Light).
Figure 2.2. Significantly expressed genes revealed by differential expression analysis of the urea condition transcriptome to the nitrate condition transcriptome. Each significantly expressed transcript was assigned a putative function using BLASTp with an e-value cutoff of 1e-5 against the NR database, the Pfam database, the Superfamily database, and the Tigrfam database. As this graph shows urea relative to nitrate, when the log2 fold change is negative, the transcript is down-regulated under the urea growth conditions relative to the nitrate condition and up-regulated in the nitrate condition relative to the urea condition. When the log2 fold change is positive, the transcript is up-regulated relative to urea and down-regulated relative to nitrate. Transcript ids can be located in Table A5 (Transcript ids for repeat assigned putative functions are as follows: *107274, **9904, ***154, ʄ116008, ʄʄ107979, ◊9603, ◊◊115019, ‡9794, ‡‡115446, ƚ54110, ƚƚ79011, ƚƚƚ60833, ƚƚƚƚ58101).
Figure 2.3. Significantly expressed genes revealed by differential expression analysis of the low light condition transcriptome to the moderate light condition transcriptome. Each significantly expressed transcript was assigned a putative function using BLASTp with an e-value cutoff of 1e-5 against the NR database, the Pfam database, the Superfamily database, and the Tigrfam database. As this graph shows low light relative to moderate light, when the log2 fold change is negative, the transcript is down-regulated under the low light growth conditions relative to the moderate light condition and up-regulated in the moderate light condition relative to the low light condition. When the log2 fold change is positive, the transcript is up-regulated relative to low light relative to moderate light and down-regulated under moderate light relative to low light. Transcript ids can be located in Table A6 (Transcript ids for repeat assigned putative functions are as follows: *106205, **8949, ʄ107274, ʄʄ154, ◊117002, ◊◊8353, □86926, □□2636, ‡68811, ‡‡71097, ‡‡‡65971, ƚ85768, ƚƚ846, ƚƚƚ105630, ○90201, ○○1851, ○○○2816, ●31570, ●●9898, ●●●138122). Figure 2.4. Significantly expressed genes revealed by differential expression analysis of the high light condition transcriptome to the moderate light condition transcriptome. Each significantly expressed transcript was assigned a putative function using BLASTp with an e-value cutoff of 1e-5 against the NR database, the Pfam database, the Superfamily
database, and the Tigrfam database. This graph shows high light relative to moderate light, therefore when the log2 fold change is negative the transcript is down-regulated under the high light growth condition relative to the moderate light condition and up-regulated in the moderate light condition relative to the high light condition. When the log2 fold change is positive, the transcript is up-regulated under high light relative to moderate light and
down-regulated under moderate light relative to high light. Transcript ids can be located in Table A7 (Transcript ids for repeat assigned putative functions are as follows: *3189, **3045, ***136448, ****7807, ƚ106209, ƚƚ105913, ƚƚƚ105552).
Figure 2.5. Significantly expressed genes revealed by differential expression analysis of the high light condition transcriptome to the low light condition transcriptome. Each
significantly expressed transcript was assigned a putative function using BLASTp with an e-value cutoff of 1e-5 against the NR database, the Pfam database, the Superfamily database, and the Tigrfam database. As this graph shows high light relative to low light, when the log2 fold change is negative, the transcript is down-regulated under the high light growth conditions relative to the low light condition and up-regulated in the low light condition relative to the high light condition. When the log2 fold change is positive, the transcript is up-regulated relative to high light and down-regulated under low light. Transcript ids can be located in Table A8 (Transcript ids for repeat assigned putative functions are as follows: ʄ 5030, ʄʄ 90294, ƚ 105913, ƚƚ 105552, ƚƚƚ 106209, Ɵ 79011, ƟƟ 60833, ƟƟƟ 58101, ѱ 272, ѱѱ 2985, * 8949, ** 106205, ₪ 2816, ₪₪ 1851, ∆ 99493, ∆∆ 48885, ⌂ 121379, ⌂⌂ 72869, □ 66529, □□ 2276, ◊ 117326, ◊◊ 77868, ○ 10677, ● 48651, ○○ 64717, ●● 9472, ‡ 3516, ‡‡ 3819).
Figure 2.6. BLASTn with an e-value cutoff of 1e-5 was used to compare the Aureococcus anophagefferens published genome to the Arctic pelagophyte draft genome. Using ACT the resulting homologous sequence regions were viewed (Carver et al 2005). Only BLAST hits with a percent identity of 80% or better and with a minimum alignment length of 100 bp were displayed (3066 total hits). The inset graph shows the breakdown of the BLASTn hits between the A. anophagefferens genome and the CCMP2097 draft genome.
Figure 3.1. The number of gene copies in each of the five species within a COG. (a) The number of gene copies in each of the five species within the first light harvesting complex COG. (b) The number of gene copies in each of the five species within the second light harvesting complex COG. (c) The number of gene copies in each of the five species within the first non-plastid, lipid metabolism COG. (d) The number of gene copies in each of the five species within the second non-plastid, lipid metabolism COG.
Figure 3.2. The first of the two light harvesting complex gene trees (LHC-a). The color blocks represent the taxonomy groups derived from the 18S tree. Species that grouped with the five Arctic species on the 18S tree are colored on the LHC-a tree. Bootstrap values are represented at each node with a circle whose color and size correspond to the value; larger circles are representative of higher bootstrap values. Finally, TargetP results are
represented by colored circles at the end of each tip label. Details can be found in the respective legends.
Figure 3.3. The second of the two light harvesting complex gene trees (LHC-b). The color blocks represent the taxonomy groups derived from the 18S tree. Species that grouped with the five Arctic species on the 18S tree are colored on the LHC-b tree. Bootstrap values are represented at each node with a circle whose color and size correspond to the value; larger circles are representative of higher bootstrap values. Finally, TargetP results are
xi
represented by colored circles at the end of each tip label. Details can be found in the respective legends.
Figure 3.4. The first of the two non-plastid gene trees. This COG was putatively determined to be genes identified as FA desaturases. The color blocks represent the taxonomy groups derived from the 18S tree. Species that grouped with the five Arctic species on the 18S tree are colored on the FA desaturase tree. Bootstrap values are
represented at each node with a circle whose color and size correspond to the value; larger circles are representative of higher bootstrap values. Finally, TargetP results are
represented by colored circles at the end of each tip label. Details can be found in the respective legends.
Figure 3.5. The second of the two non-plastid gene trees. This COG was putatively determined to be genes identified as FA hydroxylases. The color blocks represent the taxonomy groups derived from the 18S tree. Species that grouped with the five Arctic species on the 18S tree are colored on the FA hydroxylase tree. Bootstrap values are represented at each node with a circle whose color and size correspond to the value; larger circles are representative of higher bootstrap values. Finally, TargetP results are
represented by colored circles at the end of each tip label. Details can be found in the respective legends.
Figure A.1. The draft CCMP2097 genome is covered by 38.37% of the reference transcriptome. This histogram shows a breakdown of the coverage, with ~98% of the coverage ranging from 1-3x.
Figure B.1. This 18S tree displays the five Arctic species studied in relation to the other Marine Microbial Eukaryotic Transcriptome Sequencing Project (MMETSP) algal species studied and sequenced as well as the individually selected Joint Genome Institute (JGI) genomes contained in the manually curated database for BLAST comparison.
List of Abbreviations
18S – small eukaryotic ribosomal subunit BLAST – basic local alignment search bp – base pairs
BWA – Burrows-Wheeler aligner
CCMP – Culture Collection of Marine Phytoplankton COG – cluster of orthologous genes
DIN – Nitrate culture condition DNA – deoxyribonucleic acid
DOE JGI – Department of Energy Joint Genome Institute DON – Urea culture condition
ER – endoplasmic reticulum FA – fatty acid
HAB – harmful algal bloom HL – High Light
LHC – Light Harvesting Complex LL – Low Light
ML – Moderate Light
MMETSP – Marine Microbial Eukaryotes Transcriptome Sequencing Project NCBI – National Center for Biotechnology Information
NCGR – National Center for Genome Resources PUFA – polyunsaturated fatty acids
RNA – ribonucleic acid
rRNA – ribosomal ribonucleic acid
RuBisCO – Ribulose- 1,5-bisphosphate carboxylase/oxygenase
xiii
Acknowledgements
Before all else, I would like to thank the Gordon and Betty Moore Foundation, the Department of Energy’s Joint Genome Institute, Génome Québec, Natural Sciences and Engineering Research Council of Canada (NSERC), Canada Excellence Research Chair in Remote Sensing of Canada’s New Arctic Frontier, Fonds de recherche du Québec – Nature et technologies support for Québec-Océan, Takuvik – a partnership between University Laval and le Centre National de la Recherche Scientifique (CNRS - France), ArcticNet – a Network of Centres of Excellence of Canada, and L'Institut de biologie intégrative et des systèmes (IBIS) for the funds and resources that allowed me to complete this research.
I would like to express my utmost gratitude to Dr. Connie Lovejoy, my supervisor. I am so thankful for all that you have taught me, for providing me with amazing
opportunities – an internship in New Mexico, two trips to the Arctic, and numerous conferences and networking opportunities, and for your constant guidance and support on both my research pursuits and in life in general. I would also like to thank my
co-supervisor Dr. Marcel Babin, for both his support and insight on my research, and my committee members, Dr. Christian Landry and Dr. Guillaume Massé, for their invaluable feedback and assistance in bettering my research and helping shape the way I think as a researcher. I would like to give special thanks to both Dr. Adam Monier and Dr. Ramon Terrado for their unending advice and suggestions from a bioinformatics perspective and for their willingness to continue to help me even after they had both started jobs outside of our lab. I would like to extend my gratitude to Dr. Alex Culley for providing his insight and expertise on marine algal viruses as well as his time reviewing and editing portions of my written work. I would also like to extend a special thanks to Marianne Potvin for her
extensive work with the algae I spent my Masters studying. Without her, the data that I analyzed during my Masters would not exist!
I am especially thankful to the staff and researchers at the National Center for Genome Resources for their endless support and guidance both during and after my summer Gordon and Betty Moore Foundation internship, and to the Gordon and Betty Moore Foundation for the opportunity to participate. Thank you to Dr. Stephanie Guida and Dr. Callum Bell for dedicating their time to supervising the Moore internship. The knowledge I gained in a mere two months was astounding! I would also like to thank the NCGR for allowing me to continue using their computer infrastructure even after I had completed my internship there. I would like to thank the other student interns that I had the pleasure of meeting, working, and living with during those two months. The experience would not have been nearly as productive nor fun without them!
I would like to thank all of the members of the Lovejoy lab as well as all of the members of the Takuvik group for helping keep my spirits high and making life in Quebec exceptionally enjoyable. I would also like to thank the crew and scientists that were aboard both the CCGS Louis S. St-Laurent and the CCGS Amundsen during my two trips to the Arctic Ocean – you made an already phenomenal experience unforgettable.
Last, but certainly not least, I would like to thank my family and friends. I cannot possibly express how grateful I am to have such supportive, loving, and patient parents – you’ve kept me sane. I am thankful to have a sister that keeps me motivated and smiling. I have always relied heavily on my family and closest friends to keep me going and without them I never would have been able to complete my Masters. I count myself extraordinarily lucky. So thank you, with all of my heart.
xv
Forward
Advances in the techniques for molecular studies have made acquiring sequence data much more affordable and reliable. This has enabled further research into evolutionary history and genetic diversity of marine protists. Recent molecular studies have shown that the species thriving in the Arctic are phylogenetically divergent from non-polar species of marine protists. The two scientific chapters of this thesis aim to utilize sequence data from five phylogenetically diverse Arctic marine protists to answer questions relevant to the evolutionary history and genomic content of these species. Using this information, the broader application was to relate the findings back to the Arctic in an ecological context.
This project required a large collaborative effort to complete. The initial isolation of the five algal species studied was conducted by my supervisor, Connie Lovejoy. The proposals for sequencing at both the Joint Genome Institute and the National Center for Genome Resources were written by Connie Lovejoy. The algal cultures were grown, harvested, and the DNA and RNA was extracted by Marianne Potvin. Sequencing and assembly of these samples was completed at either the National Center for Genome Resources and at the Joint Genome Institute. I completed the combined assemblies of all transcriptomic data for each of the five algal species studied in conjunction with the National Center for Genome Resources while completing a three month long summer internship funded by the Gordon and Betty Moore Foundation in Santa Fe, New Mexico. I performed all of the bioinformatic data analysis with occasional guidance from both Ramon Terrado and Adam Monier. I was also responsible for writing all sections of this thesis. Further editing of the thesis text was completed by Connie Lovejoy. Both the second and third chapter are formatted as scientific manuscripts and will be submitted to an appropriate
journal. Over the course of my Masters, the content of this thesis was presented as both poster presentations and an oral presentation at three different conferences:
(Edgar 2014) Invited presenter: JASM 2014 (Joint Aquatic Sciences Meeting)
Transcriptional Response of the Arctic Pelagophyte CCMP2097 Edgar, R., Monier, A., Terrado, R., Lovejoy, C.
Poster Presentation, ArcticNet 2013 (Halifax, Nova Scotia)
Exploring Differential Gene Expression of Five Arctic Microbial Eukaryotes Edgar, R., Monier, A., Terrado, R., Lovejoy, C.
Poster Presentation, Québec-Océan 2012 (Montreal, QC)
Arctic’s -Omics: understanding microbial communities in the Arctic using molecular approaches and bioinformatics tools
Onda, D., Edgar, R., Joli, N., Lovejoy, C.
Prior to beginning my Masters, I participated in three research projects which went on to be published. Throughout these projects I gained bioinformatic and data analysis skills, I learned how to effectively design and execute experiments, and how to think critically about the outcomes. These skills were essential throughout the duration of my Masters. Finally, during the completion of my Masters I co-authored a paper published in the Journal of Phycology to which I contributed both data analysis and writing:
Terrado, R., Monier, A., Edgar, R., Lovejoy, C. (2015) Diversity of Nitrogen
Assimilation Pathways Among Microbial Photosynthetic Eukaryotes. Journal of Phycology: doi: 10.1111/jpy.12292.
Edgar, R., Drolet, D., Ehrman, J.M., Kaczmarska, I. (2014) Motile male gametes of the araphid diatom Tabularia fasciculata search randomly for mates. PLoS ONE 9(7): e101767.
Shtarkman, Y.M., Koçer, Z.A., Edgar, R., Veerapaneni, R. D’Elia, T., Morris, P.F., Rogers, S.O. (2013) Subglacial Lake Vostok (Antarctica) Accretion Ice Contains a Diverse Set of Sequences from Aquatic, Marine and Sediment-Inhabiting Bacteria and Eukarya. PLoS ONE 8(7): e67221.
xvii
Rogers, S.O., Shtarkman, Y.M., Koçer, Z.A., Edgar, R., Veerapaneni, R. D’Elia, T. (2013) Ecology of Subglacial Lake Vostok (Antarctica), Based on
Metagenomic/Metatranscriptomic Analyses of Accretion Ice. Biology 2(2): 629-650.
While completing my Masters, I not only broadened my knowledge and expertise in bioinformatic data analysis, but I also had the opportunity to participate in field work and sample collection onboard the CCGS Amundsen in the Fall of 2013 and the CCGS Louis S. St-Laurent in the Fall of 2014. This valuable time in the field allowed me to learn an abundance of protocols related to the initial isolation and collection of the algal strains that lead to the completion of my Masters project. This field experience also allowed me to fully appreciate the isolation and uniqueness of the Arctic environment. Beyond my research experience, completing my Masters also afforded me the opportunity to expand my leadership skill set while working as the ArcticNet Student Day Coordinator and the chance to network with leading Arctic researchers.
1
1. Introduction générale 1.1 Diversité microbienne
Les microbes sont des organismes unicellulaires qui dominent tous les écosystèmes et ils ont contribué à façonner le monde dans lequel nous vivons. Les microbes sont apparus il y a plus de 3,5 millions d'années et ils sont retrouvés dans les trois domaines de la vie (Pace 1997). Ils comprennent la totalité des Archaea et Bacteria ainsi que la majorité de la diversité des Eukarya. Les techniques moléculaires ont révélé l'énorme diversité de ces organismes (Sogin et al 2006). Jusqu'à récemment, la morphologie était le critère principal pour effectuer la classification, particulièrement pour les microbes eucaryotes (aussi
appelés protistes). Pour la plupart des espèces microbiennes eucaryotes, nos connaissances étaient basées sur des images de références et des esquisses. Les techniques moléculaires ont grandement amélioré notre compréhension de la diversité génétique de tous les types de microbes (Avise 1994). En termes de physiologie et de métabolisme, la majorité de
l'information sur les fonctions cellulaires avaient été acquises en étudiant quelques espèces modèles cultivées en laboratoire. Parmi celles-ci, on compte seulement un nombre très limité d'organismes eucaryotes, notamment l'algue verte Chlamydomonas (Harris 2001). La génomique et la transcriptomique de ces organismes modèles ont fournis de riches informations dans la génétique sous-jacente à la fonction cellulaire. Par contre, l'histoire évolutive et la diversité de la vie sur terre requiert plus d'informations que ce qui a pu être révélé par ces quelques espèces modèles. Pour avoir un meilleur portrait de l'histoire évolutive et de la diversité de la vie sur terre, on doit cultiver et étudier une plus grande diversité d'organismes qui peuvent être examinés en utilisant la génomique et la
1.2 Microbes eucaryotiques marins
L'implication des microbes eucaryotiques marins dans les cycles des nutriments océaniques les rendent importants pour les cycles biogéochimiques globaux. Ces protistes sont responsables d'environ la moitié de la fixation du carbone (Field et al 1998) et
participent activement aux cycles de l'azote (Codispoti and Christensen 1985), du soufre (Simó 2001), de la silice (Armbrust 2009), et du phosphore (Paytan and McLaughlin 2007). En raison de leur grand rôle dans la fixation du carbone, les protistes sont essentiels et soutiennent les réseaux alimentaires (Azam et al 1983) supportant les formes de vie supérieures.
Malgré que les protistes marins soient essentiels aux écosystèmes globaux, peu de génomes ou transcriptomes ont été séquencés à ce jour. Pour y remédier la « Gordon and Betty Moore Foundation » (San Fransisco, CA, USA) en collaboration avec le « National Center for Genome Resources » (Santa Fe, NM, USA) ont lancé un projet de séquençage de microbes eucaryotiques marins appelé « Marine Microbial Eukaryotes Transcriptome Sequencing Project » ou MMETSP (Keeling et al 2014). Cette entreprise massive a mis à contribution des laboratoires de partout dans le monde qui ont cultivé 306 espèces uniques (399 souches) pour créer un total de 678 transcriptomes (Keeling et al 2014). Ces jeux de données ciblaient certaines des espèces de protistes les plus abondantes dans
l'environnement ou qui avaient une importance écologique significative, afin de mieux comprendre la génétique et la diversité physiologique de ces organismes.
1.3 Compréhension du rôle des producteurs primaires dans l'océan Arctique L'océan Arctique, le plus petit des cinq océans du monde, avec seulement 14 millions de kilomètres carrés, est un environnement extrême et unique. Tout d’abord, il est physiquement isolé puisqu'il est presque complètement entouré de continent. Ensuite, il est
3
soumis à des cycles de lumière saisonniers extrêmes et ses eaux sont constamment froides. Il possède aussi de fortes haloclines en raison d'une variété d'origines de ses eaux qui ont différentes températures et salinités. Finalement, une grande proportion de sa superficie est recouverte de glace (Aagaard et al 1981, Bourke and Garrett 1987). Conséquemment à ces caractéristiques uniques et extrêmes, l'Arctique est l'hôte de plusieurs organismes
hautement adaptés qui ne sont retrouvés nulle part ailleurs. En plus des ours polaires et des morses, des espèces endémiques très connues, il y a aussi des petites espèces de
phytoplancton qui ne peuvent survivre en dehors des eaux Arctiques (Lovejoy et al 2007). En ce moment, l'océan Arctique subit de rapides changements en raison des
changements climatiques. L'étendue et l'épaisseur de glace ont drastiquement diminué au cours des dernières années ce qui a eu d'importants impacts sur l'environnement et par le fait même l'écosystème qu'il soutient (Field and Van Aalst 2014). Entre 1979 et 2012, l'étendue de la glace de mer arctique a diminué et la plupart des modèles prédisent que dans le futur on observera des étés sans glace (Wang and Overland 2009). De plus, des études récentes suggèrent une augmentation des apports riverains, qui amèneront plus d'eau douce et de matière organique dissoute (Emmerton et al 2008, Peterson et al 2002). En
conséquence à la fois de la fonte de la glace et de l'augmentation du débit des rivières, la stratification de l'Arctique est en train de changer. L'halocline, riche en nutriments, est graduellement poussée vers le bas à mesure que les apports d'eau douce dans l'océan Arctique augmentent. Par ailleurs, les eaux de surface sont exposées à de plus importants rayonnements lumineux à cause de la réduction de la surface du couvert de glace
(Yamamoto‐Kawai et al 2009). Les communautés microbiennes changent à mesure que les conditions en Arctique évoluent. Dans une étude comparant la diversité microbienne avant et après le minimum de glace observé en 2007, on montre des changements significatifs des
espèces composant les communautés ainsi qu'une diminution de la diversité dans les
populations bactériennes (Comeau et al 2011). Dans une autre étude de Li et al (2009), on a découvert qu'à mesure que la salinité de l'océan Arctique diminue, les plus petites espèces de phytoplancton (picoplancton) se développent et deviennent plus abondantes alors que la biomasse contenant de la chlorophylle demeure la même et que l'abondance d'espèces plus grosses de phytoplancton (>2 µm) diminue. Une troisième étude publiée l'année dernière montre qu'en même temps que le couvert de glace diminue, l'océan Arctique vit plus de floraisons d'algues automnales (Ardyna et al 2014). En raison de l'importance des protistes photosynthétiques dans le réseau alimentaire marin et les processus biogéochimiques, il est crucial de comprendre les communautés microbiennes qui existent dans l'océan Arctique.
La contribution de notre laboratoire au MMETSP était de fournir cinq espèces arctiques phylogénétiquement différentes comprises dans trois groupes phylogénétiques majeurs importants dans les communautés microbiennes eucaryotes arctiques : trois
stramenopiles, un haptophyte et un cryptophyte. De multiples transcriptomes de chacun de ces cinq petits flagellés eucaryotes ont été analysés avec comme but d'examiner une partie de la diversité génétique des protistes marins spécifiques à l'Arctique. De plus, une analyse plus approfondie de l'une de ces espèces a été effectuée afin de tester la réponse d'une nouvelle espèce modèle de pélagophyte à la lumière et à différentes sources de nutriments. 1.4 Utilisation d'une approche bio-informatique pour comprendre l'évolution et la diversité physiologique d'eucaryotes microbiens marins
1.4.1 État des données disponibles
Comparativement à l'immense diversité des microbes eucaryotes marins, il n'y a qu'une petite quantité de données génétiques disponibles pour ces organismes (Cuvelier et al 2010, Keeling et al 2014). Une partie de cette disparité provient de la difficulté à
5
séquencer et aligner les génomes et transcriptomes de protistes. Les protistes marins sont souvent difficiles à cultiver et ceux qui peuvent l'être sont rarement des espèces
écologiquement importantes. La taille des génomes varie selon les espèces et elle est difficile à prédire. Finalement, les génomes de protistes contiennent différentes caractéristiques spécifiques à l'espèce comme la ploïdie, le biais nucléotidique et les répétitions (Bartholomeu et al 2006).
Au-delà des différences entre les tailles de génomes et leur contenu, il existe d'autres limites méthodologiques. Plusieurs protistes sont difficiles voire impossible à cultiver. Une approche développée pour contourner cette limitation est la génomique d'une cellule unique, où une cellule isolée directement d'un échantillon environnemental est utilisée (Bhattacharya et al 2015). Par contre cette méthode reste problématique si l'intérêt réside dans la capacité de l'organisme à supporter des conditions variables. Des expériences contrôlées dans lesquelles les conditions de croissance sont modifiées sont plus difficiles à réaliser. Les études portant sur des cultures dans lesquelles les facteurs environnementaux sont altérés sont fondamentales pour obtenir un portrait plus complet des capacités
génétiques d'un organisme et, par conséquent, pour obtenir une meilleure connaissance de la diversité génétique du monde microbien.
Un autre frein au séquençage de génomes et de transcriptomes de protistes est l'assemblage des données. Le développement relativement récent des technologies de nouvelle génération de séquençage à haut débit a permis aux chercheurs d'obtenir des génomes et des transcriptomes complets pour des prix beaucoup plus bas que ce qui était précédemment possible avec la technologie à faible débit, nommée Sanger. Le désavantage des technologies de nouvelle génération est que la longueur des séquences (lectures) résultantes est significativement plus courte que celle provenant du séquençage de type
Sanger (Shendure et al 2004, Wang et al 2009). Ceci signifie que l'assemblage de séquences plus courtes en des contigs et armature (scaffold) avec une haute qualité et une haute
confiance devient un défi beaucoup plus grand qu'avec des séquences plus longues. Ce défi est plus apparent encore lors du tout premier séquençage d'un organisme. Ceci implique l'assemblage de milliards de paires de bases de courtes séquences en des contigs et armatures de très haute qualité et de hauts niveaux de confiance, le tout sans génome de référence comme méthode de contrôle de qualité. Ce n'est pas seulement un problème complexe au niveau de l'informatique, mais l'assemblage d'un génome pour la première fois avec de courtes séquences a aussi le potentiel d'introduire un biais dans les données comme sous-produit de l'algorithme de novo utilisé pour compléter l'assemblage, quel que soit l'algorithme utilisé. Pour ces raisons, le séquençage par la méthode Sanger, quoique dispendieux, reste toujours la meilleure méthode pour construire un génome de référence (Li et al 2010b). Mieux encore, combiner la technologie à haut débit et la technologie Sanger permet non seulement de créer un assemblage de qualité, mais aussi d'obtenir une meilleure profondeur de couverture en localisant les courtes lectures produites par le séquençage à haut débit sur les séquences plus longues obtenues par le séquençage Sanger. En raison du prix, de la complexité des génomes et d'autres facteurs précédemment
mentionnés, la collection de génomes de références de protistes présentement disponible reste très limitée comparativement aux génomes disponibles pour d'autres organismes.
L'utilisation des technologies de séquençage à haut débit nous a aussi permis de séquencer des transcriptomes complets avec des couvertures qui permettent d'observer de rares transcrits qui ne l'étaient pas avec les anciennes méthodes (Martin and Wang 2011). En utilisant une approche connue sous le nom de RNA-seq, qui produit des jeux de données de grande valeur, il est possible d'explorer des questions intéressantes concernant
7
l'expression différentielle de gènes sous des conditions de culture variables (Wang et al 2009). Bhattacharya et al (2015) et Martin and Wang (2011) ont tous deux discuté des présentes limites informatiques et méthodologiques de l'approche RNA-seq qui doivent être considérées lors de l'analyse de ce type de données.
Une fois l'assemblage des données obtenues complété pour des projets de génomique et de transcriptomique, les données doivent pouvoir être analysées et
l'information pertinente doit être extraite. Dans un assemblage de génome complet, il est possible d'identifier les régions codantes, les exons, les codons de départ et d'arrêt, qui donnent de l'information sur la prédiction des gènes. Il est possible de comparer les données de génomique de plusieurs organismes pour identifier les gènes homologues et orthologues qui peuvent donner un aperçu de l'histoire évolutive. Avec les données de transcriptomique, il est possible d'explorer les niveaux d'expression de gènes. Les transctiptomes provenant de différentes conditions peuvent être comparés pour en apprendre sur les niveaux
d'expression différentielle des gènes transcrits en réponse aux conditions auxquels les organismes sont soumis. Les transcriptomes peuvent aussi être utilisés pour confirmer les gènes prédits par des données de génomique. Ceci est seulement un aperçu de ce que l'on peut obtenir à partir de données de génomique et de transcriptomique, bien que les
ressources informatiques requises pour récolter cette information ne soient pas toujours simples. Une autre limite se situe au niveau du contenu des bases de données qui sont utilisées par les outils informatiques pour l'annotation. Le manque de représentants de protistes marins dans les banques de données de séquences publiques crée un biais dans les résultats obtenus et il y a un risque de tirer des conclusions basées sur des comparaisons avec des séquences de références qui sont phylogénétiquement distantes (Keeling et al 2014).
1.4.2 L'analyse d'expression différentielle : l'introduction de la transcriptomique dans une expérience en culture
À mesure que les coûts de séquençage diminuent et que les méthodes s'améliorent, l'introduction des approches de génomique et de transcriptomique dans des expériences en culture devient réalisable. En séquençant le transcriptome de différentes conditions de croissances de cultures, nous pouvons comparer l'expression des gènes en réponse à chaque condition. Ces comparaisons, typiquement accomplies en utilisant une approche d'analyse d'expression différentielle (Anders and Huber 2010, Oshlack et al 2010, Tarazona et al 2011), permettent de déduire les réactions physiologiques de l'organisme d'étude aux diverses conditions de croissance auxquelles il est soumis. Ces études sont essentielles à notre complète compréhension de la diversité génétique chez les protistes
photosynthétiques et ont déjà été utilisées pour montrer la réponse de différentes espèces à une variété de limitations nutritionnelles (Bender et al 2014, Frischkorn et al 2014). 1.4.3 Comprendre la diversité des gènes d'algues et l'évolution des espèces
Comme mentionné précédemment, l'histoire évolutive des microbes eucaryotiques marins n'est pas encore complètement comprise. Ceci est partiellement dû au manque de données, mais aussi grandement à la complexité de l'histoire évolutive de ces organismes (Lane and Archibald 2008). On sait que les protistes photosynthétiques ont acquis leurs capacités photosynthétiques grâce à un processus connu sous le nom d'endosymbiose (Bhattacharya et al 2004). Ceci signifie que les protistes photosynthétiques contiennent des gènes provenant d'au moins deux génomes. En plus des événements d'endosymbioses, il a été montré que les protistes contenaient des gènes acquis par transferts de gènes
horizontaux (Keeling and Palmer 2008) et même par transferts viraux (Monier et al 2009). Les approches phylogénétiques ont commencé à séparer ces différentes histoires et avec
9
chacun des avancements de la recherche on obtient un meilleur aperçu de la lointaine histoire évolutive des protistes photosynthétiques (Bowler et al 2008, Lane and Archibald 2008, Moustafa et al 2009, Oudot-Le Secq et al 2007, Tirichine and Bowler 2011). Alors que la quantité de données de génomique et de transcriptomique de ces organismes
augmente avec des projets comme MMETSP, plus d'informations peuvent être incorporées dans les analyses phylogénétiques, rendant l'histoire évolutive des protistes
photosynthétiques et de leurs gènes plus claire. 1.5 Objectifs
En collaboration avec le MMETSP et le « Joint Genome Institute at the
Departement of Energy » (Walnut Creek, CA, USA), nous avons produit des données de génomique et de transcriptomique de cinq protistes marins arctiques phylogénétiquement différents qui n'avaient jamais été séquencés: un pélagophyte, un dictyochophyte, un chrysophyte, un cryptophyte et un haptophyte.
Les pélagophytes sont retrouvés globalement (Worden et al 2012) et quelques espèces de pélagophytes sont connues pour être responsables de floraisons d'algues toxiques connues sous le nom de marées brunes (Gobler and Sunda 2012). Le deuxième chapitre de ce mémoire se concentre sur l'exploration de l'expression différentielle des gènes du pélagophyte arctique sous des conditions qui sont à la fois en lien avec l'Arctique changeant et aux conditions connues pour causer des marées brunes chez d'autres espèces de pélagophytes.
Le troisième chapitre prend une approche plus large en explorant les données de transcriptomique des cinq espèces. L'objectif était d'identifier des gènes orthologues retrouvés dans les cinq espèces et d'examiner la diversité fonctionnelle de ces gènes orthologues en utilisant des méthodes phylogénétiques. Le but de cette analyse est de
mieux comprendre l'histoire évolutive de gènes ayant une importance fonctionnelle à travers une variété de lignées d'algues arctiques.
11
2. Comparative transcriptomics of an Arctic pelagophyte (CCMP2097) Résumé
La classe des Pelagophyceae est une classe de phytoplancton microbien marin distribuée mondialement, qui contient des espèces connues pour former des floraisons dans des régions océaniques côtières tempérées, spécifiquement dans des régions avec peu de lumière et de fortes concentrations en azote (N) organique. L'océan Arctique est un environnement extrême polaire où des pélagophytes formant des floraisons d'algues toxiques n'ont pas encore été observés. L'océan Arctique subit des changements en raison des réchauffements climatiques : une augmentation dès l’apport en azote organique riverain a été observée et la disponibilité lumineuse dans l'halocline riche en nutriments diminue à mesure que celle-ci est repoussée plus en profondeur en raison de l'augmentation de l'épaisseur de la couche de mélange de surface. Le transcriptome et une ébauche du génome de la culture CCMP2097, un pélagophyte arctique isolé au nord de la Baie de Baffin, ont été séquencés et analysés pour commencer à comprendre la diversité génétique des pélagophytes arctiques. Il a été démontré que, comme plusieurs espèces de
pélagophytes des régions tempérées, CCMP2097 possède la capacité génétique de croître dans en utilisant l'azote organique comme source d'azote et qu'il est capable d'effectuer la photosynthèse sous de faibles conditions lumineuses. De plus, il a été suggéré que de fortes conditions lumineuses pouvaient déclencher des réponses photo-protectrices chez
Abstract
Pelagophyceae are a globally distributed class of marine microbial phytoplankton with species that are known to form blooms in temperate coastal oceans, specifically in areas with low light and high organic nitrogen (N) concentrations. The Arctic Ocean is an
extreme polar environment that has yet to see any pelagophytes form harmful algal blooms. The Arctic Ocean is undergoing changes due to climate warming; increased organic N inputs from rivers have been observed, and the light availability in the nutrient rich
halocline is decreasing as it is pushed deeper by the increasing thickness of the upper mixed layer. The transcriptome and draft genome of CCMP2097, an Arctic pelagophyte isolated from the Northern Baffin Bay, were sequenced and analyzed to begin to understand the genetic diversity of Arctic pelagophytes. It was found that much like the temperate species of pelagophytes, CCMP2097 has the genetic capacity to grow using organic nitrogen as a nitrogen source and is capable of photosynthesizing under low light conditions.
Additionally, high light conditions were suggested to trigger photo-protective responses in CCMP2097.
13
2.1 Introduction
Pelagophyceae are a class of photosynthetic microbial eukaryotes within the stramenopiles (Adl et al 2012, Andersen et al 1993). In addition to early microscopy studies indicating that pelagophytes are common in coastal regions (Andersen et al 1993), more recent molecular studies have shown that they are globally distributed, notably in the temperate and tropical Atlantic Ocean (Jardillier et al 2010, Worden et al 2012). In
addition, Pelagophyceae have been reported from across the Arctic Ocean using 18S rRNA gene clone libraries and Sanger sequencing (Lovejoy et al 2006, Piwosz et al 2015, Schmidt and Schaechter 2011) and high throughput amplicon surveys indicate that they are nearly always present in the Arctic Ocean euphotic zone (Comeau et al 2011, Lovejoy 2014).
The two most important factors in the growth of phytoplankton are light and nutrient availability (Codispoti et al 2013). Pelagophytes living in the Arctic Ocean
experience large fluctuations in both of these. Light availability in the water column of the Arctic Ocean goes from constant summer irradiance to none in winter. In addition to seasonal light cycles, variable ice-cover, snow on ice, and weather and atmospheric conditions all influence transmittance of light to the water surface (Frey et al 2014). However, for phytoplankton to be able to utilize light when it is available for
photosynthesis and net growth, they must also have access to the necessary nutrients (most importantly nitrogen and phosphorus). Nutrient availability in the euphotic zone of the Arctic Ocean is influenced by water column stratification and other physical oceanographic processes linked to circulation (Codispoti et al 2013). Both light and nutrient availability are also influenced by mixing events such as wind mixing, tidal mixing, and eddies (Codispoti et al 2013).These physical oceanographic conditions are becoming more unpredictable as the Arctic Ocean is subjected to climate change. A warming Arctic has
also resulted in increasing river flows into the Arctic Ocean, these waters are rich in humic material that may be both a source of organic nitrogen and act to decrease light penetration (Emmerton et al 2008, Pavlov et al 2015). Multiyear ice-cover is decreasing, and as a result the upper mixed lay of fresher waters is becoming thicker and the nutrient rich halocline pushed deeper (Yamamoto‐Kawai et al 2009). This net result is that nutrients may remain below the euphotic zone over the summer growing season (Monier et al 2014).
Aside from 18S rRNA surveys, our knowledge of Arctic pelagophytes is limited. A study exploring the evolutionary relationships of nitrogen transporters in Arctic microbial photosynthetic eukaryotes is the only study to date providing any insight into the gene diversity an Arctic pelagophyte (Terrado et al 2015). Beyond this, there is nothing known about the genetic capacity of pelagophytes in the Arctic under the conditions typical of the environment. In contrast, two non-polar pelagophyte species are well studied (Aureococcus anophagefferens and Aureoumbra lagunensis) and both are considered harmful algal bloom (HAB) species. Both bloom under conditions in which light and inorganic nutrients are limiting for other phytoplankton species, and they are specifically able to use organic nitrogen (Dong et al 2014, Frischkorn et al 2014, Gobler et al 2011, Gobler and Sunda 2012, Sun et al 2012, Wurch et al 2011).
Here we examined the gene expression of a pelagophyte (CCMP2097) originally isolated from Northern Baffin Bay (77.0014° N, 77.2383° W), which is between Greenland and Ellesmere Island. To this end transcriptomes from three light conditions and two different nitrogen sources (nitrate only and urea only) were generated as well as a draft genome of CCMP2097. These conditions were relevant to current and future Arctic Ocean conditions, including those where light or inorganic nitrogen is limited; conditions that are associated with A. anophagefferens and A. lagunensis forming blooms. For each condition,
15
we generated and examined transcriptomes to search for genes that were differentially expressed between growth conditions. Differential expression analysis enables the identification of genes that are significantly expressed specific to a growth condition. These findings can then be used to focus further ecological research directions and
hypothesize possible implications in an ecological context (Dong et al 2014, Frischkorn et al 2014). Our aim was to determine the genetic expression of CCMP2097 relative to the specific conditions and gain insight into the gene diversity that would enable this
pelagophyte to adapt to varying light and nutrient conditions in the Arctic Ocean. In addition to searching for algal genes we also surveyed the draft genome and transcriptomes of CCMP2097 for evidence of algal-infecting viruses. Viruses may
influence diversity and population dynamics in oceanic microbes, including algae (Beltrami and Carroll 1994, Weitz and Wilhelm 2012). Since, algal-infecting viruses are reported to infect several bloom forming algae it has been hypothesized that viruses play a role in harmful algal bloom dynamics (Beltrami and Carroll 1994, Nagasaki 2008, Weitz and Wilhelm 2012). However, despite extensive work on HAB pelagophytes, currently there are no published reports of pelagophyte-infecting viruses.
2.2 Methods
2.2.1 Algal Cultures
The Arctic pelagophyte CCMP2097 was initially isolated from Northern Baffin Bay in June 1998 using a selection-dilution technique in which enrichment cultures were
transferred to different media in 24 well plates until a single species was isolated.
CCMP2097 has been maintained as a single mono-algal culture at ca. 4 °C since isolation. Cell size was measured using an ocular micrometer on an inverted OlympusIX71
microscope (OLYMPUS Optical Co., Ltd., Shibuya-ku, Tokyo, Japan). Prior to growing the sub-cultures used for DNA and RNA sequencing, the culture was transferred to media with added antibiotics to eliminate or at least minimize bacterial contaminants. CCMP2097 was grown under five different culture conditions; urea as a nitrogen source, nitrate as a nitrogen source, high light (HL), low light (LL), and a standard, as described in Terrado et al (2015) (Table A.1). RNA was collected for the sequencing of a transcriptome from each of these five conditions at late exponential phase, as described in Terrado et al (2015). DNA was collected from the standard condition for whole genome sequencing following the Department of Energy’s Joint Genome Institute’s (DOE JGI) protocols
(http://jgi.doe.gov/collaborate-with-jgi/pmo-overview/protocols-sample-preparation-information/).
2.2.2 RNA and DNA Extraction and Sequencing
RNA extraction, library preparation, and sequencing was as described in Terrado et al (2015) for each of the transcriptomes. Sequencing of 50 bp paired-end reads for the urea, nitrate, HL, and LL conditions was carried out on an Illumina HiSeq 2000 at the National Center for Genome Resources (NCGR) (Santa Fe, New Mexico, USA) as part of the Marine Microbial Eukaryotes Transcriptome Sequencing Project (Keeling et al 2014).
For the draft genome and JGI transcriptome, cells were harvested from the batch culture in late exponential phase by centrifuging at 3000g for 30 minutes at 4°C.
Supernatant was discarded and pellets were frozen in liquid nitrogen and stored at -80°C until nucleic acid extraction. DNA extraction was performed using a DNA plant mini kit (QIAGEN). For the JGI transcriptome, RNA extraction was performed using an RNAeasy mini kit (QIAGEN). Sequencing of the 100 bp paired-end reads for the transcriptome and
17
500 bp paired-end reads for the draft genome was carried out on an Illumina HiSeq 2000 by DOE JGI.
2.2.3 Assembly
2.2.3.1 JGI Transcriptome
The assembly of the DOE JGI standard condition transcriptome was completed using the Rnnotater pipeline (version 2.5.3) (Martin et al 2010). The Rnnotater pipeline contains preprocessing steps to remove low quality reads and adaptors, followed by a de novo
assembly with Velvet. Velvet was run a total of eight times with varying k-mer lengths (95, 89, 83, 77, 71, 65, 59, 53) to complete the assembly of the raw reads (Zerbino and Birney 2008). Redundancies were removed from the resulting dataset using Vmatch v. 2.1.6 (Kurtz 2003). Finally a secondary assembly was generated with Minimus2 (overlap of 40) to combine contigs with significant overlaps, followed by single base pair correction step with BWA to map reads back to the final assembly (Sommer et al 2007).
2.2.3.2 MMETSP Transcriptomes
De novo transcriptomes for the Urea, Nitrate, HL, and LL transcriptomes were assembled at the NCGR with their in-house pipeline. Raw reads were preprocessed using the SGA assembler’s preprocessing step (Simpson and Durbin 2012). Following
preprocessing, an initial assembly step was performed with ABySS v. 1.3.2 (run 20 times with varying k-mer lengths ranging from 26-50) (Simpson et al 2009). Redundancies were removed with CD-Hit using a similarity parameter of 98% (Fu et al 2012, Li and Godzik 2006). A secondary assembly was then generated with the output from CD-Hit using CAP3 (overlap of 100) (Huang and Madan 1999). Scaffolding was performed using BWA and ABySS, followed by a gap closing step using SOAPdenovo GapCloser (Li and Durbin 2009, Li et al 2010a, Li et al 2010b, Luo et al 2012). Finally a minimum length filter of
150 bp was applied and CD-Hit was run a second time to remove any residual
redundancies. For the comparative expression analysis the Nitrate transcriptome was considered a moderate light (ML) treatment, since light level was the only variant between the Nitrate, HL, and LL culture conditions (Table A.1).
2.2.3.3 Genome
The draft genome assembly was completed by the DOE JGI. A total of 248,013,292 reads (Table A.2) were assembled using a modified version of ARACHNE v. 20071016 (Jaffe et al 2003). Scaffolds were removed if they consisted of >95% 24mers that occurred 4 or more times in scaffolds larger than 50Kb, were less than 1Kb in length, or were
alternative haplotypes composed of <10Kb scaffolds aligning at >=95% identity and >=95% coverage in a scaffold >10Kb. Finally scaffolds were binned into categories based on their sequence content. Contamination was identified using BLASTn (Altschul et al 1990) against the NCBI nucleotide collection (NR/NT) and BLASTx using a set of known microbial proteins. Additional scaffolds were classified as mitochondrion, repetitive, alternative haplotypes, and chloroplast.
2.2.3.4 Reference Transcriptome
A reference transcriptome was created by combining the final DOE JGI transcriptome with the 20 ABySS assemblies from each of the four MMETSP transcriptomes. This combined data was then run through the same pipeline as was
previously described for the MMETSP transcriptomes, starting at the first CD-Hit step, for a final reference transcriptome to be used for differential expression analysis. The quality of the assembly is summarized in stages in Table A.3.
19
2.2.4 Assessing the Genome and Transcriptome of CCMP2097
The draft Arctic pelagophyte genome and reference transcriptome were analyzed using NCGR-developed sequence analysis tools to compare basic statistics such as GC content and N50’s of the genomes and transcriptome (Table A.4). To assess the portion of the draft CCMP2097 genome being transcribed, the reference transcriptome was mapped back to the draft genome using BWA and BedTools v. 2.17.0 was used to gain further insight into the coverage and depth of coverage (Quinlan and Hall 2010, Quinlan 2014). 2.2.5 Differential Expression Analysis
Read counts were generated for each of the MMETSP transcriptomes by mapping the raw reads for each transcriptome back to the reference transcriptome using Bowtie and RSEM v. 1.1.10 with default parameters (Li and Dewey 2011). The non-normalized counts were then doubled to account for paired-end reads, and the resulting decimal number was rounded to the nearest whole number. Finally a correction factor (a data transformation in the form of +1 to all raw read counts) was applied to counter zero read counts and avoid missing any potentially interesting values when computing differential expression. A similar method of correction is employed by software packages such as edgeR (Robinson et al 2010).
Differential expression analysis was completed using the Bioconductor v. 2.13 package DESeq (Anders and Huber 2010). DESeq was run according to the standard vignette for non-replicate datasets, which makes the assumption that the mean read counts are a good predictor for the dispersion of the dataset (Anders and Huber 2010). To
determine the gene expression of CCMP2097 under the two nitrogen sources, the read counts of the Urea transcriptome were analyzed versus the read counts of the NCGR Nitrate transcriptome. To assess the transcript expression relative to light, the read counts of the
LL transcriptome were analyzed in comparison to the read counts of the ML transcriptome. The HL transcriptome was also compared to the read counts of the ML transcriptome. Finally the HL transcriptome was compared to the LL transcriptome. Differentially expressed transcripts with a p-adjusted value of ≥0.05 were considered significant.
2.2.6 Assigning Putative Functions to Significantly Differentially Expressed Transcripts The significantly differentially expressed transcripts from each of the four
comparisons (urea vs nitrate, LL vs ML, HL vs ML, and HL vs LL) were run through ESTscan using the Bacillariophyta matrix to predict coding regions (Iseli et al 1999). The predicted coding regions were annotated with BLASTp against the NCBI non-redundant protein (NR) database with an e-value cut-off of 1e-05 (Boratyn et al 2013). Additionally the predicted coding regions were run through HMMscan against the Pfam, Superfamily, and Tigrfam databases (Bateman et al 2004, Eddy 2011, Finn et al 2011, Gough et al 2001, Mavromatis et al 2009). Each of the four resulting annotations were parsed for best hits so that at most each transcript was given one functional assignment from Pfam, Superfamily, Tigrfam, and NCBI NR (Tables A.5, A.6, A.7, and A.8). To further examine the role of the predicted proteins in the cell, TargetP was run on each set of significantly differentially expressed predicted proteins (Emanuelsson et al 2007). TargetP was run with the plant prediction model using a specificity cutoff of ≥ 0.90 (Tables A.5, A.6, A.7, and A.8). 2.2.7 LHCs and organic nitrogen degradation in CCMP2097
2.2.7.1 Genome Comparisons
BLASTn with an e-value cutoff of 1e-05 was used to compare the draft CCMP2097 genome to the published A. anophagefferens genome. The BLAST output was then viewed with ACT to visually assess the overall coverage of the homologous regions (Carver et al 2005).
21
2.2.7.2 Light Harvesting and Organic Nitrogen Degradation Comparisons
To determine if CCMP2097 shared a similar genetic capacity for organic nitrogen degradation and light harvesting with A. anophagefferens, gene sets described in Gobler et al (2011) were compared to the CCMP2097 draft genome and reference transcriptome using BLASTp with an e-value cut-off of 1e-05. The results files were then parsed for best hits so as to avoid redundant results.
2.2.8 Marine Algal Viruses
The CCMP2097 draft genome and reference transcriptome were both run through ESTscan using the Bacillariophyta matrix to predict protein coding regions. The predicted protein coding regions were then compared to the NCBI NR database using BLASTp with an e-value cutoff of 1e-05. The results were then searched for sequences with best hits to known viruses.
2.3 Results
The average diameter of the CCMP2097 was 7.9 µm. The draft genome produced by JGI was 91.59 Mb (Table A.4). The reference transcriptome generated by combining all five CCMP2097 transcriptomes was 49.32 Mb (Table A.4). After mapping the
CCMP2097 reference transcriptome back to the draft genome, we determined that 38.37% of the draft genome was transcribed. The variation in the depth of coverage across the transcribed regions of the genome indicated that a majority of the coverage had a depth of coverage of 1-3x (Figure A.1).
2.3.1 Comparative transcriptomics
2.3.1.1 Urea compared to Nitrate as a nitrogen source
A total of 85 genes were significantly differentially expressed (with a p-adjusted value of 0.05 or better) when urea was the sole nitrogen source compared to the nitrate as the sole nitrogen source. Of those 85 transcripts, 58.8% were up-regulated and 41.2% were down-regulated (Figure 2.1). Of these, we were able to assign a putative function to 46 of the transcripts with an e-value of 1e-05 or better (Table A.5). The expression levels of the significantly expressed transcripts that were assigned a putative function paired with their predicted subcellular location and assigned functions (Figure 2.2) provided the first insight into the genetic transcription of CCMP2097 with urea as a nitrogen source versus nitrate. Among the transcripts assigned a putative function, nearly all photosynthesis-related predicted proteins were up-regulated (with the exception of two out of three fucoxanthin chlorophyll a/c binding proteins). The two transcripts assigned putative functions related to the degradation of organic nitrogen were both up-regulated when grown under Urea only conditions. The two transcripts that were assigned functions related to nitrogen metabolism were both down-regulated under Urea, and therefore up-regulated under Nitrate. There was one transcript associated with carbohydrate metabolism and one transcript associated with phosphate metabolism, both of which were down-regulated when grown with urea. Finally transcripts related to DNA/RNA regulation and other cellular functions showed both down and up-regulation under Urea.
2.3.1.2 Low Light compared to Moderate Light
For the light level comparisons the Nitrate transcriptome was treated as a Moderate Light transcriptome since the light level was between those used for the Low and High Light growth conditions (Table A.1). The differential expression analysis showed that the
23
Low Light condition resulted in more up-regulation than down-regulation when compared to both the Moderate Light condition and the High Light condition (Figure 2.1).
Additionally, the Low Light condition resulted in more than double the number of
significantly expressed transcripts (225) than the High Light condition did (87) when each was compared to the Moderate Light condition (with a p-adjusted value of ≤ 0.05) (Figure 2.1). Of the 225 significantly differentially expressed Low Light v. Moderate Light transcripts, 61.3% were up-regulated and 38.6% were down-regulated.
Putative functions were assigned to 69 of the 225 significantly expressed transcripts in the LL v ML comparison (with an e-value cutoff of 1e-05) (Table A.6). The assigned putative functions and expression levels as well as the predicted subcellular location of the significantly differentially expressed transcripts under the Low Light condition relative to the Moderate Light condition are explored in Figure 2.3.
Under Low Light conditions, all organic nitrogen degradation and nitrogen
metabolism related transcripts were down-regulated relative to Moderate Light. There were a total of 9 putative photosynthesis-related predicted proteins that were significantly
differentially expressed in the LL v. ML comparison. Of these 9, only two were up-regulated in the Low Light condition relative to the Moderate Light condition. With the exception of an ethylene-forming enzyme, all hydrocarbon metabolism related transcripts were up-regulated under Low Light relative to Moderate Light (Figure 2.3). There was also up-regulation of a transcript assigned the function (trans)glycosidases under Low Light. Finally, the transcripts that were identified as DNA/RNA regulators and other general cellular functions were both up and down-regulated relative to Low Light with no major trends in either direction.