Measurement of permafrost greenhouse gas emissions
through a new automated system of closed chambers
Mémoire
Samuel Gagnon
Maîtrise en sciences géographiques
Maître en sciences géographiques (M. Sc. Géogr.)
Québec, Canada
R
ÉSUMÉ
Le réchauffement de l’Arctique a le potentiel d’affecter le climat global par le dégel du pergélisol engendrant des émissions accrues de gaz à effet de serre (GES). Ces émissions sont cependant difficiles à quantifier puisque les méthodes conventionnellement utilisées sont généralement onéreuses et souvent très laborieuses. À l’aide d’un nouveau système automatisé de chambres fermées développé pour cette étude, ce projet visait à mesurer les émissions de GES provenant du pergélisol dans une tourbière située à Salluit, au Nunavik. Les émissions ont été quantifiées sous différentes conditions environnementales afin de simuler le réchauffement climatique et déterminer les effets des variations spatiales sur les émissions de GES. Les résultats démontrent que le nouveau système produit des résultats comparables à ceux obtenus avec un système commercial existant. La température était le principal facteur affectant la variabilité de la ER et les plus grandes émissions de GES provenaient du site saturé en eau.
Mots-clés: Pergélisol, Arctique, Changements climatiques, Toundra, Tourbière polygonale,
Respiration de l’écosystème, Chambre fermée, Gaz à effet de serre, Décomposition, Réchauffement expérimental
A
BSTRACT
Warming in the Arctic has the potential to affect the global climate through permafrost thaw leading to increased greenhouse gas (GHG) emissions. However, these emissions are difficult to quantify because the methods conventionally used are often prohibitively expensive and time-consuming. With a new automated system of closed chambers developed for this study, this project aimed to measure permafrost GHG emissions in a polygonal peatland located near Salluit, Nunavik. The emissions were quantified under different environmental conditions in order to simulate climate warming and to determine the effect of spatial variability on GHG emissions. Results show that the new system yields results comparable to those obtained with an existing commercial system. Temperature was the principal factor influencing ecosystem respiration variability and the largest GHG emissions were measured on the water-saturated plot.
Keywords: Permafrost, Arctic, Climate change, Tundra, Polygonal peatland, Ecosystem
T
ABLE OF CONTENTS
RÉSUMÉ ... III ABSTRACT ... V TABLE OF CONTENTS ... VII LIST OF TABLES ... IX LIST OF FIGURES ... XI LIST OF SYMBOLS ... XIII REMERCIEMENTS ... XV
1. INTRODUCTION ... 1
2. MATERIALS AND METHODS ... 5
2.1. STUDY SITE AND MEASUREMENT PERIOD ... 5
2.2. INSTRUMENTATION ... 9
2.2.1. Automated system of closed chambers ... 9
2.2.2. Natural variability plots ... 12
2.3. METHODS ... 13
2.3.1. Automated measurements ... 13
2.3.2. Manual measurements ... 14
2.3.3. Data sorting ... 20
2.3.4. Statistical analyses ... 21
2.3.5. Calculation of the Q10 temperature coefficient ... 22
3. RESULTS ... 25
3.1. ENVIRONMENTAL DATA ... 25
3.2. VEGETATION COVER... 29
3.3. LOW-COST SENSORS ... 29
3.4. PERFORMANCE OF THE AUTOMATED CHAMBERS ... 31
3.5. ECOSYSTEM RESPIRATION ... 36
3.6. Q10 TEMPERATURE COEFFICIENT... 40
3.7. SEASONAL MEASUREMENTS ... 42
3.8. METHANE EMISSIONS ... 43
4. DISCUSSION ... 46
4.1. PERFORMANCE OF THE NEW SYSTEM ... 46
4.1.1. Measurement of ecosystem respiration ... 46
4.1.2. Effects of the automated chambers on the environment ... 48
4.1.3. Stability of CO2 fluxes with the automated chambers ... 49
4.1.4. Measurement of methane emissions ... 50
4.2. ECOSYSTEM RESPIRATION OF EACH PLOT ... 50
4.2.1. Natural conditions (Cn) ... 50
4.2.2. Warming-induced conditions (COTC) ... 51
4.2.3. Water-saturated conditions (Csat) ... 52
4.3. ENVIRONMENTAL VARIABLES AFFECTING ECOSYSTEM RESPIRATION ... 56
4.3.1. Temperature ... 56
4.3.2. Water table depth and rainfall ... 60
4.3.3. Active layer thickness, volumetric water content and relative light level ... 63
4.4. NATURAL VARIABILITY PLOTS AND SEASONAL MEASUREMENTS ... 65
4.5. METHANE EMISSIONS ... 66
4.5.1. Environmental variables affecting methane emissions ... 67
5. CONCLUSIONS... 69
6. REFERENCES ... 73
APPENDIX I. RESULTS OF THE TWO-FACTOR ANOVA WITH TWO-WAY REPEATED MEASURE ... 87
L
IST OF TABLES
TABLE 1. SUMMARY OF ALL THE PLOTS ... 18
TABLE 2. AVERAGE SOIL SURFACE TEMPERATURE AND AVERAGE VOLUMETRIC WATER CONTENT ... 26
TABLE 3. VEGETATION COVER OF THE SPECIES PRESENT ON EACH PLOT ... 30
TABLE 4. PART OF THE TWO-FACTOR ANOVA WITH TWO-WAY REPEATED MEASURE ... 32
TABLE 5. AVERAGE ECOSYSTEM RESPIRATION OF THE AC PLOTS ... 36
TABLE 6. PEARSON’S CORRELATION COEFFICIENTS ... 38
TABLE 7. ENVIRONMENTAL VARIABLES AFFECTING ECOSYSTEM RESPIRATION ... 39
TABLE 8. RESULTS OF THE MIXED MODEL REGRESSION ... 39
TABLE 9. AVERAGE ECOSYSTEM RESPIRATION MEASURED DURING THE SEASONAL MEASUREMENTS ... 42
TABLE 10. AVERAGE DRY BIOMASS ... 43
L
IST OF FIGURES
FIGURE 1. LOCATION OF THE STUDY SITE ... 6
FIGURE 2. THE POLYGONAL PEATLAND IN THE WEST-FACING VALLEY. ... 7
FIGURE 3. THE FOUR PLOTS WITH THE AUTOMATED CHAMBERS... 8
FIGURE 4. EXAMPLES OF NATURAL VARIABILITY PLOTS (NVP) ... 9
FIGURE 5. PHOTOGRAPHS OF ONE CHAMBER IN THE OPEN AND CLOSE POSITIONS ... 10
FIGURE 6. INSIDE OF AN AUTOMATED CHAMBER ... 11
FIGURE 7. PORTS ON THE CHAMBERS ... 12
FIGURE 8. PLOT AND SUB-PLOTS IN VEGETATION-FREE CONDITIONS ... 15
FIGURE 9. THE AUTOMATED CHAMBERS AND THE PIEZOMETERS ... 17
FIGURE 10. OVERALL SOIL SURFACE TEMPERATURE FOR EACH PLOT ... 27
FIGURE 11. VARIATIONS OF VOLUMETRIC WATER CONTENT THROUGHOUT THE SUMMER ... 28
FIGURE 12. DAILY RAINFALL, WATER TABLE DEPTH AND ACTIVE LAYER THICKNESS ... 28
FIGURE 13. RELATIONSHIP BETWEEN ECOSYSTEM RESPIRATION MEASURED WITH THE LOW-COST K-30 CO2 SENSOR AND THE INFRARED GAS ANALYZER EGM-4 ... 31
FIGURE 14. RELATIONSHIP BETWEEN ECOSYSTEM RESPIRATION MEASURED ON ALL PLOTS WITH THE AUTOMATED CHAMBERS AND THE COMMERCIAL CHAMBER ... 33
FIGURE 15. RELATIONSHIP BETWEEN ECOSYSTEM RESPIRATION MEASURED ON EACH PLOT WITH THE AUTOMATED CHAMBERS AND THE COMMERCIAL CHAMBER ... 34
FIGURE 16. CHANGE WITH TIME OF ECOSYSTEM RESPIRATION AND SOIL SURFACE TEMPERATURE ... 35
FIGURE 17. BOXPLOT OF ECOSYSTEM RESPIRATION ... 37
FIGURE 18. TEMPERATURE SENSITIVITY OF ECOSYSTEM RESPIRATION FOR EACH PLOT ... 40
FIGURE 19. TEMPERATURE SENSITIVITY OF ECOSYSTEM RESPIRATION OF THE AC PLOTS ... 41
FIGURE 20. CHANGE WITH TIME OF CH4 FLUXES ON THE WATER-SATURATED PLOT (Csat) ... 45
FIGURE 21. CHANGE WITH TIME OF ECOSYSTEM RESPIRATION AND WATER TABLE DEPTH ... 62
L
IST OF SYMBOLS
AC : Automated chamber ALT : Active layer thickness
COTC : Plot in warming-induced conditions Cn : Plot in natural conditions
Csat : Plot in water-saturated conditions Csoil : Plot in vegetation-free conditions EGM-4 : Infrared gas analyzer EGM-4 ER : Ecosystem respiration
NVP: Natural variability plot
OTC / OTC1-2-3 : Open-top chamber / natural variability plot in an OTC RLL : Relative light level
SRC-1 : Commercial chamber SRC-1 Tair : Air temperature
Tsoil : Soil surface temperature
VAR1-2-3 : Natural variability plot in natural conditions VWC : Volumetric water content
R
EMERCIEMENTS
Je tiens d’abord à remercier mon directeur de recherche, Michel Allard, pour son soutien et sa confiance. Ses conseils judicieux et son ouverture d’esprit m’ont permis d’entreprendre un projet ambitieux et de le mener à bien. Je remercie également Esther Lévesque, ma co-directrice, pour ses idées, sa souplesse et ses encouragements, et Martin Simard, troisième membre de mon comité de révision, pour ses suggestions.
Mes remerciements s’adressent également au personnel du Centre d’études nordiques qui travaille coude à coude pour offrir à ses membres un support logistique incroyable. Merci à Emmanuel L’Hérault et Mickaël Lemay pour les innombrables heures passées sur le développement du nouveau système et sans qui la réalisation de mon projet aurait été impossible. Merci aussi à Jonathan Roger pour son aide sur le terrain et son support moral.
Je suis également reconnaissant à Isabelle Laurion, Julien Fouché et Aurélien Nicosia pour leurs précieux conseils et leur aide pour le traitement de mes données et les analyses en laboratoire.
Je remercie aussi les organismes subventionnaires (CRSNG, FQRNT, EnviroNord) qui m’ont permis de me consacrer entièrement à mes études.
Finalement, merci à ma famille, mes amis et collègues pour leurs encouragements et leur intérêt pour ma recherche.
1. I
NTRODUCTION
Over the past 30 years, the northern high latitudes have experienced an increase in surface temperatures greater than any other part of the world (McBean et al., 2005; Turner et al., 2007). With the Arctic average temperature rising at almost twice the rate as the rest of the world over a few decades (ACIA, 2004), it has been observed that mean surface temperatures have increased by approximately 5°C during the 20th century (Anisimov et al., 2007) and that permafrost mean temperatures have risen by up to 2°C during the last decades (ACIA, 2004). Strong evidences that this warming has already had significant consequences on Arctic climate and environments begin to accumulate (e.g. Serreze et al., 2000; Hinzman et al., 2005; Anisimov et al., 2007; Lemke et al., 2007). In addition, the effects of climate change on the northern latitudes are not expected to stop anytime soon, as it is estimated that the Arctic will be the region the most severely affected by global warming over the next century (Chapin et al., 2005; Davidson & Janssens, 2006).
Permafrost degradation caused by climate change has been well documented notably because of the concern created by the large amounts of carbon it contains. Northern high latitudes hold the world’s largest soil organic carbon reservoir with a total estimated content of 1672 PgC (1 PgC = 1015 grams of carbon) (Tarnocai et al., 2009). This carbon represents approximately half of the earth’s belowground organic carbon pool (Tarnocai et
al., 2009), twice the atmospheric carbon pool (Gouttevin et al., 2012) and almost twice the
carbon found in total world forest biomass (Pan et al., 2011). Although Arctic soil carbon currently does not contribute to the accumulation of carbon in the atmosphere (Field et al., 2007; McGuire et al., 2009), projected changes in climate are likely to cause widespread permafrost thaw, leading to carbon degradation due to enhanced soil respiration, wetland formation and disappearance, thermokarst processes and fires (Davidson & Janssens, 2006; Walter et al., 2006; Schuur et al., 2008, 2009; Schuur & Abbott, 2011). Mainly released in the form of carbon dioxide (CO2) and methane (CH4), carbon emissions from the degradation of organic matter contained in permafrost has the potential to amplify the greenhouse effect (Zhuang et al., 2006; Khvorostyanov et al., 2008; Koven et al., 2011; Schaefer et al., 2011; Burke et al., 2012; MacDougall et al., 2012; Schneider von Deimling
atmospheric carbon (Mack et al., 2004; Knorr et al., 2005).
As global temperatures continue to rise, it has become paramount to quantify carbon emissions from northern latitudes in order to predict future impacts of such emissions on Arctic ecosystems and the global climate. Carbon emissions have been indirectly quantified with climatic models (e.g. Sitch et al., 2003; Euskirchen et al., 2009; Koven et al., 2011; MacDougall et al., 2011; Burke et al., 2012; Schneider von Deimling et al., 2012; Schaphoff et al.; 2013) and directly with sporadic field measurements made with closed chamber (e.g. Joabsson & Christensen, 2001; Christensen et al., 2004; Wickland et al., 2006; Fouché et al., 2014) and eddy covariance systems (e.g. Friborg et al., 2000; Christensen et al., 2004; Jackowicz-Korczynski et al., 2008; Tagesson et al., 2012). However, modelling is limited by uncertainties in the size of the soil carbon reserves of the northern latitudes (Mishra et al., 2013) and still has difficulties to reproduce with accuracy the complex processes involved in soil carbon dynamics (Friedlingstein et al., 2006; Schaphoff et al., 2006).
The eddy covariance technique, although useful for continuous long-term monitoring at the ecosystem scale, is onerous, complex and cannot be used to determine mechanistic details of soil absorption and emission at fine scales (Griffis et al., 2000; Burba, 2013). In addition, the method requires uniform meteorological conditions over the area of measurements and homogeneous underlying vegetation located on a flat terrain to be truly accurate (Baldocchi, 2003). This is why closed-chamber measurements remain one of the most widely used direct techniques to monitor small-scale soil respiration (Davidson et al., 2002; Irvine & Law, 2002).
Closed-chamber studies tend to focus on comparing past environmental responses with today’s and very few have investigated the effects of future warming on greenhouse gas (GHG) emissions from northern wetlands (e.g. Oberbauer et al., 2007; Dorrepaal et al., 2009; Fouché et al., 2014). In addition, closed-chamber systems are both time-consuming and labour-intensive as they require the continual presence of an operator (Savage & Davidson, 2003; Lai et al., 2012). As a consequence, the duration of most field experiments is greatly limited and measurements are discontinuous and short-spanned. Automated systems allow taking long-term continuous measurements, but are still not widely used
because of the high costs involved and the infrastructure constraints (Savage & Davidson, 2003). Commercial automated systems exist but are often prohibitively expensive. Non-commercial automated systems have been developed in order to take continuous measurements at lower costs (Goulden & Crill, 1997; Irvine & Law, 2002; Liang et al., 2003; Edwards & Riggs, 2003; Savage & Davidson, 2003; Bäckstrand et al., 2008; Lai et
al., 2012), but still require an infrared gas analyzer (Davidson et al., 2002), which is also
costly.
The goal of this study was to measure GHG (GHG herein designates CO2 and CH4) emissions from a polygonal peatland and to evaluate the influence of climate change on those emissions. More specifically, this study aimed to: 1) determine the impact of a future rise in mean surface temperatures on carbon fluxes (CO2 and CH4) in a polygonal peatland lying in the continuous permafrost zone by measuring carbon emissions under current climatic conditions and inside an open-top chamber capable of increasing surface temperatures by 2-3°C; 2) measure spatial variations of GHG emissions in the peatland, from dry tundra polygon centers to wet troughs where permafrost is decaying; 3) determine what proportions of ecosystem respiration comes from belowground respiration and microbial activity; and 4) test a new instrumentation that was developed at Centre d’études nordiques (CEN) and that is capable of taking precise measurements over long periods of time with low-cost gas sensors while maintaining the integrity of the studied plots and functioning autonomously in remote regions. In addition, the new system sought to provide the scientific community with an instrumentation that is substantially less expensive than existing apparatuses.
We hypothesized that a rise in surface temperatures inside the open-top chamber (OTC) would increase local permafrost thawing by causing a deepening of the active layer and enhancing microbial activity. Consequently, carbon emissions due to permafrost degradation should outweigh increased carbon sequestration and lead to greater carbon release than the current emissions. In addition, the warming caused by the OTC should also contribute to a rise in primary production and thus to an increase in biomass on the warmed plot. We also expected that the water-saturated plot would emit more CH4 owing the anoxic conditions of the soils favouring anaerobic decomposition. Additionally, this plot should
have lesser CO2 emissions because this type of environment typically bears less living vegetation. Finally, we hypothesized that most of total ecosystem respiration would come from belowground respiration.
2. M
ATERIALS AND METHODS
2.1.
S
TUDY SITE AND MEASUREMENT PERIODThe study site was set near Salluit (Québec, Canada) (Figure 1). Salluit (62°14’N, 75°38’W) is the second most northern village in the Nunavik region and is located in the continuous permafrost zone with a low arctic climate (INTERACT, 2014). The village receives about 310 mm of precipitation annually, of which 52% (16.2 cm) is snow (Kasper & Allard, 2001). For the year 2013, continuous measurements estimated that Salluit received a total of 346 mm of precipitation, 34% in the form of snow (Centre d’études nordiques, unpublished data). Total rainfall from July 1 to August 31 totalled 95.7 mm and 152.2 mm in 2012 and 2013, respectively (CEN, 2014). Mean annual air temperature for the 1992-2006 period was -7.5°C (Fouché et al., 2014) and -6.0°C for the 2003-2013 period (2008 was not included due to an incomplete dataset) (CEN, 2014). In 2010, mean annual air temperature was -3.0°C, the warmest year on record in Salluit. Mean monthly air temperatures for July and August for the 2003-2014 period were 9.7°C and 9.3°C, respectively (CEN, 2014). From a 23 m-deep borehole drilled in gneiss near the Salluit airport, it was reported that the mean annual ground temperature at 20 m depth was -5.6°C (Smith et al., 2010).
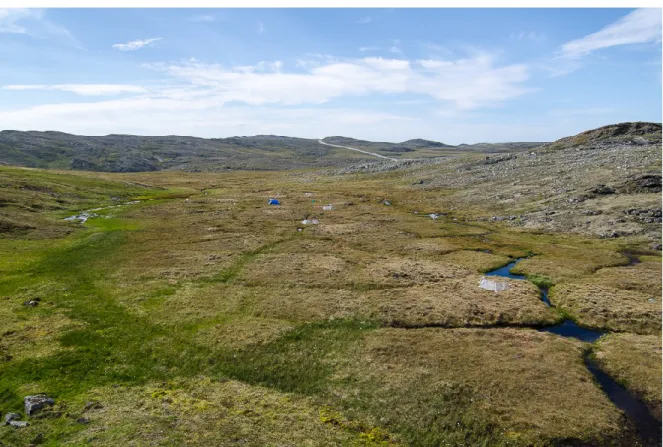
The study site was established in a polygonal peatland ~1.5 km south of the village. The site had already been subject to another study in 2010 (Fouché et al., 2014). The peatland is located in a small valley approximately 700 m long and open to the west, 150 m above sea level. The instrumentation was installed at the top of a low angle slope running on the whole length of the valley (Figure 2). The soil in the peatland is a Histic Cryosol, also called Organic Cryosol (SCWG, 1998). The soil developed over a peatland characterized by low centre polygons (Tarnocai & Bockheim, 2011). Analyses by Fouché et al. (2014) showed that the soil consists of histic horizons. These horizons are composed of fragments of herbaceous, mosses and Sphagnum species with variable degrees of decomposition. All layers contain a fraction of niveo-aeolian sand that originates from windblown, snow free, rock and till surfaces surrounding the peatlands. Radiocarbon dating indicated that the peatlands near Salluit formed with syngenetic permafrost growth over the Late Holocene
and are still growing (Ducharme, 2011; Fouché et al., 2014). Soil property analyses showed that the active layer of the peatland is acidic (pH = 4.6), has a relatively constant soil organic carbon content (~35%) throughout its depth and that nitrogen content increases slightly with depth (1.5% to 1.9% from 0 to 30 cm) (Fouché et al., 2014).
Figure 1. Location of the study near in Salluit, Northern Québec. West of the study site is the Salluit airport and north is the SILA meteorological station.
A total of 10 plots were instrumented in the polygonal peatland for the study. All plots were set near the top of the slope in the peatland and each plot had its own polygon, except for one plot located over an ice-wedge between two polygons. The selection criterion of the plots was to have flat zones where there was no all-terrain vehicle track. The vegetation was characterized on all plots at mid-campaign on July 29, 2014. Vegetation cover was estimated by strata for mosses and lichens and by species for vascular plants using the Braun-Blanquet cover abundance-scale (Mueller-Dombois & Ellenberg, 1974).
Figure 2. The polygonal peatland in the west-facing valley.
Automated chambers (ACs) were installed on four of the 10 plots (Figure 3). Three of these four plots were on polygons where the soil was relatively well drained. The first plot was used for a chamber in natural conditions (Cn) and the second one for a chamber inside an OTC (COTC). The purpose of the OTC was to increase soil surface temperature to the levels expected in 50 years (increase of ~2-3°C; IPCC, 2013) and to measure the impact of such warming on GHG emissions. On the third well-drained plot, aboveground vegetation inside the chamber was clipped (Csoil) in order to roughly measure GHG emissions emitted from the soil alone. The fourth chamber was installed between two polygons, i.e. over an
ice-wedge where permafrost was degrading and soil was permanently water-saturated (Csat). This set up aimed to evaluate the effects of spatially variable environmental conditions within the study site on GHG emissions.
Figure 3. The four plots with the automated chambers near Salluit, Northern Québec. a) Natural conditions (Cn), b) vegetation-free conditions (Csoil), c) water-saturated conditions (Csat) and d)
warming-induced conditions (COTC).
The six other plots were used to assess the natural variability of the peatland (Figure 4). The natural variability plots (NVP) were not equipped with ACs and were all placed on polygons with relatively well-drained conditions compared to the water troughs. Half the
a) C
nb) C
soilNVP were in natural conditions (VAR1, VAR2, VAR3) and the other half in warming-induced conditions (OTC1, OTC2, OTC3). Measurements on all plots (both AC plots and NVP) were made from July 1 to August 26, 2014 (57 days), in order to capture the majority of the growing season and monitor the evolution of ecosystem respiration and CH4 emissions throughout the summer.
Figure 4. Examples of natural variability plots (NVP) in the peatland near Salluit, Northern Québec. On the left is a plot in natural conditions (VAR) and on the right is plot under an open-top chamber to induce warming (OTC).
2.2.
I
NSTRUMENTATION2.2.1. A
UTOMATED SYSTEM OF CLOSED CHAMBERSAn automated system involving four closed chambers was developed for this study. The purpose of those chambers was to measure ecosystem respiration (ER) and CH4 emissions. They were also equipped with the necessary sensors to assess the effects of the chambers on their environment. The chambers were made from an opaque polyvinyl chloride (PVC) cylinder covered with aluminum foil tape to reduce warming from direct sunlight. In order to minimize the negative “chamber effects” on methane emissions (Pihlatie et al., 2013), the chambers had a volume of 26.14 L, covered an area of 1029 cm2 and were 25.40 cm high. Using a design similar to Savage and Davidson (2003), the chambers opened by being entirely lifted from the ground with a 12 V linear actuator (HAD1, Windy Nation Inc., Ventura, CA, USA) (Figure 5). When closed, a neoprene sealing on the edge of the chambers sat hermetically on circular aluminum collars. The collars were inserted ~10 cm
in the soil in order to avoid lateral gas diffusion between the atmosphere and the ground (Hutchinson and Livingston, 2001). Although an incision was made with a knife prior to installation, the collars could not always be inserted completely into the ground because of the uneven microrelief of the study plots. The collars were installed five days prior to the measurements of ER in order to minimize the initial effects of severing roots and disturbing soil structure during collar insertion (Davidson et al., 2002). The ACs were oriented south in order to avoid shading by the chambers on the plots.
Figure 5. Photographs of one chamber in the open (left) and close (right) positions in the peatland near Salluit, Northern Québec. The chambers opened and closed by being entirely lifted from the ground. When closed, they rested on an aluminum collar where a neoprene sealing ensured the chambers were airtight.
Each chamber was equipped with an ambient air temperature and relative humidity sensor (SHT15, Sensirion, Zurich, Switzerland), a methane sensor (TGS2600, Figaro Engineering Inc., Osaka, Japan) and a CO2 sensor (K-30, CO2Meter Inc., Ormond Beach, FL, USA). With the goal of building a system that was not only automated, but also low-cost, all sensors cost less than US$150. The sensors were installed inside a semi-circular tube, which was attached to a transversal aluminum rod placed 12 cm above the ground. The semi-circular tube was able to rotate around the aluminum rod, thus making it always face down and hence protecting the sensors from direct sunlight and rain (Figure 6). The chambers were also equipped with two waterproof brushless fans (3500 rpm) oriented in an
opposite fashion to favour air mixing during measurements and to flush the chambers before closing (Pumpanen et al., 2004; Christiansen et al., 2011). In addition, the system recorded soil surface temperature (Tsoil) (thermistor YSI 44033, ±0.1°C accuracy) and volumetric water content (VWC) (soil moisture probe VH400, Vegetronix Inc., Riverton, UT, USA, ±2% accuracy) inside and outside each chambers. The thermistors probes were inserted 2-5 cm deep depending on the moss cover and the soil moisture probes were inserted vertically their full length, i.e. 9.4 cm.
Figure 6. Inside of an automated chamber. Each chamber was equipped with an ambient air temperature and relative humidity sensor, a methane sensor and a CO2 sensor. The sensors were
installed inside a semi-circular tube that could rotate around a transversal aluminum rod in order to protect the sensors from direct sunlight and rain. Two waterproof brushless fans ensured air mixing during measurements and flushed the air in the chambers before closing.
A sensor network node with data logger functionality controlled all data recording, opening and closing of the chambers, and turning on and off of the sensors and fans (Seeeduino Stalker v2.3, Seeeduino Technology Limited, Shenzhen, China, with microcontroller ATmega328P, Atmel Corporation, San Jose, CA, USA). The microcontroller cost less than US$50 and gave us the flexibility to add the sensors we wanted and to build a script adapted to our needs. The script was specifically developed for this study with the Arduino integrated development environment (IDE), an open-source software available online for free (www.arduino.cc). The chambers also included an opening on one side with a butyl
rubber screw cap from Exetainer® vials in order to sample methane with a syringe. Moreover, two other openings placed on opposite sides of the chambers fitted with plastic cable glands were used to plug the tubes of an infrared gas analyzer to make complementary and comparative measurements of CO2 concentrations in the chambers (Figure 7).
Figure 7. Ports on the automated chambers. On the left, a butyl rubber screw cap where air samples were collected with a syringe to determine CH4 concentrations. On the right, an adjustable plastic cable
gland used to plug the tube of an infrared gas analyzer into an automated chamber.
2.2.2. N
ATURAL VARIABILITY PLOTSSix survey plots with no closed chamber were also set in the peatland (VAR1, VAR2, VAR3, OTC1, OTC2, OTC3). The OTCs were built following the hexagonal design of the International Tundra Experiment (ITEX) (Molau & Mølgaard, 1996). They were 50 cm tall and the top opening was 1.5 m across. The VAR plots were as big as the top opening of the OTCs, i.e. forming a 1.5 m wide hexagon (Figure 4). The walls of the OTCs were made of 2.4 mm transparent polycarbonate (MAKROLON®, Bayer MaterialScience, Leverkusen, Germany), which has a high light transmission (87-90%). The walls were attached together with UV-resistant tie wraps and the OTCs were fixed on the ground with ropes and pegs. In addition, OTCs were elevated approximately 4 cm above the ground with woodblocks to ensure that air could circulate freely under the walls.
Thermistor probes (YSI 44033) were installed at the centre of all NVP in order to measure soil surface temperature (2-5 cm deep) and one soil moisture probe (VH400, Vegetronix Inc., Riverton, UT, USA) was used for the six plots, alternating plot every day.
2.3.
M
ETHODS2.3.1. A
UTOMATED MEASUREMENTSThe automated system of closed chambers was initially set to take measurements with the four chambers operating simultaneously every 6 hours (07h30, 13h30, 19h30, 01h30). However, due to technical problems, the system could only operate two chambers at a time and had to be turned on and off manually. Thus, the chambers taking measurements were alternated every day and measurements took place only during the day (07h30, 13h30, 19h30).
The system was turned on at least 20 minutes prior to closing of the chambers to allow the sensors to warm up. The fans started one minute before closing to flush the air inside the chambers. Carbon dioxide and CH4 concentrations, ambient air temperature and relative humidity, soil surface temperature (Tsoil) and volumetric water content (VWC) measurements were automatically recorded every minute from the moment the chambers were closed until they opened 30 minutes later. Thirty minutes was chosen to ensure stability in the ER fluxes and to be able to measure the much smaller CH4 fluxes (Lai et al., 2012).
Weather conditions (air temperature (Tair), rainfall) were obtained from the Salluit SILA station, which belongs to the SILA network of CEN. The SILA station is located approximately 1160 m north of the study site at an altitude of 42 m and provides hourly data since 2002 (Figure 1). To establish correlations and numerical relationships between ER and key climate variables, we used hourly average air temperatures for Tair and the sum of all precipitations over the six hours preceding respiration measurements for rainfall.
Relative light level (RLL) was also recorded continuously every 30 minutes with temperature/light data loggers (HOBO Pendant® Temperature/Light Data Logger 8K, Onset, Bourne, MA, USA) inside and outside two chambers (Cn and Csoil) in order to assess
the effect of the chambers on the light reaching the vegetation inside the chambers. We also used the mean RLL of the five hours preceding ER measurements as an environmental variable. The plot in water-saturated conditions also measured RLL inside the chamber, but COTC did not have light loggers. Therefore, we used the RLL of Cn as an estimate.
Another data logger (XR-420 model, RBR Ltd., Kanata, ON, Canada) already installed on the site by Fouché et al. (2014) in 2010 was taking hourly measurements of soil temperature (YSI 4033) at different depths. We used the data from that instrument for surface temperature (2 cm depth).
2.3.2. M
ANUAL MEASUREMENTSAlong with automated measurements, manual measurements were also taken in the pursuance of assessing the precision and accuracy of the automated measurements. Furthermore, some measurements could not be recorded with the automated system.
2.3.2.1. R
EFERENCE MEASUREMENTSReference CO2 concentrations in the chambers were measured by connecting the gas tubes of an infrared gas analyzer (EGM-4) (EGM-4, PP Systems, Haverhill, MA, USA) to the adjustable openings of a given chamber (Figure 7). The openings were big enough not to obstruct the flow of the air-sampling pump (350 mL min-1) and could be tightened in order to prevent air leaks. In addition, the air was always filtered through an external hydrophobic filter with a water vapour equilibrator (Part no. 10049-01, PP Systems) before entering the EGM-4. The filter is constructed in a material that is very permeable to water but impervious to CO2. It allowed to protect the EGM-4 and to maintain constant conditions for CO2 concentrations. Carbon dioxide concentrations were recorded every minute from the moment a chamber closed and until it opened. Those measurements were made once a day for a given chamber, changing chamber every day. The time at which the measurements were recorded (07h30, 13h30, 19h30) changed every four days, i.e. after recording data from the four ACs.
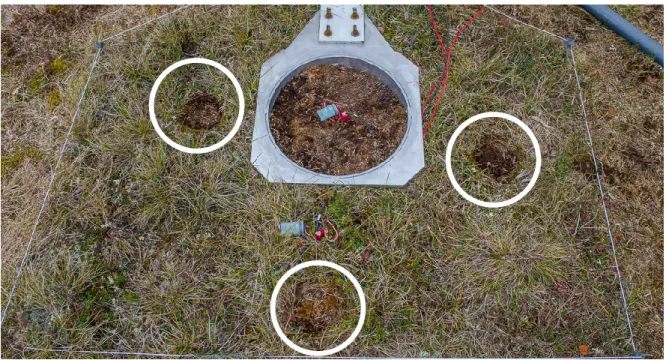
Figure 8. Plot of an automated chamber and sub-plots surrounding it. The black circles show the three sub-plots where measurements with the SRC-1 commercial chamber were made in order to make comparative measurements of ecosystem respiration between the two types of chambers. The photograph shows the plot without aboveground vegetation (Csoil).
Ecosystem respiration of the areas surrounding the ACs was measured with a portable soil respiration closed chamber (SRC-1) (SRC-1, PP Systems, Haverhill, MA, USA) compatible with the EGM-4. The SRC-1 was used to compare the ACs with a commercial system. The SRC-1 was opaque and had a volume and a surface area of 1171 cm3 and 78 cm2, respectively. The SRC-1 was always used concurrently with the automated system, except when the EGM-4 was used alone to measure CO2 concentrations in a chamber. For each plot with an AC, there were three sub-plots around the aluminum base where soil respiration was measured by inserting the 9 mm collar of the SRC-1 in the soil (Figure 8). The sub-plots were selected in order to capture the variable plant communities found in the aluminum collars of the ACs. Ecosystem respiration was recorded every 4.8 s for 100 s (Fouché et al., 2014), three times for each sub-plot (total of nine 100s-sequences, 22 concentration points for each sequence). Measurements alternated sub-plots and between each measurement, the chamber was kept above the soil surface and flushed with ambient air. These nine 100 s sequences took approximately 30 minutes to perform. However, as mentioned above, two ACs were always operated simultaneously by the automated system.
Therefore, ER measurements made with the SRC-1 around the second AC operated by the automated system were always recorded during the half hour following the opening of the ACs. We assumed that ER was the same within the same hour. Carbon dioxide reference measurements, either with the EGM-4 alone or with the SRC-1, could not be recorded when it rained because the EGM-4 cannot operate when it rains. This occurred approximately 15% of all the times we used the EGM-4.
Reference CH4 concentrations were obtained by sampling 10 mL gas samples with a 10 mL gastight syringe (Gastight® #1010, Hamilton Co., Reno, NV, USA) and subsequently analysing the samples in the laboratory (e.g. Christensen et al., 2000; Pelletier et al., 2007). The samples were collected every 10 minutes from the moment a given chamber closed for a total of four samples (0, 10, 20, 30 min). They were sampled through the changeable Exetainer® screw cap located on the side of the chambers (Figure 7). The cap was always changed after one day of measurements. Prior to the field campaign, the vials used (5.9 mL double wadded Labco Exetainer®, Labco International Inc., Houston, TX, USA) were put under vacuum, flushed with helium and then put under vacuum again. After collection, the vials were stored in environments where the temperature was stable until they were analyzed with a gas chromatograph at the Institut National de la Recherche Scientifique, centre Eau Terre Environnement (INRS-ETE) in December 2014. The measuring instrument (TRACE™ 1310, Thermo Scientific, USA) was calibrated with an analytical standard of 1% (w/w) CO, CO2, H2, CH4 and O2 of each component in nitrogen. During the month of July, methane samples were collected once a day for a given chamber. We alternated chamber every day, keeping the same time of sampling for each chamber. After four days, i.e. after collecting samples from the four ACs, we changed the time at which we collected samples (07h30, 13h30, 19h30). In August, methane sampling was performed three times a day for a given chamber, changing chamber every day.
2.3.2.2. W
ATER TABLE DEPTH AND ACTIVE LAYER THICKNESSWater table depth (WTD) and active layer thickness (ALT) were recorded manually with a measuring tape every day between 13h00 and 13h30 in four piezometers installed by Fouché et al. (2014) in 2010. The 2m-deep piezometers were made of perforated PVC tubes and located on two polygons roughly in the center of the four ACs (Figure 9). The
values used for the analyses were the daily average WTD and average ALT of the four piezometers. We assumed that WTD and ALT were uniform across the study site (Miller et
al., 1998).
Figure 9. The automated chambers and the piezometers. The piezometers (P1, P2, P3 and P4) were
roughly located in the center of the four automated chambers. Cn is in natural conditions, Csoil on a plot
where surface vegetation was clipped, Csat in water-saturated conditions and COTC in an open-top
chamber (OTC). All chambers were controlled by a microcontroller (M), which was located in the middle of the piezometers. The photograph is looking north.
2.3.2.3. S
OIL SURFACE TEMPERATURE ANDVWC
Initially, soil surface temperature (Tsoil) and volumetric water content (VWC) were recorded with the automated system. However, both the values recorded with the thermistors and the VWC sensor showed inconsistencies. Soil surface temperature did not vary much with changing Tair, remaining between ~6-8°C, and average VWC values on the AC plots were much lower than on the NVP. The differences were probably due to a discrepancy between the theoretical voltage and the field voltage used for the conversions. Therefore, from July 30 until the end of the campaign, Tsoil and VWC were noted manually rather than with the automated system. Since the values prior to July 30 were erroneous, we had to correct Tsoil and VWC. We used the mean Tsoil of the VAR plots and the OTC plots
C
soilC
nC
satC
OTCP
1P
4P
2P
3M
for Cn and COTC, respectively. We also used the mean Tsoil of the OTC plots for Csat as the average temperature of August of Csat was very close to the one of COTC. On Csoil, Tsoil in August were on average 1.0°C lower than on Csat. Hence, we used the daily mean Tsoil of the OTC plots minus 1°C for the month of July for Csoil. For VWC, we used a correction factor based on the mean VWC before and after July 30 to adjust the values. For the NVP, Tsoil and VWC were recorded manually during the entire summer. They were both recorded three times a day during the half hour preceding closing of the ACs. A summary of all the plots, the devices used to measure CO2 fluxes, the measurements made on each plot and their abbreviations can be found in table 1.
Table 1. Summary of all the plots, the devices used to measure CO2 fluxes, the measurements made on
each plot and their abbreviations.
Plots with automated chambers (ACs)
Abbreviations Conditions Measurements
Cn Natural conditions Ecosystem respiration (ER)
Methane emissions
Soil surface temperature (Tsoil)
Soil surface volumetric water content (VWC)
Relative light level (RLL) Csoil Vegetation-free conditions
Csat Water-saturated conditions
COTC Warming-induced conditions
Natural variability plots (NVP)
Abbreviations Conditions Measurements
VAR1
Natural conditions Soil surface temperature (T
soil)
Soil surface volumetric water content (VWC) VAR2 VAR3 OTC1 Warming-induced conditions OTC2 OTC3
Infrared gas analyzer
Abbreviations Conditions Measurements
EGM-4
Infrared gas analyzer used with an automated chamber
(AC)
The EGM-4 was plugged directly into an AC to make comparative measurements of CO2 concentrations with the low-cost
K-30 CO2 sensor
SRC-1
Infrared gas analyzer used with a portable commercial
chamber (SRC-1)
The SRC-1 was used to make comparative measurements of ecosystem respiration with the ACs from surrounding sub-plots
2.3.2.4. S
EASONAL MEASUREMENTSIn addition to daily measurements of Tsoil and VWC, ER and aboveground biomass were recorded three times on all NVP during the field campaign: at the beginning, in the middle and at the end of the campaign. Every time such measurements took place, three new sub-plots were created on each NVP, as much in the centre as possible for the OTC sub-plots. Ecosystem respiration was also recorded for a total of nine 100s-sequences on each sub-plot (see section 2.3.2.1), after which aboveground vegetation was clipped with scissors.
As aboveground vegetation was underlain by peat and its thickness varied depending on the type of plant species (e.g. moss vs. Carex species), it was important to find a method that would ensure that aboveground vegetation would always be sampled uniformly, albeit not based on fixed thickness. In order to do so, aboveground vegetation was always clipped to the depth where plant stems became white. This could be easily seen whether or not there was moss. Aboveground vegetation was collected, then dried in a conventional oven at 77°C for about 30 minutes with the oven door ajar when back from the study site to ensure the samples would not decompose due to excess moisture. After, the samples were left in ambient air for 48h and bagged for the rest of the summer. The following fall, they were dried in a laboratory oven at 55°C until a constant mass was recorded (generally after 48h-72h) in order to obtain the dry biomass (hereinafter referred to as biomass).
After the aboveground vegetation was clipped, ER was recorded again on each vegetation-free sub-plot (nine more 100s-sequences). Seasonal measurements were made between 9h00 and 11h00 over the course of three days within the same week as it took about 1h to do one NVP and the weather did not always permit to take all measurements three days in a row. At the end of the summer, in addition to the six NVP, the manipulations described above were also performed on the four plots with ACs. The new sub-plots were located inside the aluminum base instead of around it to obtain direct measurements of the plots. The goals of the seasonal measurements were to compare ER of the plots with ACs with ER of the NVP, to measure biomass growth throughout the growing season, to estimate the influence of primary production on ER and to monitor the effects of chambers and OTCs on primary production.
Finally, seasonal measurements also included measurements of photosynthetically active radiation (PAR) (LI-250 Light meter equipped with a LI-190SA Quantum sensor, LI-COR, Lincoln, NE, USA) inside and outside OTC1 in order to determine if solar transmission in the OTCs remained the same throughout the summer.
2.3.3. D
ATA SORTINGGas fluxes were calculated manually from the concentrations collected with the EGM-4 alone, the SRC-1 and with the automated system by doing a linear regression between CO2 concentration and time (Fouché et al., 2014). With the SRC-1, fluxes were accepted as final results when the linear relationship between CO2 concentration and time was stable (R2 ≥ 0.96) for at least one minute. For each time of day (07h30, 13h30, 19h30), all nine
SRC-1 ER measurements from the three sub-plots were averaged together in order to obtain a representative flux of the studied plot. Measurements with R2 < 0.96 were not used for
averages. With the EGM-4 alone and the automated system, the same criterion was respected, but with a relationship stable for at least 15 minutes since the ACs were closed for 30 minutes. Spikes in the data of the automated system due to system bugs were discarded. Some unstable gas emissions may have been caused by bad sealing of the chambers, low fluxes, erratic fluxes due to strong winds and gas bubbling when the soil surface was waterlogged (Fouché et al., 2014). For the methane emissions, we had to proceed differently due to the relatively small number of gas samples collected. We also did a linear regression, but the fluxes were accepted for the final results when the linear relationship between CH4 concentration and time had a correlation coefficient R2 ≥ 0.90. In
addition, since the majority of the samples had a concentration below the detection limit of the gas chromatograph (<2ppm), we always had only two points to determine the flux (generally after 20 and 30 minutes). In order to increase the number of points, we assumed that the undetected concentration preceding the two points detected by the gas chromatograph was 1.8 ppm, i.e. the atmospheric concentration of CH4 (WMO, 2014). This gave us three points rather than two.
Soil surface temperature and VWC measurements collected with the automated system during the first 30 days were sorted in order to remove inconsistencies due to system bugs. Data that were unusually high or low during the 30-minute sequences were removed from
the final results. The first measurement of Tsoil and VWC was used for comparison with the NVP and to compare the inside of the chambers with the outside. The difference between the first and the last measurements was used to evaluate the effects of the chambers on their environment. Air temperature and relative humidity measured with the SHT15 were discarded whenever the values were unrealistic due to a system bug. Since this happened 99% of the time, measurements made with this sensor were rejected altogether.
2.3.4. S
TATISTICAL ANALYSESStatistical analyses were performed using SPSS 21.0 (IMB Corp. Released 2012. IBM SPSS Statistics for Macintosh, Armonk, NY, USA: IBM Corp.) and SAS® Studio 3.1 (Copyright © 2012-2014, SAS Institute Inc., Cary, NC, USA). We employed SPSS to do paired and unpaired Student’s t-tests at a 95% confidence interval to evaluate the performance of the ACs. We also used it for Pearson correlations and to impute missing data by using multiple imputation analyses. Imputed missing data were obtained through the average of five imputations with 50 iterations.
With the SAS software, we performed a factor analysis of variance (ANOVA) with two-way repeated measure at a 95% confidence interval and using the Bonferroni correction (PROC MIXED statement with repeated measures). The two factors were, in addition to ER, the plot and the device used to measure ER and the two-way repeated measure were the time of day and the day of summer. Combining the four plots, the two devices and the three sampling times of day rather than a daily average enabled us to use 436 observations for our analysis. The effects used were “plot”, “type of chamber”, “time of day”, “plot*time of day” and “plot*type of chamber*time of day”. Only effects that were statistically significant were kept. We also used the SAS software to perform standard (PROC REG statement) and mixed model (PROC MIXED statement) multiple linear regression analyses at a 95% confidence interval in order to assess the impact of environmental variables on ER. Missing VWC values were imputed with SPSS and missing WTD or ALT values (2 days missing each) were interpolated using at least five points from the datasets. We performed standard regressions for each plot with an AC using ER as the independent variable to determine which environmental variables had the strongest effect on ER. We started our analysis with Tair, rainfall, WTD, ALT, Tsoil, VWC and RRL. We removed the
environmental variables that were the least significant (p>0.05), one variable at a time, until the adjusted R2 was maximal. For the mixed model regression, we used the ER data from
all the plots simultaneously in order to increase the statistical power of the analysis, which gave us 238 observations. In addition to the plots, the mixed model regression included environmental variables from the standard regressions that significantly influenced ER on at least one plot and the interactions between the variables. We proceeded with the regression by doing a backward elimination, starting with the non-significant interactions, until we obtained variables and interactions that were all statistically significant. We used a mixed model because in addition to the fixed effects (the environmental variables) we had a random effect (the plots).
We also measured the inter- and intra-variability of the NVP with the SAS software using the generalized linear mixed models (GLIMMIX) approach. We measured the variability among OTC1-2-3 and among VAR1-2-3 using Tsoil and VWC. We also used the soil temperature data provided by the RBR data logger as another VAR plot in order to have as many plots as possible. In addition, we took into account at what time the measurements were recorded. This overall approach enabled us to determine whether or not the plots with the ACs were representative of the entire study site.
2.3.5. C
ALCULATION OF THEQ
10 TEMPERATURE COEFFICIENTTo determine the apparent temperature sensitivity of ER, we calculated van’t Hoff’s temperature coefficient Q10, which expresses the proportional increase in respiration rate with a 10°C rise in temperature (Lloyd & Taylor, 1994; Davidson & Janssens, 2006; Kirschbaum, 2006; von Lützow & Kögel-Knabner, 2009; Fouché et al., 2014). The general equation to determine Q10 is
(1) Q10 = (fT2 / fT1)(10/T2-T1)
where fT1 is the reaction rate at temperature T1, fT2 is the reaction rate at temperature T2
and T2>T1. To calculate Q10 values of Cn, Csoil, Csat and COTC, we plotted ER against temperature for each plot and fitted an exponential function of the form fT = aebT, where fT
al, 2006). From the general equation to determine Q10, we find that Q10 is given by
(2) Q10 = fT+10 / fT = eb(T+10)-bT
or Q10 = e10b
We were then able to compare the temperature sensitivity of each plot with an AC and estimate what factors influenced most temperature sensitivity.
3. R
ESULTS
3.1.
E
NVIRONMENTAL DATAMean air temperature recorded at the SILA station during the measurement period was 9.2°C; July (8.8°C) was colder than August (9.6°C). August experienced the highest daily maximum (25.6°C) and July the lowest daily minimum (1.3°C). Air temperature maxima were reached at midday, generally between 11h00 and 18h00, but more often around 12h00. Summer average soil surface temperature (Tsoil) for each time of day was always highest at midday and lowest in the morning for all plots. Morning summer average Tsoil on the plot in water-saturated conditions (Csat) and in warming-induced conditions (COTC) were ~1.5°C higher than on the plot in natural conditions (Cn). Summer average Tsoil of OTC1-2 were on average 2.3°C warmer than the ones of the VAR plots and summer average Tsoil of COTC 2.7°C warmer than Cn (Table 2). Warming was greater in July (2.7°C) than in August (2.0°C) for OTC1-2, but remained the same throughout the whole summer for COTC (2.7°C). Surface warming in OTC1-2 also resulted in an increase of 0.7°C of the mean daily minimum and of 3.4°C of the mean daily maximum. Summer average Tsoil of OTC3, however, was lower than the summer average Tsoil of VAR1-2-3 by 0.9°C and had a narrower range of temperatures than all other plots (Figure 10). Summer average Tsoil of Cn was slightly warmer than the summer average Tsoil of VAR1-2-3. Summer average Tsoil of the plot in vegetation-free conditions (Csoil), Csat and COTC were comparable to the summer average Tsoil of OTC1-2. Overall, Csat had the highest summer average Tsoil, followed closely by COTC, then Csoil and Cn. Soil surface temperature of all plots followed the same trends and were all correlated with Tair. Correlation coefficients (r) vary between 0.54 and 0.62 (p < 0.01), except for OTC3 that had a lower value (r=0.47, p < 0.01).
Prior to July 30, when the volumetric water content (VWC) values of the surficial soil layer in the automated chambers (ACs) were recorded with the automated system, average VWC values were 18-38% lower than for the rest of the field campaign. However, after correction, VWC did not vary much throughout the summer (Figure 11). Almost three quarter of all data collected were above 80%VWC and less than a tenth of the data had a VWC below 70%. There was no clear correlation between VWC and other environmental
variables, except on Csat where VWC was correlated with Tair (r = -0.62), WTD (r = -0.56), ALT (0.36), Tsoil (r = -0.65) and RRL (r = -0.35) (all correlations at p < 0.01). For the other plots, VWC was weakly correlated with RLL (r = -0.21 to -0.35, p < 0.01), except on Csoil where it was correlated with Tair (r = -0.24, p < 0.05) and rainfall (r = 0.21, p < 0.05). Of the four ACs, the lowest mean VWC for the entire summer was recorded on Csat and the highest one on COTC (Table 2). Volumetric water content values of Cn, Csoil and Csat were within the same range of VWC values of VAR1-2-3 as well as for COTC and the OTC1-2-3.
Table 2. Average soil surface temperature (average Tsoil, °C) and the average volumetric water content
(average VWC, %) of plots in a polygonal peatland near Salluit, Northern Québec. Each plot uses all Tsoil available, i.e. morning, midday and evening Tsoil. The averages are for July, August and the entire
summer.
Plot
Average soil surface temperature (°C)
Average Volumetric Water Content (%)
July August Summer July August Summer
Cn 6.6 7.8 7.2 93.8 94.9 94.7 Csoil 8.3 9.8 9.0 83.7 83.7 83.7 Csat 9.3 10.8 10.0 74.7 74.7 74.7 COTC 9.3 10.5 9.9 96.2 99.5 98.6 VAR1 6.6 7.5 7.0 64.1 75.0 71.0 VAR2 6.1 7.4 6.7 84.4 83.6 83.9 VAR3 7.1 8.1 7.6 88.8 92.6 91.1 OTC1 9.0 9.4 9.2 81.9 89.5 86.8 OTC2 9.5 9.8 9.7 91.1 99.4 96.5 OTC3 5.5 6.9 6.2 89.9 95.0 92.8
According to the SILA meteorological station, rainfall totaled 155.7 mm between July 1 and August 26. July (92.0 mm) received more rainfall than August (73.9 mm), mainly because of an important rainfall event from July 19 to 23 totaling 75.9 mm. Another rainfall event occurred on August 23, where 23.1 mm of rain were recorded. Active layer thickness (ALT) started at ~19 cm and deepened down to ~62 cm by the end of August. It increased with rainfall and decreased a little during dry spells (Figure 12). This also coincided with variations in the water table depth (WTD).
significantly different (p < 0.001). The inside RLL were higher than the outside RLL for both chambers. The difference was more pronounced on Cn (average light level inside = 28 568 lux, outside = 20 569 lux) than on Csoil (inside = 29 287 lux, outside = 24 203 lux). All RLL sensors were highly correlated together (r≥0.90), with ER (r = 0.50 to 0.83, p < 0.01), with Tsoil (r = 0.70 to 0.77, p < 0.01) and more weakly with Tair (r = 0.27 to 0.41, p < 0.01) and rainfall (all r = -0.19, p < 0.05).
Figure 10. Overall soil surface temperature (Tsoil, °C) for each plot from July 1 to August 26, 2014.
OTC1-2-3 = natural variability plots inside open-top chambers; VAR1-2-3 = natural variability plots in
natural conditions; Cn = plot with an automated chamber in natural conditions; Csoil = plot with an
automated chamber in vegetation-free conditions; Csat = plot with an automated chamber in
water-saturated conditions; COTC = plot with an automated chamber in warming-induced conditions. The
white boxes show natura variability plots and the grey boxes plots with automated chambers. Each plot uses all Tsoil available, i.e. morning, midday and evening Tsoil. The middle line in the boxes is the
median, the lower and upper boundaries are the first and third quartiles, respetively, and the whiskers are the maximum and minimum values. The circles are the average values. Whereas Csoil, Csat and COTC
have similar Tsoil ranges and average values to OTC1-2, Cn is comparable to VAR1-2-3. Note how OTC3
has much lower values than OTC1-2.
0 2 4 6 8 10 12 14 16 18 20
OTC1 OTC2 OTC3 VAR1 VAR2 VAR3 Cn Csoil Csat Cotc
So il surface tem pera ture (° C) Site
Figure 11. Variations of volumetric water content (VWC, %) throughout the summer for the plots with automated chambers. Each plot uses all VWC values available, i.e. morning, midday and evening values. Whereas Cn, Csoil and COTC remained relatively constant, Csat showed more variability.
Figure 12. Daily rainfall (mm), water table depth (WTD, cm) and active layer thickness (ALT, cm) from summer 2014. Daily rainfall is on the left y-axis and WTD and ALT are ont right y-axis.
0 10 20 30 40 50 60 70 80 90 100 7-1-14 7-11-14 7-21-14 7-31-14 8-10-14 8-20-14 8-30-14 Vo lum etric Wa ter Co ntent (% ) Cn Csoil Csat Cotc 0 10 20 30 40 50 60 70 0 5 10 15 20 25 30 35 40 45 50 07 -0 1 07 -0 3 07 -0 5 07 -0 7 07 -0 9 07 -1 1 07 -1 3 07 -1 5 07 -1 7 07 -1 9 07 -2 1 07 -2 3 07 -2 5 07 -2 7 07 -2 9 07 -3 1 08 -0 2 08 -0 4 08 -0 6 08 -0 8 08 -1 0 08 -1 2 08 -1 4 08 -1 6 08 -1 8 08 -2 0 08 -2 2 08 -2 4 08 -2 6 Depth from the surfa ce (cm ) Da ily Rainfa ll (m m ) Rainfall WTD ALT
3.2.
V
EGETATION COVERMost plots were dominated by mosses (10-37.5%) and herbaceous plant species (37.5-82.5%) (Table 3). The plot in water-saturated conditions (Csat), VAR1-2-3 and OTC3 were mostly covered by Carex species (82.5%) whereas the abundance of these species was lesser on other plots (37.5% for all other plots except for COTC with 62.5%). We also observed other vascular plants such as Rhododendron groenlandicum, Eriophorum
vaginatum and Rubus chamaemorus and we noted Vaccinium vitis-idaea on the majority of
plots. The plot in water-saturated conditions was particularly rich in Carex species and had no lichen because of the wet conditions. The plot in natural conditions (Cn) had the greatest
Sphagnum and Cladonia cover (both 37.5%).
3.3.
L
OW-
COST SENSORSOf the three sensors used in each chamber, only the K-30 (CO2) gave steady and interpretable results. Due to unknown conflicts in the script, the SHT15 (ambient air temperature and moisture) only worked a handful of times and was unreliable. Although the TGS2600 (CH4) did work, we were not able to detect low increases in methane concentrations because the sensor was not sensitive enough. In addition, Eugster and King (2012) demonstrated that the TGS2600 is very sensitive to changes in ambient air temperature and moisture. Since the SHT15 did not provide us with data to compensate for these changes during measurements, it was impossible to obtain usable data from the TGS2600.
When plotting the ER fluxes measured with the EGM-4 against the ER fluxes measured with the K-30 CO2 sensor, the graph showed that the fluxes given by the two devices were linearly correlated together (R2 = 0.98) (Figure 13). In addition, the relationship between
the two devices followed closely the 1 for 1 relationship, except for lower concentrations where there was a slight skew towards the K-30. A paired t-test between ER fluxes measured with the K-30 and with the EGM-4 revealed that there was a statistically significant difference between the two devices (p = 0.003). The concentrations measured with the K-30 were on average 0.013±0.004 gCO2 m-2 h-1 or 4.9±1.6% higher than those measured with the EGM-4.
Table 3. Vegetation cover of the species present on each plot (130 cm X 75 cm) located in a polygonal peatland near Salluit, Northern Québec. Species were grouped into four categories: moss, lichen, low-growing shrubs and herbaceous plants. Cover was evaluated visually with a vertical projection and a midpoint value was assigned to each Braun-Blanquet class. When possible taxa were identified to species: Carex sp. includes C. capillaris, C. scirpoidea
C. fuliginosa and C. membranaceae and other unidentified species. For Csoil, the classification was done before the vegetation was clipped.
Vegetation cover (%)
Plant species Cn Csoil Csat COTC VAR1 VAR2 VAR3 OTC1 OTC2 OTC3
Moss Sphagnum sp. 37.5 20 10 10 10 10 10 10 10 10
Lichen Cladonia sp. and foliose 37.5 20 10 3 3 3 3 10
Low growing shrubs (0-0.1m) Rubus chamaemorus 3 <1 <1 <1 3 <1 <1 3 Rhododendron groenlandicum 10 10 10 20 10 Salix uva-ursi 3 <1 <1 Vaccinium vitis-idaea 3 20 10 3 3 20 10 3 Herbaceous plants Bistorta vivipara 3 Carex sp. 37.5 37.5 82.5 62.5 82.5 82.5 82.5 37.5 37.5 82.5 Eriophorum callithrix <1 <1 <1 <1
Figure 13. Relationship between ecosystem respiration (ER, gCO2 m-2h-1) measured with the low-cost
K-30 CO2 sensor and the infrared gas analyzer EGM-4. The dotted line shows the 1 to 1 relationship
between the two devices and the full line is a linear trendline. The uncertainties on the data points are the standard error of the mean.
3.4.
P
ERFORMANCE OF THE AUTOMATED CHAMBERSIn order to assess the performance of the automated chambers, we compared ER measured with the automated chambers (ACs) with ER measured with a commercial chamber (SRC-1). The ANOVA showed that there was a significant difference between the ACs and the SRC-1 (p < 0.0001) (Table 4 (see supplementary table 1 in annex I for full table)). Relative to the SRC-1, the ACs underestimated ER by an estimated mean difference of 0.063±0.008 gCO2 m-2 h-1 or 19.8±2.5%. The difference in ER between the two chambers seemed larger when ER fluxes were low (Figure 14). On Cn and Csoil, almost all ER fluxes recorded were larger with the SRC-1 whereas on COTC, the difference was greatest with higher fluxes (Figure 15). Ecosystem respiration recorded on Csat and COTC displayed the highest linearity (respectively R2 = 0.80 and R2 = 0.82), but it was on Csat that ER fluxes from both chambers
were the most in agreement. Despite these differences in absolute values, summer ER trends of both chambers were similar (see section 3.4).
R² = 0,9764 0,0 0,1 0,2 0,3 0,4 0,5 0,6 0,7 0,8 0,9 1,0 0,0 0,2 0,4 0,6 0,8 1,0 ER m ea sured w ith EGM -4 (gCO 2 m -2h -1)
The unpaired t-tests performed to determine if there was a difference in Tsoil and VWC between the inside and the outside of the ACs showed no statistical difference for Tsoil, but significant differences in VWC (Cn p = 0.014, Csoil, Csat, COTC p < 0.0001). Summer mean inside VWC was slightly lower on Cn (-1.7%VWC) and 6-15%VWC higher for the other ACs. We also did paired t-tests between the first and last measurements of inside and outside Tsoil and VWC in order to determine whether or not the closing of the chambers had an influence on environmental conditions. For Tsoil, there was a significant difference outside Csoil (p = 0.009) and outside COTC (p = 0.023). For VWC, there was no statistically significant difference for any of the chambers.
Table 4. Part of the results of the two-factor ANOVA with two-way repeated measure. The table shows
the tests between ecosystem respiration (ER, gCO2 m-2 h-1) measured on all the plots (Cn, Csoil Csat,
COTC), between ER measured with the automated chambers (AC) and the SRC-1 commercial chamber
(SRC-1), and between ER measured at different times of day (07h30, 13h30, 19h30). The estimated difference is the difference between the first variable and the second one. The p-values reported in the table were corrected using the Bonferroni correction. The full table is shown in annex I.
Effect Estimated difference Standard error p-value
gCO2 m-2 h-1 Cn vs. Csoil 0.064 0.027 0.1000 Cn vs. Csat -0.116 0.026 0.0001 Cn vs. COTC -0.069 0.026 0.0580 Csoil vs. Csat -0.181 0.026 <.0001 Csoil vs. COTC -0.133 0.026 <.0001 Csat vs. COTC 0.048 0.025 0.3613 AC vs. SRC-1 -0.063 0.008 <.0001 Morning ER vs. Midday ER -0.144 0.011 <.0001 Morning ER vs. Evening ER -0.083 0.014 <.0001 Midday ER vs. Evening ER 0.061 0.011 <.0001
Since only ER fluxes with R2 ≥ 0.96 were accepted for analysis, part of the data was
rejected. For the ACs, 12% of the 270 30-min sequences were rejected and for the SRC-1, 8% of the 1781 100-s sequences were rejected. Among the ACs, Csoil had the highest percentage of rejected sequences with 37%, followed by Csat with 4%, COTC with 3% and Cn with 2%. Similarly, the highest percentage of rejected sequences with the SRC-1 was on Csoil with 13%. However, the percentage of rejected sequences on Cn, Csat and COTC were
higher than with the ACs with 8%, 6% and 5%, respectively. If we exclude Csoil, only 3% of all data was rejected for the ACs compared to 6% for the SRC-1.
Figure 14. Relationship between ecosystem respiration (ER, gCO2 m-2 h-1) measured with the
automated chambers (AC) and the commercial chamber (SRC-1). All ER fluxes measured simultaneously with the AC and the SRC-1 were used. The dotted line shows the 1 to 1 relationship between the two devices and the full line is a linear trendline. The uncertainties on the data points are the standard error of the mean.
R² = 0,714 0,0 0,1 0,2 0,3 0,4 0,5 0,6 0,7 0,8 0,9 1,0 0,0 0,2 0,4 0,6 0,8 1,0 ER m ea sured w ith SRC -1 (gCO 2 m -2h -1)