Firewood Collections and Economic Growth
in Rural Nepal 1995-2010:
Evidence from a Household Panel
1Jean-Marie Baland2, Francois Libois3 and Dilip Mookherjee4
January 17, 2013
Abstract
A household panel data set is used to investigate the effects of
economic growth on firewood collection in Nepal between 1995 and 2010.
Results from preceding cross-sectional analyses are found to be robust: (a)
rising consumptions for all but the top decile were associated with increased
firewood collections, contrary to the Poverty-Environment hypothesis; (b)
sources of growth matter: increased livestock was associated with increased
collections, and falling household size, increased education, non-farm
business assets and road connectivity with reduced collections. Nepal
households collected 25% less firewood over this period, mostly explained by
falling livestock, and rising education, connectivity and out-migration.
JEL Classification Numbers: D12, O1, Q2
Keywords: deforestation, growth, Environmental Kuznets Curve,
Introduction
Deforestation in South Asia and Sub-Saharan Africa poses serious
developmental and ecological problems. Large sections of neighboring
populations of these countries rely on forests for household fuel, timber and
fodder, and spend a disproportionate amount of time in collecting these
products. The ecological problems pertain to increased soil erosion, water
salinity, siltation in rivers, and increased likelihood of landslides and floods
which affect large non-neighboring populations adversely.5 A key question
frequently debated by scholars6, media7 and policy-making community8
concerns the likely effect of economic growth on environmental degradation
in these countries. For instance, the World Bank 2000 report on deforestation
in India stated:
“urbanization, industrialization and income growth are putting a tremendous demand pressure on forests for products and services. The
shrinking common property resource base, the rapidly increasing human and
livestock population, and poverty are all responsible for the tremendous degradation pressure on the existing forest cover.” (World Bank (2000, Summary section, page xx)
Views commonly expressed on this issue differ widely. Some
(expressed by the World Bank above as well as the 2006 World Economic
Forum Summit) believe income growth will increase the demand for
household energy, thereby putting additional pressure on forests (the principal
source of household fuel). Others argue poverty forces households to rely on
possible by economic growth will reduce the pressure on forests, in what is
commonly referred to as the Poverty-Environment hypothesis (PEH).9
Intermediate between these is the Environmental Kuznets Curve (EKC)
hypothesis, which states that environmental degradation will intensify with
growth in living standards until a threshold, beyond which it will fall.10 These
differences stem from alternative assumptions regarding the nature of wealth
effects (i.e., whether firewood is a normal or inferior good) and their strength
relative to substitution effects associated with changes in collection times, the
shadow value of household time and cost of alternative fuels. More nuanced
viewpoints argue that effect of growth on deforestation depends on whether it
is accompanied by changes in property rights, government regulations and
their enforcement11, demographics, occupational structure, education and
availability of modern fuels.12
Despite the importance of the issue, existing evidence available from
disaggregated household surveys is subject to numerous concerns over their
reliability. The most important of these is that nearly all studies are based on
cross-sectional data, i.e., on comparisons of firewood collection behavior
between different households with varying incomes at a single point of time.
The possibility of unobserved heterogeneity between households and local
communities limits the reliability of predictions based on these comparisons
on how a given household’s collection behavior will be modified as its income and assets change over time. Unobserved attributes of households may be
correlated with both its living standards and its firewood collections, which
could generate spurious correlations. For instance, a household whose
and achieve higher incomes and consumption; it will also collect more
firewood. The same household may not, however, collect more firewood as
its income increases over time. A cross-sectional analysis will then generate
an upwardly biased estimate of growth in collections of a household with
given attributes. Similar problems arise through the effects of unobserved
community norms in resource use: villages with stronger social capital may be
able to attain higher living standards owing to successful collective action in
irrigation or water use. They would also have more effective regulations of
firewood collection from community forests. But this does not imply that any
given village would collect less firewood as its living standards rose. The
comparison of firewood collections across villages would then be biased
downward, if used to predict the effects of growth in living standards.
Moreover, cross-sectional comparisons may pertain to the effects of
long-standing differences in incomes between households, which could be a poor
guide to predicting effects of income changes in the short or intermediate run
(owing to differential responses to permanent and transitory shocks). These
sources of bias can be avoided only in longitudinal studies in which the effects
of changes in incomes and assets over time of a given set of households and
communities are studied. Unfortunately, such datasets in the context of use of
environmental resources in developing countries are conspicuous by their
absence.
In the context of firewood collection in Nepal, such a longitudinal
household survey has recently become available from the World Bank Living
Standards Measurement Survey (LSMS). A relatively small (but
Nepal (i.e., excluding the low-lying Terai regions) were surveyed in three
successive rounds of the Nepal LSMS corresponding to 1995, 2003 and 2010,
while other sub-samples were surveyed in two of these waves, allowing us to
utilize an unbalanced household panel.13 Nepal is an appropriate context to
study since it has been subject to serious deforestation, with forest cover
declining at an annual rate of 1.9% over the 1980s and the 1990s (UNDP,
2011). At the same time, it experienced substantial growth in per capita
incomes, consumption, and household assets as well as changes in household
demographics, occupations, literacy and community forest management rights
between 1995 and 2010. During this period, the LSMS data shows firewood
collections per household fell 25%, while living standards rose 70% and time
to collect firewood fell by nearly 20%. These changes were uneven across
different parts of Nepal and also across different households within any given
village, allowing us to compare changes over time in firewood collected by
each household in the panel with corresponding changes in their economic and
demographic circumstances. This provides a rare opportunity to directly study
changes over time in use of environmental resources of poor households, and
assess the extent of bias in estimates based on cross-sectional comparisons.
Our main finding is that the results of preceding cross-sectional
analyses are robust, with a few exceptions. In particular, the inferences drawn
in Baland et al (2010a) based on cross-sectional analysis of the 1995 LSMS
continue to be broadly valid in the panel analysis over the subsequent fifteen
years, with a few exceptions. The main results are summarized as follows:
(i) Growth in household per capita consumption was associated with
is no evidence in favor of the PEH, while there is some evidence in favor of
the EKC with a turning point located somewhere in the top consumption
decile. Hence rising consumption levels per se for most of the rural population
in the non-terai region were associated with rising pressure on the forests.
This result is robust to functional form, as well as controls for household
dummies, a large range of time-varying household (e.g., assets, demographics,
occupation, education) attributes and time-varying village dummies.
(ii) Changes in household demographics, asset composition and
occupations affect firewood collections in ways similar to those observed in
cross-sectional comparisons: firewood collected by a household falls if it has
fewer adult members, or if there is a fall in livestock owned. In contrast to the
cross-sectional pattern, the effects of higher average years of schooling and
non-farm business assets have unstable signs and are statistically insignificant.
(iii) The preceding results imply that the nature of the growth process
matters: whether living standards rise as a result of increases in transfers or
remittances, or increase in productive assets. In contrast to the former which
generate pure wealth effects, the latter generate a combination of wealth and
cost of collection effects (owing to induced effects on occupational patterns).
Growth in livestock unambiguously increases firewood collected, both owing
to positive wealth effects and complementarity of grazing with firewood
collection. Effects of growth in education or non-farm business assets are
ambiguous, owing to conflicting directions of induced wealth and cost of
collection effects.
(iv) In predicting the implications of growth in assets, we extend
previous analyses by incorporating spillover effects across households arising
congestion generate distinct predictions for how collections of any given
household would respond to changes in their neighbors’ behavior. We find evidence for both conformity and congestion effects, while the former tended
to dominate. Hence the effects of changes in household assets were magnified
at the community level. The effects of increases in village average education
and non-farm business assets are negative and statistically significant,
consistent with the cross-sectional pattern at the household level.
(v) The implied effects of changes in household assets observed
during the 1995-2010 period was a reduction in firewood collected by the
average household (9.2% over 1995-2003 against an observed drop of 12%,
and 18.5% over 2003-2010 compared with an actual drop of 15%), with the
bulk of these effects generated by spillover effects. This indicates the role of
occupational structure on firewood collections: Nepalese households in the
Hills and the Mountains were moving away from livestock-based occupations. In contrast, the growth effects implied by the Engel curves predict rising
firewood collections, by 5% over 1995-2003 and 29% over 2003-2010. Hence
growth projections are sensitive to whether changes in consumption or in
productive assets are used to measure growth.
The preceding results were robust to tests for measurement error
(based on Griliches and Hausman (1986) applied to a balanced sub-sample of
the overall panel). They are also robust to a variety of time-varying village
controls, such as proximity to roads, village population, the presence of
community forest user groups (FUGs), or casualties incurred in relation to the
Maoist civil conflict.14 We find no statistically significant association between
user groups (FUGs), nor with casualties incurred in relation to the Maoist civil
conflict. However, it is difficult to infer anything from these about possible
causal effects of formation of FUGs or civil war on firewood collections,
owing to the possibility of unobserved village attributes and endogeneity of
FUGs or location of the conflict.15
The paper is organized as follows. Section 2 presents descriptive
statistics concerning changes in living standards, household demographics,
assets and firewood collections over the 1995-2010 period. Section 3 presents
estimates of Engel curves relating firewood collections to household
consumption, while Section 4 focuses on the reduced form relationship
between collections and productive assets. Section 5 presents and compares
the estimated growth effects across the two approaches. Section 6 presents
robustness checks with respect to measurement error and a restricted
sub-sample where FUGs were already present prior to 1995. Section 7 describes
relation of our analysis to existing literature and concludes the paper.
2. Data and Descriptive Statistics
The World Bank Living Standards Measurement Survey (LSMS) for
Nepal interviewed 3388 households concerning their production and
consumption activities for the year 1995–96, 3912 households for the year
2002-3 and 5988 in 2010-11.16 A random subset of these households was
selected to constitute a moving panel representative of Nepal. We focus on the
hills and mountain areas of Nepal, which share a similar agro-ecological
system and a comparable reliance on forest resources. Our final panel data
were interviewed in the three waves, 240 households were interviewed in
1995-6 and in 2002-3, and 199 were interviewed in 2002-3 and in 2010-11.
The corresponding numbers of villages in the panel are 22, 19 and 19. The
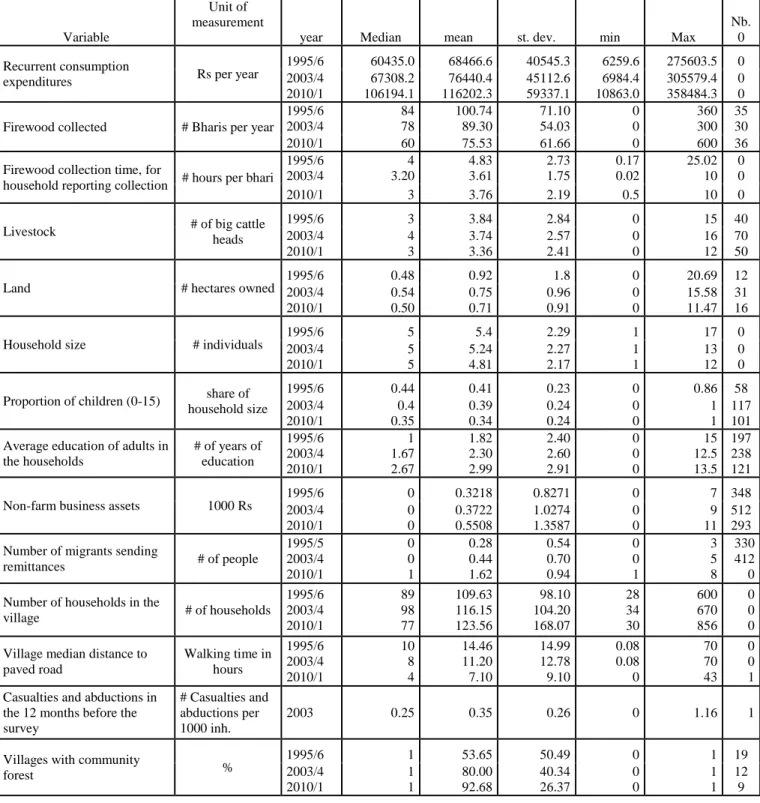
attrition rate at the household level is around 15%.17 Table 1 below provides a
summary description of the main variables used in our analysis.
INSERT TABLE 1 HERE
In this region, almost all households collect and consume firewood,
which is the primary source of cooking fuel. More than 90% of households
collected firewood in all three waves. The quantities of firewood exchanged
on the market were negligible. The amount of firewood collected per
household per year dropped 7% between 1995 and 2003, and 23% from 2003
till 2010. The time taken to collect firewood also fell substantially by 20% and
7% respectively in these two time periods.
Household living standards (measured by value of annual
consumption at 2010 prices) increased 10% in the 1995-2003 period, and 60%
in the subsequent seven years. The acceleration in the second period was
related to sharp rises in remittances received from migrants, in turn associated
with a rise in the mean number of migrants per household from 0.28 in 1995
to 0.42 in 2003, and 1.62 in 2010. By 2010 more than half the households had
at least one member who had migrated out. Remittances formed one-third of
household income by 2010.
There were also significant changes in household assets between 1995
and 2010. Mean holding of livestock fell 14%, years of schooling per
72%. Household size fell 11% and the proportion of children fell 15%. The
average number of households per village rose, while the median number of
households fell. Distance to paved roads fell from 14 to 7 hours.
The period under study witnessed the development of the Forest User
Group program, after being launched in 1993. The programme’s objective has
been to transfer the management of accessible forests to local communities,
via Forest User Groups (FUGs). These groups are empowered to control
access to the forests, taxing forest products, hiring forest guards and launching
plantation programme. Income generated by forest-related activities can be
used to finance local projects such as roads, schools and temple.18
Approximately half the villages had a FUG in 1995. This proportion rose to
80% in 2003 and 92% in 2010. The proportion of households collecting
primarily from the community forest increased from 9.2% in 1995 to 31.7% in
2003 and 37.1% in 2010. The two other major alternative sources of firewood
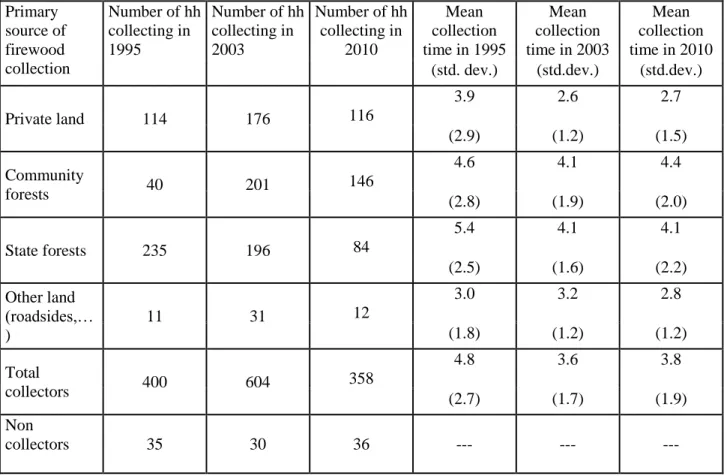
were state forests and own land. Table 2 shows that the percentage of
households collecting primarily from their own land increased slightly from
26% to 29%. At the same time the proportion of villagers collecting from
state forests decreased significantly from 54% to 21%. We therefore observe a
significant switch in collections from state to community forests. This partly
reflects the conversion of state forests into FUGs.19
INSERT TABLE 2 HERE
Since Forest User Groups are created voluntarily by villages, it is
difficult to estimate their impact on firewood collections. Their creation and
of deforestation as well as various unobserved political and economic factors.
At the household level, membership in a FUG is also voluntary. Hence the
right to collect from a community forest is not exogenous, even when one
controls for village characteristics. Given our data, we therefore refrain from
drawing any inferences regarding the role of the FUGs in forest conservation
or regeneration. In the estimations presented below, we simply control for the
existence of a FUG in the village.20 21
Another important event during the study period was the Nepalese
Civil War between government forces and Maoist rebels, which started in
1996 and ended in 2006. The civil war culminated in 2003 and 2004 with the
Maoist rebels controlling a large part of the countryside. 41% of the villages
surveyed in 2003 belonged to a district where severe combats (involving more
than a hundred casualties) occurred in 2003.22 Over all villages, the average
number of casualties in 2003 was equal to 0.17 deaths per thousand
inhabitants in the district and the average number of abductions and
disappearances was equal to 0.20 per thousand. The conflict data at our
disposal are imprecise as they correspond to the average casualties in the
district to which the village belongs. Moreover, according to Do and Iyer
(2010), the Nepal civil war was concentrated in geographic locations favoring
insurgents, such as mountains and forests, and in areas of greater poverty
owing to the need of the insurgents to recruit soldiers (see also Bohara et al,
2006 and Hatlebakk, 2009). As a result, we are not able to draw reliable
estimates of the effects of the civil war on firewood collections; we shall
instead focus on effects of growth of consumption and assets on collections
3. Firewood Collection and Living Standards
In this section we focus on the relationship between household
consumption and firewood collections, in order to test commonly held views
such as PEH or EKC concerning the effect of growth in living standards on
firewood collections. Conceptually this corresponds to estimating the nature of
wealth effect in the demand for firewood. This requires us to control for
household assets and other attributes that could affect costs of collecting
firewood. Econometric problems arise from the possibility that consumption
and firewood collections are jointly determined by unobserved household and
community attributes. Controlling for village dummies and focusing on
intra-village variations in a cross-sectional analysis helps control for the bias
resulting from unobserved village heterogeneity. Using a panel enables us to
additionally gauge the bias resulting from unobserved household
heterogeneity that is fixed over time, besides changes in observable household
attributes. Additional problems arise from the possibility of incorrect
functional form of the Engel relationship, and measurement error in
consumption and firewood collections; we shall review robustness of our
results with respect to these problems.
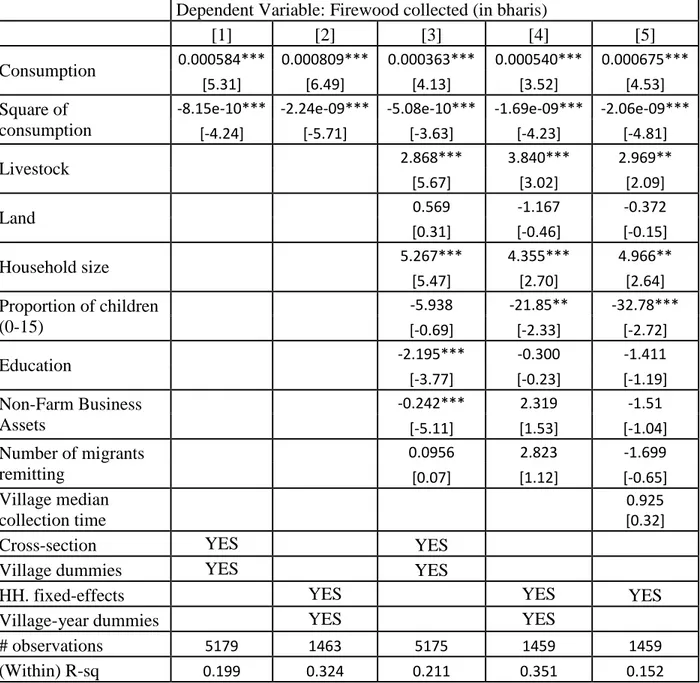
Table 3 presents estimated Engel relationships using alternative
parametric specifications and with varying sets of controls. Consumption is
measured by annual household recurrent expenditures valued at 2010 prices.
The first two columns show estimated relationships from the cross-sectional
data (which pools all three waves) and the longitudinal data respectively using
in the cross-sectional estimates (column 1) and village-year dummies in the
panel estimates (column 2). 23 Columns 3 and 4 present the corresponding
cross-sectional and panel estimates upon adding in controls for household
attributes. Column 5 extends the panel regression further by including a
control for the village median self-reported collection time per bhari24. All
regressions include seasonal dummies, and standard errors are clustered at the
village level.
All columns show a significant inverted-U relationship between
firewood collections and consumption. The panel estimates show the turning
point to be between consumptions of Rs 100,000 and 200,000, corresponding
to consumptions above the 95th percentile. The turning point in the
cross-sectional pattern is substantially higher (approximately Rs 358,000 in either
column 1 or 3). Hence all the estimates show a significant upward sloping
relationship between consumption and collections for all but the most affluent
households. The evidence thus firmly rejects the PEH and is consistent with
the EKC.
INSERT TABLE 3 HERE
The effects of variations in household assets are consistent across the
cross-sectional and panel estimates, with respect to livestock, household size
and composition: livestock ownership and household size have positive
effects, while the proportion of children has a negative effect. The effects of
schooling and non-farm assets are negative and significant in the
cross-sectional estimates, but are insignificant and have unstable signs in the panel
grounds. Increased livestock would be expected to generate positive wealth
effects, as well as lower the cost of collecting firewood owing to the
complementarity of grazing and firewood collection activities. Increased size
of the household in adult equivalent units would be expected to generate
greater demand for household energy, while lowering the shadow costs of
collecting firewood owing to the greater availability of family labor. In
contrast, higher schooling or nonfarm assets would generate conflicting wealth
and cost of collection effects owing to substitutability between time in modern
occupations and firewood collection.
The coefficient of the number of migrants is insignificant in both
cross-sectional and panel regressions. Again, this is expected as the effect of
migrants on consumption via remittances is already incorporated, besides their
effect on household size.
The last column shows that increases in the median collection time in
the village over time has an insignificant effect on collections. This suggests
that firewood collections are insensitive to collection costs, possibly reflecting
the lack of alternative sources of fuel or the presence of peer effects (see also
Heltberg et al, 2000). However, changes in collection times over time could
reflect changes in unobserved determinants of firewood collections: villages
with faster growing collections could be subject to greater deforestation,
resulting in an increase in collection time. Hence this coefficient is subject to
omitted variable bias. In the next section we explicitly allow collection times
to be endogenously determined. The purpose of including column 5 in Table 3
is to show that the results concerning the relation of collections to
consumption and household assets are robust with respect to controls for
INSERT FIGURE 1 HERE
We next explore the robustness of the results with respect to
functional form of the relationship between collections and consumption.
Figure 1 provides two non-parametric estimations of the Engel curve, relating
changes in household firewood collection to the changes in household
consumption expenditures within the same household. To estimate these
curves, we use the estimator proposed by Baltagi and Li (2002) which allows
consistent estimates in a semi-parametric panel regression.25 The first estimate on the left hand side of the figure includes household and year fixed
effects, while the right hand side also controls for individual assets and village
variables (such as conflict intensity or the presence of a FUG). Again, we find
an inverted-U relationship with a turning point lying somewhere between Rs
100,00 and 200,000. At the higher end the relationship is less clear with fewer
and more scattered observations.
4. Firewood Collection and Household Assets: A Reduced Form Approach
In a rural setting where households collect their own firewood and
spend large amounts of time doing so, it is hard to dispute the possibility that
household consumption, labor allocation and firewood collections are jointly
determined by underlying household and community attributes. Observable
and assets owned, while unobservable attributes include tastes and abilities. A
panel analysis can control for household level unobservables that are fixed
over time, but not those that vary over time. Hence the possibility of
endogeneity bias remains in predicting effects of rising living standards on
firewood collections on the basis of a panel study. This motivates a reduced
form analysis in which collections are related to underlying household assets
rather than consumptions. An added argument for such an approach is that
household consumptions are more prone to measurement error than household
assets.
In this section we pursue such a reduced form approach, in which
collections are related to household demographics and assets. The argument
for using this approach is that the estimated relationships are subject to less
bias, while a large fraction of changes in living standards are expected to be
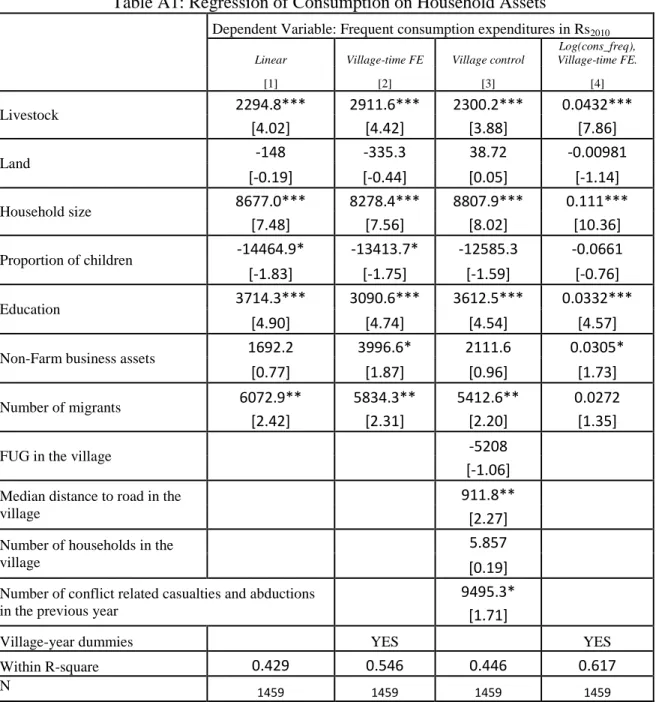
explained by changes in household assets. Table A1 in the Appendix shows
results of a household panel regression of annual recurrent consumption
expenditures on household assets and demographics. Living standards have a
significant coefficient with respect to livestock, household size and education
in all specifications, and a significant coefficient with respect to non-farm
assets and number of migrants in some. These regressions have an R-squared
varying between 40 and 60%. Changes in assets and demographics accounted
for some but not most of the observed growth in consumptions. This implies
that while the results of an asset-based reduced form approach is less prone to
estimation bias, it would not be able to incorporate all the factors generating
growth in living standards. Hence the reduced-form asset-based approach and
Increases in household assets could generate both direct effects on a
household’s own collection activities, as well as external effects of those of its neighbors. These externalities could be of two forms: (i) conformity or peer
effects in which neighbors seek to imitate each other’s behavior, carry them out jointly, or reflect shared community norms concerning common property
access; (ii) congestion effects, wherein increased collections of others reduces
access of any given household to a shared property. The latter includes
possible dynamic effects of collections of any given community on future
collection times. Below we develop a model which incorporates both kinds of
interaction effects, and allows us to estimate direct and indirect spillover
effects of changes in household assets.
4.1 The Reduced Form Model with Social Interactions
Let the amount of firewood collected by household i in village j at
time t be denoted by Cijt. This is a function of various household assets
X
ijt, a household fixed characteristic
i, the time taken to collect one unit of firewood Tijt, a time varying parameter
t, and average collections in the village, Cjt defined by where denotes the number ofhouseholds in the village in year t. Average collections are included here to
reflect the presence of peer effects in collections, for reasons explained above.
We assume the following linear specification:
.
)
1
(
i j t j t i t j j i j t i j tX
T
C
C
Since Tijt measures collection costs, we expect to be negative. The presence of peer effects imply a positive . Since individual collections get reflected in the village average collection which itself influences individual
collections, individual collections are well-defined as long as < 1.
By definition, average collection in the village, Cjt, is the sum of all
individual collections divided by the number of households, Njt:
t i i j t j j t j t i i j t j t i j i j t j j t j t
N
C
N
T
N
X
N
C
1
1
1
1
which can be rewritten as:
(2)
(
1
)
j t v t.
j j j t j tX
T
C
An analogous expression can be derived for the time taken to collect
firewood. The latter depends on household assets and fixed characteristics,
since some activities in the household, such as livestock grazing, are
complementary to firewood collection, while others, such as non-farm
business assets, are not. Moreover, we allow for a congestion effect at the
village level whereby the time necessary to search and collect firewood in the
common forests increases with collections by others. To do this, we explicitly
introduce the average collection at the village level in the determination of
collection times. We thus have:
(3) Ti j t
j
jXi j t
Cj t
i
twhere
reflects the strength of the congestion effects, and is expected to be positive.(4) j t j t j j j t i i j t t j t
T
X
C
N
T
1
Combining equations (2), (3) and (4) together, one obtains after some
simplification: (5) j j t i t j j j j i j t i j t X X T
1 ,where
i,
t represent a time and an individual fixed effect in theindividual collection time. Equation (5) can be directly estimated, with the
coefficients attached to
X
jt directly measuring the importance of thecongestion effect. Using equations (2)-(5), we can also rewrite the collection
equation as follows: (6)
,
1
j t i t j j j j j j i j t i j tX
X
C
where
i,
t represent a time and an individual fixed effect in individual collections. In equation (6), the coefficients attached to theindividual assets combine the direct wealth effect with the possible
complementarity between a particular asset and collection times. The
coefficients attached to the average productive assets combine the (negative)
congestion and the (positive) peer effect, so that the net effect is therefore
indeterminate a priori. If the congestion effect (resp. peer effect) dominates,
we expect the coefficients attached to the average assets to have the opposite
(resp. same) sign to those of the individual assets.
Alternatively, one could directly use equations (1) and (3) to derive
the semi-reduced form expression:
(7)
j t
i i
t,
j j j i j t
i j t
X
C
which, jointly with equation (2), can also be directly estimated. In
equation (7), the sign of the coefficient attached to Cjt directly reflects the
relative strength of peer and congestion effects. However, this strategy is
subject to Manski’s reflection problem, since the average collection reflects exactly the same determinants as individual collections (Manski, 1993). We
shall therefore rely on the reduced form expressions (5) and (6) which relate
collection times and collections of any given household to its own assets, as
well as those of the rest of the village.
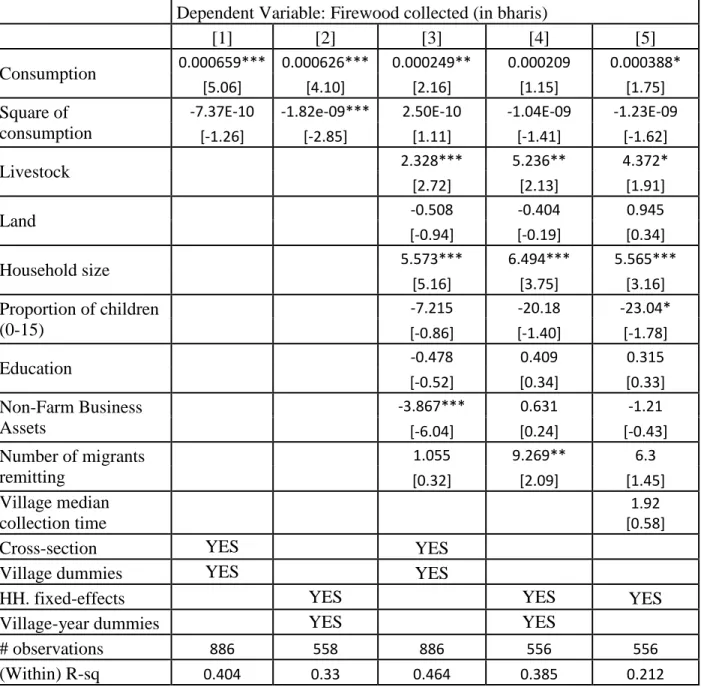
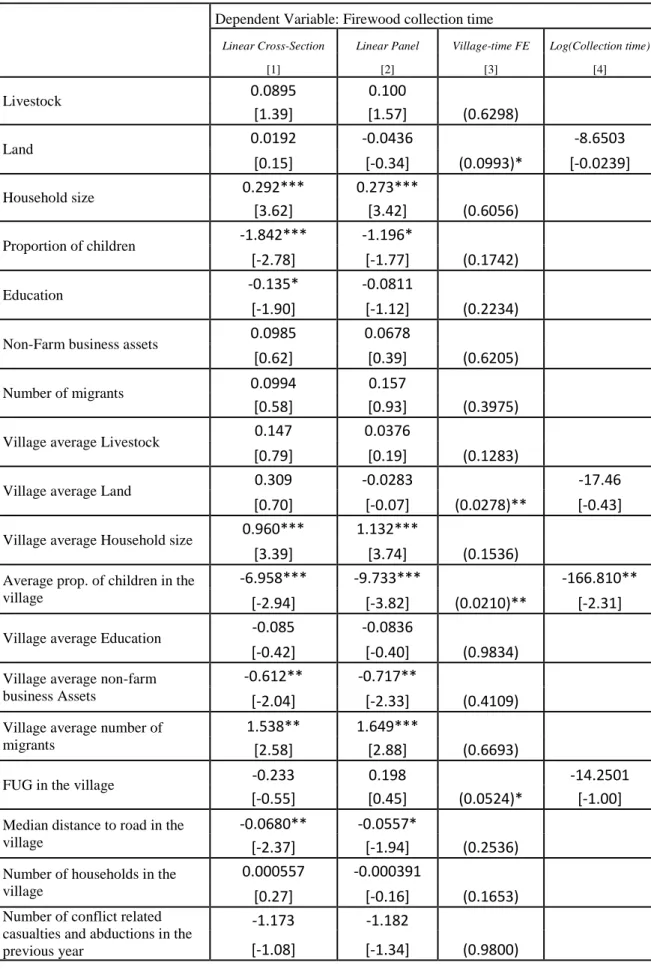
4.2 Regression Results
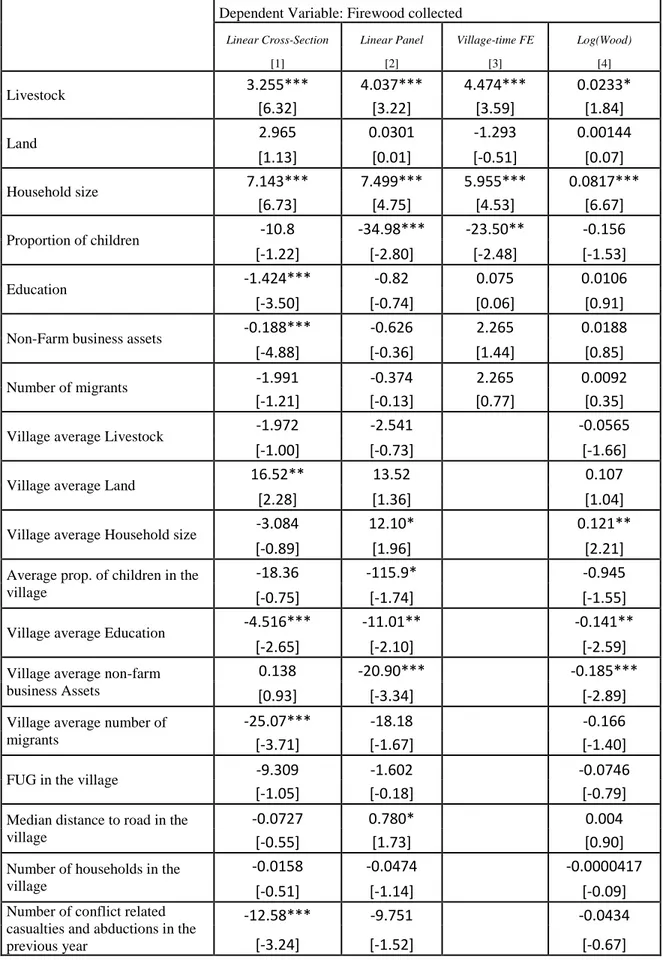
Table 4 reports the results of regressions of household collections on
its own assets as well as village averages of these, corresponding to (6).
Column 1 presents the results of the cross-sectional relationship pooled across
the three waves, while columns 2 and 4 present the panel estimates based on a
linear and log-linear specification respectively. For purposes of comparison
column 3 provides a panel regression based on the linear specification where
the village level asset averages are replaced by village-year dummies. The
household level variables used include livestock, household size, the
proportion of children, the average amount of education among the adults, the
value of non-farm business assets owned and the number of migrating
members in the household. At the village level, we use the village average
level of all these assets, as well as the existence of a FUG, the distance to the
nearest road, the number of households in the village and the intensity of the
conflict in the district26. All regressions include year and seasonal dummies,
INSERT TABLE 4 HERE
The coefficients of the household attributes resemble the results of
Table 3 which featured village-year dummies rather than the village
interaction effects. With regard to the spillover effects in the panel regressions
in columns 2 and 4, we see a significant positive coefficient with respect to
average household size, and a significant negative coefficient with respect to
village average levels of education and non-farm assets. This is consistent
with peer effects dominating congestion effects, assuming the direct effect of
higher education and nonfarm assets is to induce a household to collect less
(which is valid and significant in the cross-sectional relationship, but is
insignificant in the panel).
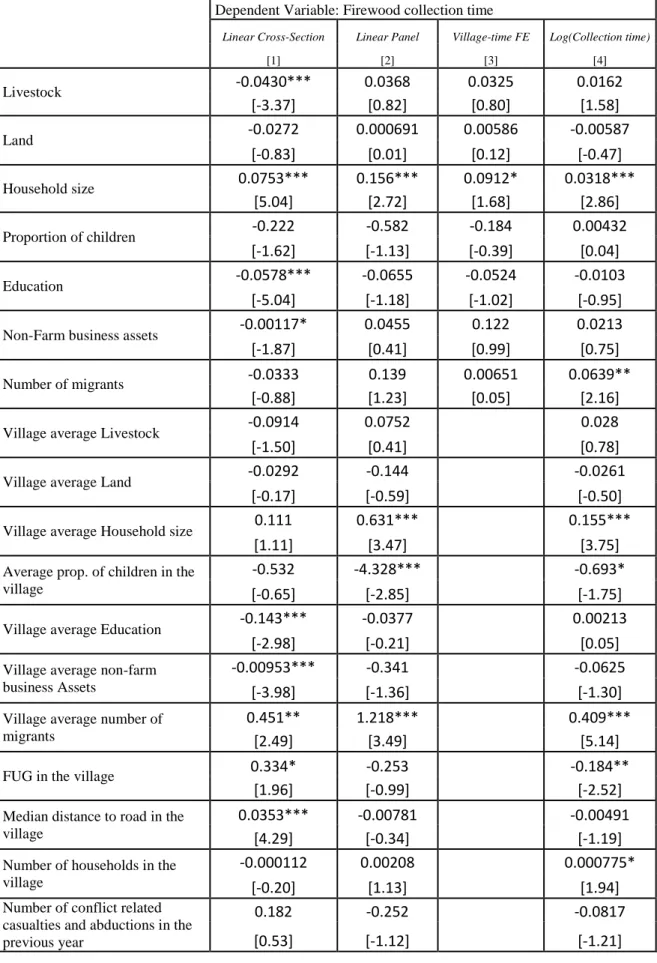
INSERT TABLE 5 HERE
Table 5 shows the regression for collection time
corresponding to specification (5). As in Table 4, the first column shows the
results of the pooled cross-sectional data, while the remaining three columns
show panel estimates. The second and fourth columns include village averages
of various assets, while the third column replaces these by village-year
dummies. In all regressions, collection times are rising in household size
(conceivably owing to collection times rising in the amount collected). The
panel regressions in columns 2 and 4 show that they are also rising in village
average household size, consistent with the existence of congestion effects.
response to higher migrants out of the household (which could owe to the
effect of migrants on collections via their impact on remittances and
consumption), as well as higher village average for migrants per household.
This specification also shows collection times rising with the number of
households in the village. Hence we see some evidence suggesting the
presence of congestion effects. However, the evidence is not strong, as one
would have expected higher average livestock ownership in the village to also
raise collection times. The panel regression shows this effect to be positive but
insignificant.
The coefficients of the FUG variable and the incidence of civil
conflict violations on firewood collections as well as collection times turn out
to be negative and insignificant in the panel regression. While it is difficult to
impute any causal significance to these results, they are nevertheless of some
interest insofar as they suggest that neither the community forestry initiative
nor the civil war had a significant role to play in explaining the observed
decline in collections and collection times. On the other hand, shrinking
distance to paved roads may have reduced collections, as suggested by column
2 in Table 4.
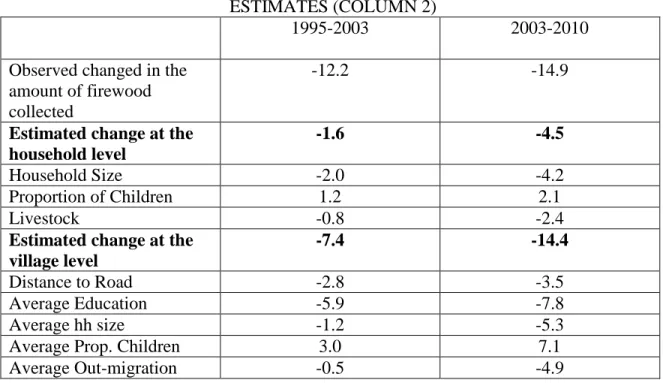
5. Implied Growth Effects
Panel A in Table 6 calculates the predicted changes in firewood
collections implied by the reduced form panel estimates in the linear
specification (column 2) of Table 4, using the observed changes in regressors
associated with falling livestock predicts a 0.8% reduction in collections
between 1995-2003, while changes in household size and composition
accounted for a net reduction of another 0.8%. The corresponding village level
effects predict a substantially larger reduction of 7.4%, owing especially to the
rise in education and proximity to roads. The total predicted effect is a 9.0%
reduction in collections, compared to an observed drop of 12.2%. Similarly,
the model predicts a drop of 19% in collections between 2003-10, the bulk of
which (14.4%) is accounted for by the village interaction effects (which now
includes a 5% drop owing to out-migration). The reduced form model
therefore accounts for the decline in collections at the household level by
falling livestock, rising education and out-migration, and closer proximity to
roads.
INSERT TABLE 6 HERE
Panel B of Table 6 shows the changes in collections predicted by the
observed changes in consumption implied by the estimated Engel relationship
in column 4 of Table 3. The effects of rising consumption outweighs the direct
effect of higher livestock and changing household demographics, generating a
predicted increase in collections by 3.8% between 1995-2003 and by 25.4%
over 2003-2010. Evidently the projections based on growth in living standards
grossly over-predict increases in collections, even if they incorporate changes
in assets that accounted for part of the observed increase in consumption.
Failure to incorporate spillover effects of asset increases owing to social
interactions cause the model underlying Table 3 to fail to predict some of the
6.Robustness Checks
Table 7 examines robustness of the estimated Engel curves with
respect to the control for FUGs. Recall that about half the sample already had
a FUG in 1995, so Table 7 reports results from re-estimation of the
regressions in Table 3 for this sub-sample. We continue to obtain an
inverted-U relationship, which is significant in the panel regression only in column 2
with village-year dummies. With a halving of the sample size, the loss in
precision of estimates is not surprising. The effects of livestock, household
size and composition continue to hold.
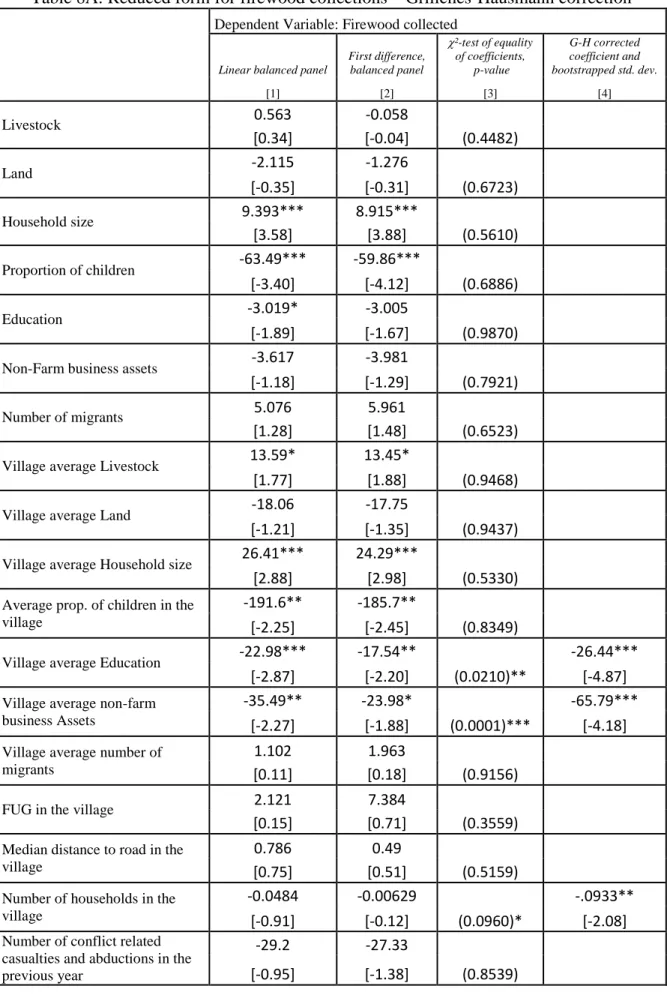
Table 8A tests for measurement error in the panel estimates of
the reduced form using the Griliches-Hausman (1996) test comparing the first
difference and within-estimators for the balanced sample of households that
were surveyed in all three rounds. None of the direct effects of
household-level attributes shows a significant difference between these estimators. We do
see a significant difference for the village level effects for education, non-farm
assets and number of households in the village. The estimates obtained for
these upon applying the Griliches-Hausman corrections are statistically
significant and of larger magnitude. Hence corrections for measurement error
do not affect the main qualitative conclusions, and would result in predicting
larger declines in firewood collected compared with the results in Panel A of
Table 8B shows the corresponding tests for bias owing to
measurement error in the reduced form estimates of collection time in Table 5.
We see significant differences between the within and first-difference
estimators only for land, proportion of children and FUG presence. Upon
applying the Griliches-Hausman correction, only the proportion of children
has a coefficient significant at 5%, with the corrected estimate of substantially
larger magnitude. Hence the results of Table 5 continue to be robust.
7. Relation to Existing Literature and Concluding Comments
The only longitudinal study on deforestation in South Asia that we are
aware of is Foster and Rosenzweig (2003). They studied a panel of 250
villages all over India, over the last three decades of the 20th century,
combining satellite imagery and census data. The satellite data showed
evidence of reforestation, while the household data showed increased demand
for wood and wood products accompanying the rise in their living standards.
They argue that the increasing demand for wood products induced
reforestation. We do not have any data on forest cover in Nepal, while our
findings on household firewood collection patterns are consistent with their
findings on household demands. Hence our results are broadly consistent with
theirs, despite pertaining to a different country and period of analysis.
Chaudhury and Pfaff (2003) find evidence of an EKC in indoor air
pollution, using a cross-sectional analysis of the Pakistan World Bank LSMS
consume more energy, they switch to cleaner and more efficient fuels
(kerosene) which reduces the amount of indoor pollution.
This is also in line with numerous cross-section studies on Nepal and
rural India which suggest that firewood is a normal good for all but the
wealthiest households (see in particular Heltberg et al, 2000; Arnold et al,
2003; Adhikari et al, 2004, Baland et al 2007 and Gundemida and Kohlin,
2008). The switch of high incomes households to higher quality but more
expensive substitutes (gas or kerosene) is known as the ‘energy-ladder’ hypothesis, and is often viewed as an important mechanism behind the EKC
(see Arnold et al, 2003). Recent evidence from China suggests that firewood is
becoming an inferior good in China, with coal being used as a superior
alternative (Demurger and Fournier, 2011). Baland et al (2007) find the
demand for firewood in Indian Himalayas to be sensitive to the price of
kerosene. These earlier findings are consistent with our evidence in favor of
an EKC, and provide a possible explanation for this pattern. However, the
evidence concerning EKC in preceding literature has been based on
cross-sectional analyses, without checks for robustness with respect to unobserved
heterogeneity, functional form or measurement error.
On the other hand, the lack of data in the LSMS concerning cost and
access to modern fuel substitutes prevented us from using the panel data to
explore the nature of household substitution between firewood and modern
fuels. Nevertheless, the results of this paper are consistent with the previous
assessments of Baland et al (2007, 2010a) for the Indian Himalayas and rural
Nepal respectively based on cross-sectional evidence: that growth of
moderated by rising education, transition to modern occupations and access to
modern fuel substitutes.27
Bibliography
Adhikari B., S. Di Falco and J. C. Lovett, Household characteristics
and forest dependency: evidence from common property forest management
in Nepal, Ecological Economics, 2004, 48, 245-57.
Agrawal A. and G. Yadama, How do Local Institutions Mediate
Market and Population Pressures on Resources? Forest Panchayats in
Kumaon, India, Development and Change, 1997, Vol. 28, 435-465.
Amacher G. S., W. F. Hyde and Keshav Kanel, Household Fuelwood Demand and Supply in Nepal’s Tarai and Mid-Hills: Choice between Cash Outlays and Labor Opportunity, World Development, 1996, Vol. 24(11),
1725-1736.
Arnold M., G. Kohlin, R. Persson and G. Shepherd, Fuelwood
Revisited: What has Changed over the Last Decade?, CIFOR occasional
paper n° 39, 2003.
Arrow, K., Bolin, B., Costanza, R., Dasgupta, P., Folke, C., Holling,
Economic Growth, Carrying capacity, and the Environment, Science, 1995,
Vol. 268, pp. 520-521
Baland, J.-M., Bardhan, P., Das, S., Mookherjee, D. and Sarkar, R.,
The Environmental Impact of Poverty: Evidence from Firewood Collection in
Rural Nepal, Economic Development and Cultural Change, 2010a, Vol. 59(1),
pp. 23-61
Baland, J.-M., Bardhan, P., Das, S. and Mookherjee, D., Forests to the
People: Decentralization and Forest Degradation in the Indian Himalayas,
World Development, 2010b, Vol. 38(11), pp. 1642 - 1656
Baland, J.-M., Bardhan, P., Das, S., Mookherjee, D. and Sarkar, R.,
Managing the Environmental Consequences of Growth: Forest Degradation in
the Indian Mid-Himalayas, Indian Policy Forum, Brookings Institution and
National Council of Applied Research, 2007, pp. 215-266
Baland J.-M. and J.-Ph. Platteau, Halting Degradation of Natural
Resources: Is there a Role for Rural Communities, 1996, Oxford University Press
Baltagi B.H. and D. Li, Series estimation of partially linear panel data
models with fixed effect, Annals of economics and finance, 2002, Vol. 3, pp.
Barbier, E., The Economic Determinant of Land Degradation in
Developing Countries, Philosophical Transactions of the Royal Society,
1997a, Vol. 352, pp. 891-899
Barbier, E., Introduction to the environmental Kuznets curve special
issue, Environment and Development Economics, 1997b, Vol. 2(04), pp.
369-381
Barbier, E., The Concept of Sustainable Economic Development and
Natural Capital and the Economics of Environment and Development in The
Economics of Environment and Development: Selected Essays, 1998, Cheltenham: Edward Elgar
Barbier, E., Contribution to Session G1b. Effects of Deforestation and
Degradation on Poverty; Co-Location of Deforestation and Poverty Due to
Common Causal Factors, Workshop on Poverty, Environment and
Growth-Oriented Policies, 1999, World Bank, Washington D.C.
Bluffstone, R.A., The Effect of Labor Market Performance on
Deforestation in Developing Countries under Open Access: An Example from
Rural Nepal, Journal of Environmental Economics and Management, 1995,
Vol. 29(1), pp. 42 – 63
Bohara, A.K., Mitchell, N.J. and Nepal, M, Opportunity, Democracy,
and the Exchange of Political Violence: A Subnational Analysis of Conflict in
Chaudhuri S. and Pfaff A. S.P., Fuel Choice and Indoor Air Quality: a
household-level perspective on economic growth and the environment, 2004,
Department of Economics, Columbia University.
Dasgupta, P., Levine, S. & Lubchenco, J., Economic Pathways to
Ecological Sustainability, Bioscience, 2000, Vol. 50(4), pp. 339-345
Dasgupta, P. & Mäler, K.-G., Poverty, institutions, and the
environmental resource-base, Behrman, J. & Srinivasan, T. (ed.), Handbook of
Development Economics, Chapter 39, Elsevier, 1995, Vol. 3, Part 1, pp. 2371-2463
Dasgupta, P. and K.-G. Mäler, Environmental and Resource
Economics: Some Recent Developments, 2005, working paper.
Démurger S. and M. Fournier, Poverty and firewood consumption: A
case study of rural households in northern China, China economic review,
2011, Vol. 22(4), pp. 512-523
Do, Q.-T. & Iyer, L., Geography, poverty and conflict in Nepal,
Journal of Peace Research, 2010, Vol. 47(6), pp. 735-748
Duraiappah, A.K., Poverty and Environmental Degradation: A
Review and Analysis of the Nexus, World Development, 1998, Vol. 26, pp.
Edmonds, E.V., Government-initiated community resource
management and local resource extraction from Nepal's forests, Journal of
Development Economics, 2002, Vol. 68(1), pp. 89-115
Foster, A. & Rosenzweig, M., Economic Growth and the Rise of
Forests, Quarterly Journal of Economics, 2003, Vol. 118(2), pp. 601-637
Grossman G. and A. Krueger, Economic Growth and the
Environment, Quarterly Journal of Economics, 1995, Vol. 110, pp. 353-377
Gundimeda H. and G. Kohlin, Fuel Demand Elasticities for Energy
and Environmental Policies: Indian Sample Survey Evidence, 2005,
manuscript.
Hatlebakk, M., Explaining Maoist Control and Level of Civil Conflict
in Nepal, CMI (Chr. Michelsen Institute), Bergen, Norway, 2009(10), working
paper.
Heltberg, R., Arndt, T.C. & Sekhar, N.U., Fuelwood Consumption
and Forest Degradation: A Household Model for Domestic Energy
Substitution in Rural India, Land Economics, 2000, Vol. 76(2), pp. 213-232
Jalal, K.F., Sustainable Development, Environment and Poverty
Jodha, N.S., Life on the edge: sustainable agriculture and community
resources in fragile environments, 2001, Oxford University Press, New Delhi
Kanel, K.R., Promise, Trust and Evolution, Gate, R., Jodha, N. S. &
Mukhopadhyay, P. (ed.), Chapter So far so good: Next steps in Community
forestry, Oxford: Oxford University Press, 2008, pp. 370-390
Lele Sh., Sustainable Development: A Critical Review, World
Development, 1991, Vol. 19(6), pp. 607-621
Libois, F and V. Verardi, Semiparametric Fixed-Effects Estimator,
Stata journal, 2013, forthcoming
Lopez R., Where Development Can or Cannot Go: The Role of
Poverty-Environment Linkages, in 1997 Annual World Bank Conference in
Development Economics, edited by B. Pleskovic and J. Stiglitz, 1998, Washington D.C.: World Bank
Maler K. G., Environment, Poverty and Economic Growth, in 1997
Annual World Bank Conference in Development Economics, edited by B. Pleskovic and J. Stiglitz, 1998, Washington D.C.: World Bank
Manski, C.F., Identification of Endogenous Social Effects: The
Reflection Problem, Review of Economic Studies, 1993, Vol. 60(3), pp.
Nepal M., A.K. Bohara and K. Gawande, More Inequality, More
Killings: The Maoist Insurgency in Nepal, American Journal of Political
Science, 2011, Vol. 55(4), pp. 886-906
Nepal M., A. Nepal and K. Grimsrud, Unbelievable but True –
Improved cook-stoves are not helpful in reducing firewood demand in Nepal,
SANDEE Working Paper, 2010, n°51-10
Pattanayak, S.K., Sills, E.O. and Kramer, R.A., Seeing the forest for
the fuel, Environment and Development Economics, 2004, Vol. 9(02), pp.
155-179
Shyamsundar, P. and R. Ghate, 2011, ‘Rights, responsibilities and resources: Examining Community Forestry in South Asia’. Kathmandu: SANDEE working paper.
Somanathan E., Seeing Deforestation, property rights and incentives
in the Central Himalayas, Economic and Political Weekly, 1991, Vol. 26, pp.
37-46
Somanathan, E., Prabhakar, R. and Mehta, B.S., Decentralization for
cost-effective conservation, Proceedings of the National Academy of Sciences
of the United States of America, 2009, Vol. 106(11), pp. 4143-4147
UNEP, 2011,
mentinNepal/tabid/29869/Default.
Varughese G. and E. Ostrom, The contested role of heterogeneity
incollective action: Some evidence from community forestry in Nepal, World
Development, 2001, Vol. 29(5), pp. 747-765
Yandle B., M. Vijayaraghavan and M. Bhattarai, The
Environmental Kuznets Curve: A Primer, Political Economy Research Center, Center for Free Market Environmentalism, Montana
World Bank, 2000, India: Alleviating Poverty through Forest
Development, The International Bank for Reconstruction and
Table 1: Descriptive statistics of the main variables
Variable
Unit of measurement
year Median mean st. dev. min Max
Nb. 0
Recurrent consumption
expenditures Rs per year
1995/6 60435.0 68466.6 40545.3 6259.6 275603.5 0 2003/4 2010/1 67308.2 106194.1 76440.4 116202.3 45112.6 59337.1 6984.4 10863.0 305579.4 358484.3 0 0
Firewood collected # Bharis per year 1995/6 2003/4 84 78 100.74 89.30 71.10 54.03 0 0 360 300 35 30 2010/1 60 75.53 61.66 0 600 36
Firewood collection time, for
household reporting collection # hours per bhari
1995/6 2003/4 4 3.20 4.83 3.61 2.73 1.75 0.17 0.02 25.02 10 0 0 2010/1 3 3.76 2.19 0.5 10 0
Livestock # of big cattle heads 1995/6 3 3.84 2.84 0 15 40 2003/4 2010/1 4 3 3.74 3.36 2.57 2.41 0 0 16 12 70 50
Land # hectares owned
1995/6 0.48 0.92 1.8 0 20.69 12 2003/4 2010/1 0.54 0.50 0.75 0.71 0.96 0.91 0 0 15.58 11.47 31 16
Household size # individuals
1995/6 5 5.4 2.29 1 17 0 2003/4 2010/1 5 5 5.24 4.81 2.27 2.17 1 1 13 12 0 0
Proportion of children (0-15) share of household size 1995/6 0.44 0.41 0.23 0 0.86 58 2003/4 2010/1 0.4 0.35 0.39 0.34 0.24 0.24 0 0 1 1 117 101 Average education of adults in
the households # of years of education 1995/6 2003/4 2010/1 1 1.67 2.67 1.82 2.30 2.99 2.40 2.60 2.91 0 0 0 15 12.5 13.5 197 238 121
Non-farm business assets 1000 Rs
1995/6 0 0.3218 0.8271 0 7 348 2003/4 2010/1 0 0 0.3722 0.5508 1.0274 1.3587 0 0 9 11 512 293
Number of migrants sending
remittances # of people 1995/5 2003/4 2010/1 0 0 1 0.28 0.44 1.62 0.54 0.70 0.94 0 0 1 3 5 8 330 412 0
Number of households in the
village # of households 1995/6 2003/4 2010/1 89 98 77 109.63 116.15 123.56 98.10 104.20 168.07 28 34 30 600 670 856 0 0 0
Village median distance to paved road Walking time in hours 1995/6 2003/4 2010/1 10 8 4 14.46 11.20 7.10 14.99 12.78 9.10 0.08 0.08 0 70 70 43 0 0 1 Casualties and abductions in
the 12 months before the survey
# Casualties and abductions per 1000 inh.
2003 0.25 0.35 0.26 0 1.16 1
Villages with community
forest % 1995/6 1 53.65 50.49 0 1 19 2003/4 2010/1 1 1 80.00 92.68 40.34 26.37 0 0 1 1 12 9
Table 2: Collection times and number of collectors by main source of collection Primary source of firewood collection Number of hh collecting in 1995 Number of hh collecting in 2003 Number of hh collecting in 2010 Mean collection time in 1995 Mean collection time in 2003 Mean collection time in 2010 (std. dev.) (std.dev.) (std.dev.)
Private land 114 176 116 3.9 2.6 2.7 (2.9) (1.2) (1.5) Community forests 40 201 146 4.6 4.1 4.4 (2.8) (1.9) (2.0) State forests 235 196 84 5.4 4.1 4.1 (2.5) (1.6) (2.2) Other land (roadsides,… ) 11 31 12 3.0 3.2 2.8 (1.8) (1.2) (1.2) Total collectors 400 604 358 4.8 3.6 3.8 (2.7) (1.7) (1.9) Non collectors 35 30 36 --- --- ---
Table 3: Engel Curves
Dependent Variable: Firewood collected (in bharis)
[1]
[2]
[3]
[4]
[5]
Consumption
0.000584*** 0.000809*** 0.000363*** 0.000540*** 0.000675***[5.31] [6.49] [4.13] [3.52] [4.53]
Square of
consumption
-8.15e-10*** -2.24e-09*** -5.08e-10*** -1.69e-09*** -2.06e-09***
[-4.24] [-5.71] [-3.63] [-4.23] [-4.81]
Livestock
2.868*** 3.840*** 2.969** [5.67] [3.02] [2.09]Land
0.569 -1.167 -0.372 [0.31] [-0.46] [-0.15]Household size
5.267*** 4.355*** 4.966** [5.47] [2.70] [2.64]Proportion of children
(0-15)
-5.938 -21.85** -32.78*** [-0.69] [-2.33] [-2.72]Education
-2.195*** -0.300 -1.411 [-3.77] [-0.23] [-1.19]Non-Farm Business
Assets
-0.242*** 2.319 -1.51 [-5.11] [1.53] [-1.04]Number of migrants
remitting
0.0956 2.823 -1.699 [0.07] [1.12] [-0.65]Village median
collection time
0.925 [0.32]Cross-section
YES
YES
Village dummies
YES
YES
HH. fixed-effects
YES
YES
YES
Village-year dummies
YES
YES
# observations
5179 1463 5175 1459 1459(Within) R-sq
0.199 0.324 0.211 0.351 0.152Note: t statistics in brackets, * p<0.05, ** p<0.01, *** p<0.001. In all estimates, we include year and seasonal dummies. The standard errors are clustered at the village level.
Table 4: Reduced form for firewood collections
Dependent Variable: Firewood collected
Linear Cross-Section Linear Panel Village-time FE Log(Wood) [1] [2] [3] [4] Livestock 3.255*** 4.037*** 4.474*** 0.0233* [6.32] [3.22] [3.59] [1.84] Land 2.965 0.0301 -1.293 0.00144 [1.13] [0.01] [-0.51] [0.07] Household size 7.143*** 7.499*** 5.955*** 0.0817*** [6.73] [4.75] [4.53] [6.67] Proportion of children -10.8 -34.98*** -23.50** -0.156 [-1.22] [-2.80] [-2.48] [-1.53] Education -1.424*** -0.82 0.075 0.0106 [-3.50] [-0.74] [0.06] [0.91]
Non-Farm business assets -0.188*** -0.626 2.265 0.0188
[-4.88] [-0.36] [1.44] [0.85]
Number of migrants -1.991 -0.374 2.265 0.0092
[-1.21] [-0.13] [0.77] [0.35]
Village average Livestock -1.972 -2.541 -0.0565
[-1.00] [-0.73] [-1.66]
Village average Land 16.52** 13.52 0.107
[2.28] [1.36] [1.04]
Village average Household size -3.084 12.10* 0.121**
[-0.89] [1.96] [2.21]
Average prop. of children in the village
-18.36 -115.9* -0.945
[-0.75] [-1.74] [-1.55]
Village average Education -4.516*** -11.01** -0.141**
[-2.65] [-2.10] [-2.59]
Village average non-farm business Assets
0.138 -20.90*** -0.185***
[0.93] [-3.34] [-2.89]
Village average number of migrants
-25.07*** -18.18 -0.166
[-3.71] [-1.67] [-1.40]
FUG in the village -9.309 -1.602 -0.0746
[-1.05] [-0.18] [-0.79]
Median distance to road in the village
-0.0727 0.780* 0.004
[-0.55] [1.73] [0.90]
Number of households in the village
-0.0158 -0.0474 -0.0000417
[-0.51] [-1.14] [-0.09]
Number of conflict related casualties and abductions in the previous year
-12.58*** -9.751 -0.0434
Household fixed-effects YES YES YES
Village-year dummies YES
(Within) R-square 0.0519 0.173 0.338 0.199
N 5037 1459 1459 1358
Note: t statistics in brackets, * p<0.10, ** p<0.05, *** p<0.01. In all estimates, we include year and seasonal dummies. The standard errors are clustered at the level of the village.
Table 5: Reduced form for firewood collection time
Dependent Variable: Firewood collection time
Linear Cross-Section Linear Panel Village-time FE Log(Collection time) [1] [2] [3] [4] Livestock -0.0430*** 0.0368 0.0325 0.0162 [-3.37] [0.82] [0.80] [1.58] Land -0.0272 0.000691 0.00586 -0.00587 [-0.83] [0.01] [0.12] [-0.47] Household size 0.0753*** 0.156*** 0.0912* 0.0318*** [5.04] [2.72] [1.68] [2.86] Proportion of children -0.222 -0.582 -0.184 0.00432 [-1.62] [-1.13] [-0.39] [0.04] Education -0.0578*** -0.0655 -0.0524 -0.0103 [-5.04] [-1.18] [-1.02] [-0.95]
Non-Farm business assets -0.00117* 0.0455 0.122 0.0213
[-1.87] [0.41] [0.99] [0.75]
Number of migrants -0.0333 0.139 0.00651 0.0639**
[-0.88] [1.23] [0.05] [2.16]
Village average Livestock -0.0914 0.0752 0.028
[-1.50] [0.41] [0.78]
Village average Land -0.0292 -0.144 -0.0261
[-0.17] [-0.59] [-0.50]
Village average Household size 0.111 0.631*** 0.155***
[1.11] [3.47] [3.75]
Average prop. of children in the village
-0.532 -4.328*** -0.693*
[-0.65] [-2.85] [-1.75]
Village average Education -0.143*** -0.0377 0.00213
[-2.98] [-0.21] [0.05]
Village average non-farm business Assets
-0.00953*** -0.341 -0.0625
[-3.98] [-1.36] [-1.30]
Village average number of migrants
0.451** 1.218*** 0.409***
[2.49] [3.49] [5.14]
FUG in the village 0.334* -0.253 -0.184**
[1.96] [-0.99] [-2.52]
Median distance to road in the village
0.0353*** -0.00781 -0.00491
[4.29] [-0.34] [-1.19]
Number of households in the village
-0.000112 0.00208 0.000775*
[-0.20] [1.13] [1.94]
Number of conflict related casualties and abductions in the previous year
0.182 -0.252 -0.0817
Household fixed-effects YES YES YES
Village-year dummies YES
Within R-square 0.144 0.187 0.363 0.164
N 4695 1358 1358 1358
Note: t statistics in brackets, * p<0.10, ** p<0.05, *** p<0.01. In all estimates, we include year and seasonal dummies. The standard errors are clustered at the level of the village.